93212280f9b87dd755be3fa7d132ded5.ppt
- Количество слайдов: 35


ANNUAL REPORT PRESENTATION Celebrating a decade of water services delivery in a democracy

ANNUAL REPORT H KASAN TARIFFS K NAICKER WATER BOARD ACCOUNTABILITY P CAMAY

CONTENT • • Rand Water profile Customer Sales profile Sales trend Cost of raw water Projected input costs vs CPIX Gross profit Profitability

CONTENT CONT • Value creation • Return on assets • Business performance Indicators • Performance Highlights • Social responsibility trend • Future developments • Decade of Service Delivery - Review

Rand Water profile • • • Largest water utility in Africa Bulk water supply increase to 3 414 M /d (3340 M /d : 2003) Supplies 12 million people daily Sole area of service 18 000 km² 13 000 km² joint area of service with other Water Boards

Rand Water profile cont • Turnover : R 3 258 bn ( R 2 884 bn : 2003) • Assets • Staff employed • Corporate ISO 9001 : 2000 accredited • All plants ISO 14001 accredited : R 5 232 bn (R 4 892 bn : 2003) : 3 097 (3 108 : 2003)

CUSTOMER SALES PROFILE

SALES TREND

COST OF RAW WATER

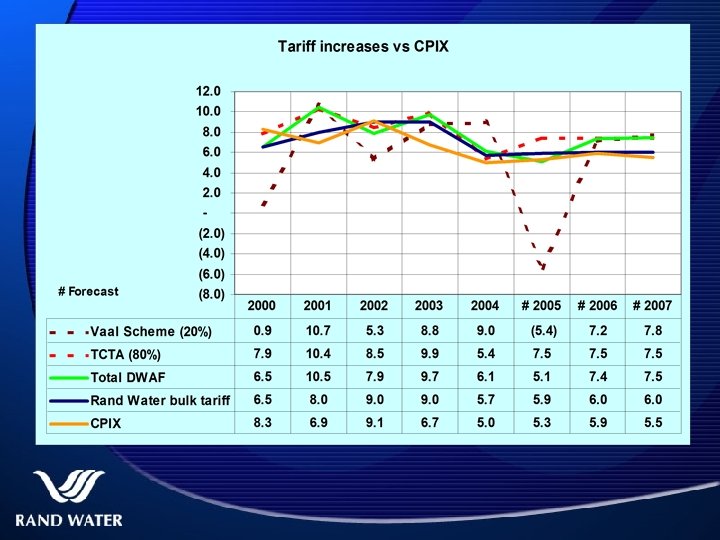
PROJECTED INPUT COSTS VS CPIX

GROSS PROFIT

PROFITABILITY

VALUE CREATION

RETURN ON ASSETS %
 ? • • • Capital investment planned for")
PROFITABILITY Why generate large surplus (profit) ? • • • Capital investment planned for next 5 years = R 2, 5 billion To access funds (debt) at lowest cost to fund capital investment No loans from government No guarantees from government Ensure sustainability Not profiteering but recovering cost of capital

BUSINESS PERFORMANCE INDICATORS KPI Profit Margin Net income per Employee Unit 2001 2002 2003 2004 % 3, 8 7, 8 9, 7 11. 5 90. 44 121. 08 R’ 000 25. 83 62. 30 Interest cover X 1, 6 2. 1 2. 8 3. 6 Return on Assets % 5. 1 7. 5 9. 0 9. 9 Ave costs of capital % 13. 00 12. 00 13. 45 13. 00

BUSINESS PERFORMANCE INDICATORS CONT KPI Debt/Equity Unit % 2001 2002 2003 2004 98% 84% 69% AA Credit Rating 99% AA AA AA Assets T/O Ratio X 0. 6 0. 7 0. 8 Current Ratio X 1. 1 1. 2 1. 5 1. 8 Cents 90 98. 9 98 106 Operational costs/kℓ sold

BUSINESS PERFORMANCE INDICATORS Employee Productivity Ratios 2001 2002 2003 2004 Employees 3249 3105 3108 3097 K sold 1, 097, 437, 836 1, 147, 865, 347 1, 216, 342, 585 1, 252, 828, 263 K per employee 337, 777 369, 683 391, 359 404, 530 Revenue R’ 000 2, 180, 150 2, 480, 727 2, 884, 405 3, 258, 055 Income per employee R’ 000 671, 02 798, 95 928, 06 1052, 00 Profit per employee R’ 000 25. 83 62. 30 90. 44 121. 08

PEFORMANCE HIGHLIGHTS • Surplus : R 375 million 33% 13% • Revenue: R 3 258 million • Cash generated from operations 9, 1% • Increase in sales 2, 2%

PERFORMANCE HIGHLIGHTS cont 2003 • • • 2004 Customer SLA evaluation 89% 88% Customer Satisfaction Index 77% Training spend ( as % of Total Payroll) 6, 6% 7% 60% 64% 42, 3% 46% • Designated groups at management • BEE spend

SOCIAL RESPONSIBILITY TREND Categories 2002 2003 2004 R 445 692 R 615 503 R 639 279 485 002 505 248 R 637 652 R 325 125 R 361 435 R 548 055 R 18 824 178 R 16 281 989 R 14 840 968 Foundation N/A R 3 000 Total Spent R 20 079 992 R 17 764 175 R 19 665 954 435 648 Schools Programme Health HIV/Aids Community Development CBPD ( Part sourced externally) Jobs created

FUTURE DEVELOPMENTS RAND WATER SERVICES • Providing water services value adding to municipalities in South Africa • Back-up supply for SASOL R 40 million pipeline • NEPAD initiatives

FUTURE DEVELOPMENTS cont INFRASTRUCTURE PROJECTS • BRAKFONTEIN/RUSTENBURG 80 KM PIPELINE : R 450 million currently doing environmental impact • WESTERN HIGHVELD REGION PROJECT : R 113 million of which R 40 million is from Rand Water

FUTURE DEVELOPMENTS CONT. • A total of R 2, 5 billion capital investment is planned over the next 5 years • R 962 million in infrastructure development projects in progress

DECADE OF SERVICE DELIVERY - REVIEW

DECADE OF SERVICE DELIVERY • Participated in Presidential Lead projects Winterveldt, Bushbuckridge (R 142 m) • The project facilitated supply through 3 500 communal standpipes – benefiting approximately 1 million people • R 215 million worth of projects implemented by CBPD • Winterveldt sanitation project – more than 2 540 toilets for Winterveldt built (R 8, 3 m) benefiting 25 000 people

DECADE OF SERVICE DELIVERY • • Integrated Water Demand Management Interventions: R 60 million Established Rand Water Services Pty (Ltd) Launched Rand Water Foundation Significant Transformation within the organization • Designated group – Management level 64% (33% : 2000) • Women representation in management, professional and supervisory – 28, 2% (22% : 2000)

RAND WATER IS

Tariff Setting & Accountability Rand Water Affairs & Forestry Portfolio Committee October 2004

ISSUES • • Municipal Financial Management Act: 6 months advance notice National Treasury & SALGA: 40 days for consideration Bulk Water Supply Contract: prior consultation and information sharing Core/Primary activity vs. non-core

ISSUES – Core vs. Non-core CORE Bulk Water Bulk Sanitation Rand Water Board NON-CORE Retail Water Community Projects Business Devt. Farm Operations Pipe Manufacturing Rand Water Services (Pty) Ltd

PROCESS • • DWAF raw water pricing Board prelim. approval Customer Consultation & Information Sharing Board prelim. approval Submission to Treasury and SALGA Board final approval Customer Notification Parliamentary approval Aug. 2004 Sept. 2004 Oct. 2004 Dec. 2004 March 2005


THANK YOU
93212280f9b87dd755be3fa7d132ded5.ppt