

2752edfd26559111c702dd06015cbd75.ppt
- Количество слайдов: 84
 Analyst Presentation 2002 Welcome
") Programme • Strategic Review • Financial Results • Healthcare • New Clicks Australia (NCA) Review • New Clicks South Africa (NCSA) Review • Questions
Programme • Strategic Review • Financial Results • Healthcare • New Clicks Australia (NCA) Review • New Clicks South Africa (NCSA) Review • Questions
 Strategic Review • Vision • Mission • Positioning Statement
 Our Vision We wish to be a world-class trans-national player, specialised and highly networked with local market responsiveness and accountability, rapid distribution capability, adding value to the quality of life through the convenient supply of health, home and beauty products and services with a preferential interactive relationship with our customers
 Our Mission To be a major multi-brand retailer of Health, Lifestyle and Beauty products in the Asia Pacific Region by 2005, without limiting our activities and dominance in southern Africa
 Our Positioning Statement We are world-class originators and distributors of a range of compelling and differentiated health, lifestyle and beauty retail products and services to multiple brand formats in a variety of ownership models.
 GSF Trevor Honneysett…. . David Nurek…………. Allen Zimbler………… Errol Gray……………. Jeff Sher……………. . Peter Green…………. Raymond Godfrey…. . Simon Burrow………. Simon Kilner………… George Meiliunas…… Group Leader Non-Executive Chairman Non-Executive Director NCSA Country Leader NCA Country Leader Group Finance Group Merchandise Group Marketing Group IT/Supply Chain Group OD
 Agenda • High-level financial overview • Purchase Milton & Associates • Healthcare update - South Africa
 Financial Results for year ending 31 August 2002
 Income Statement • Turnover • Operating Profit • Operating Margin Excluding Discom • Operating Profit • Operating Margin R 5. 5 bn R 318 m +25. 7% +21. 3% 5. 8% +31. 9% 7. 04%
 Goodwill Balance Sheet Rm Link 16. 120 House 78. 304 Price Attack 88. 078 Total 182. 502 Income Statement Rm 0. 895 9. 042 1. 419 11. 346
 Accounts Receivable • Increases due to: – acquisitions – franchisees SA Aus 2002 2001 Rm Rm 120. 353 82. 630 76. 271 24. 640 Total 196. 624 107. 270
 Accounts Payable • Increases due to extending terms
 Cash Flow • Big Improvement – Improving Working Capital Cash Flow from Operating 2002 2001 Rm Rm 296. 927 145. 337
 Future Focus • Continue to focus on: – Asset turnover (stock turn goal 7 x over 3 years) – Cash generation – Improving margins (goal still 8%) - (UPD will lower margin but has high asset turnover) • Resulting in improving: – Returns and EVA (ROE goal still 30%)
 Strengthened Financial structure as we go forward • Appointment of CFO in each geography • Focus on efficiency improvements • Trans-national project: – cost centres to profit centres - franchising – process innovation to reduce overall costs – strict financial regime
 2002 Rm 276. 900 45. 5 11. 4 2001 Rm") Loan to Pharmacy (PM&A) 2002 Rm 276. 900 45. 5 11. 4 2001 Rm 239. 028 10. 1 4. 0 Loan Interest charge Cost recovery • Interest turn • Fees income Link • Loan impairment & recoverability
Loan to Pharmacy (PM&A) 2002 Rm 276. 900 45. 5 11. 4 2001 Rm 239. 028 10. 1 4. 0 Loan Interest charge Cost recovery • Interest turn • Fees income Link • Loan impairment & recoverability
 PM&A • They are budgeting high profit growth as they consolidate • Some of the largest stores were acquired • Acquisitions stopped - consolidation phase - convert to largest and most profitable chain of Pharmacies in SA • Operating profit could exceed 10% if we could integrate (7% otherwise) • Cash generating
 Healthcare SA
 NCH New Clicks Holdings South Africa Funding & Suspensive Sale 56% LIT PM&A 100% Ownership Franchise Stores 248 Stores 76 Stores R 2 Billion R 1 Billion
 NCH Fees for Services New Clicks Holdings South Africa Wholesale Margin & Rebates Interest 56% LIT Franchise Fees, LOB, Rebates Franchise Stores Funding PM&A 100% Ownership
 – income from") Different store ownership models • There will always be franchise (LINK) – income from fees, rebates, wholesale profits but if law allows there will also be: • pharmacies in Clicks & Discom • 100% ownership (PM&A) • JV (80%: 20% for any of the brands)
Different store ownership models • There will always be franchise (LINK) – income from fees, rebates, wholesale profits but if law allows there will also be: • pharmacies in Clicks & Discom • 100% ownership (PM&A) • JV (80%: 20% for any of the brands)
 Merchandising OD / HR Marketing Logistics IT") Centralised services model Owned Stores (100%: 0%) Merchandising OD / HR Marketing Logistics IT Fin & Admin Joint Venture Stores (80%: 20%) Store Design Store Develop Supply Chain Distribution Buying Store Services Franchise Stores (0%: 100%)
Centralised services model Owned Stores (100%: 0%) Merchandising OD / HR Marketing Logistics IT Fin & Admin Joint Venture Stores (80%: 20%) Store Design Store Develop Supply Chain Distribution Buying Store Services Franchise Stores (0%: 100%)
 New Clicks South Africa 100% now; JV in future 56% DISCOM Funding LIT CLICKS PM&A Franchise Stores 182 Stores 261 Stores 248 Stores 76 Stores R 721 Million R 2, 7 Billion R 2 Billion R 1 Billion PRESENT PHARMACY NETWORK DESIRED FUTURE PHARMACY NETWORK
 The Objective A nationwide network of +/- 800 efficient, compliant, professional and profitable pharmacies within various ownership models
 The Integrated Healthcare Model Back Shop Front Shop Pharmacy Retail consumer health Clinical Care
 Intercare • A close relationship with the doctors who prescribe • Objective is to improve pharmacy turnover • Pilot project
 Link Investment Trust • • Budgeting for break-even Funding new initiatives Link - The best known pharmacy brand Income from – franchise fees - potential for new members, – rebates – own brands
 UPD transaction reminder • R 2 billion turnover, NPAT R 43 m • Transaction to be funded through issue of 39 024 k New Clicks shares at R 7. 20 • P/E for valuation was 6. 5 x • Earnings enhancing • Awaiting approval from Competition Commission
 Healthcare Legal Issues
 Status of Law • Ownership –still awaiting regulations –under-serviced areas - Discom –need urban stores as well (PM&A) • Single Exit Pricing –schedule 3, some only –modelling difficult for total pharmacy –believe no impact on UPD • Court Case
 State of the Industry • Healthcare in SA is in crisis • Need for greater affordability & access • Potential changes to Legislation – Lay ownership/deregulation – Professional Fee – Dispensing Doctors • Fragmented Industry • Opportunities for greater efficiencies • We are the best suited to play a role
 Jeff Sher Country Leader
 Agenda • • • Introduction - a perspective The year in review Our pharmacy model The year ahead Summary
 August 2001
 Australian Management Forum Shared Services
 2001/02 Performance
 Results – Aug 2002 • Sales up 13. 9% • Operating Profit up 22. 9%
 Results – Aug 2002 • Franchise Income up 99. 2% • Operating Profit up 117. 5% • Store Growth 10 NOTE! Pre-allocation of Support Office costs
 House Key Issues • Response to competitive environment through differentiation - Private label - Direct imports • Government home loan scheme ends • Competent team now in place • NZ on hold due to supply chain complications
 Results – Aug 2002 • Sales Up 13. 2% • Operating Profit Up 10. 34% • Store Growth 9 NOTE! Pre-allocation of Support Office costs
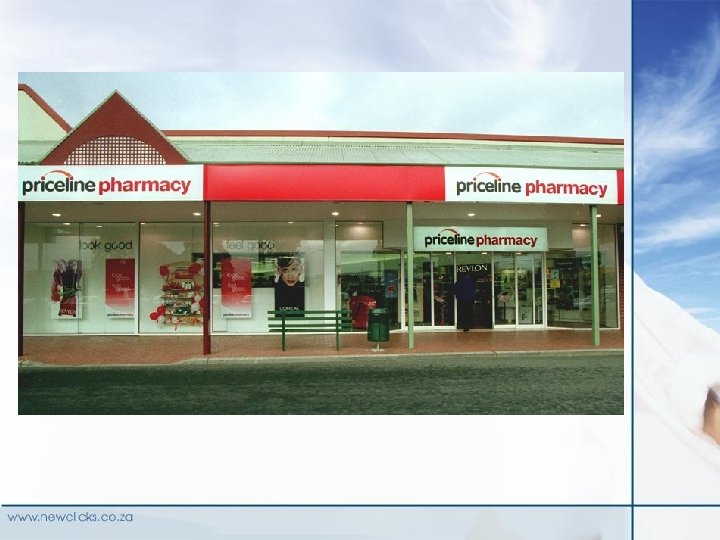
 Priceline Key Issues • Why did we only open 9 stores • Intense competition – our response – Lifestyle category repositioning – Differentiation through imports – Loyalty - a positive outcome • Leverage to be gained with Price Attack • Margin focus • Loyalty - a positive outcome • Stock levels - growth due to strategic opportunity • Operating Profit - 7. 61% to sales
 A Snapshot • 94 stores • Average turnover per store - $950 000 • Franchise fees - 5% on sales • Advertising fee - 3% of sales • Local area marketing - 1% of sales • Master franchise arrangement - WA, SA - 1% franchise fee, 3% marketing fee
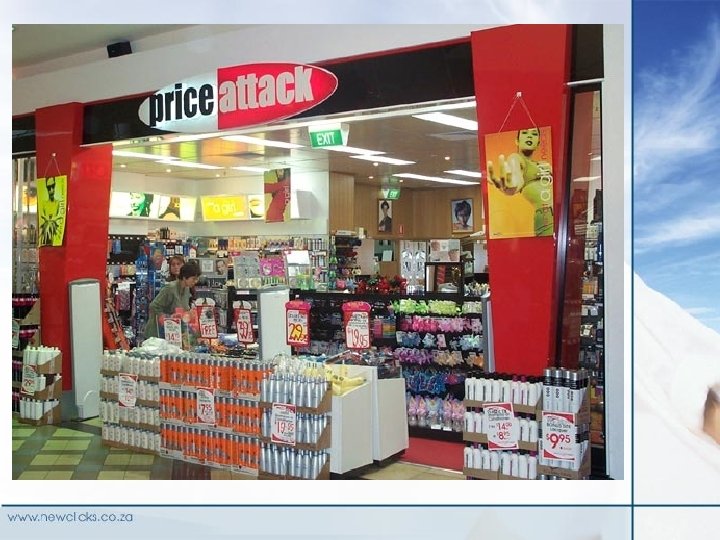
 Opportunities • Synergy with Sunday Group - access to 1800 formulations • Private label • Easily transported • Monopolistic environment • High margin
 • • • Make-up of the industry Regulatory environment Our offer How income is generated Store growth
 • Number of pharmacies in Australia: Approximately 4, 900 • Bannered pharmacies: • Approximately 1, 900 (39%)
 Retail Pharmacy Sales Mix Retail Pharmacy $6. 5 b Prescriptions $4. 1 b 72% OTC $2. 4 b S 2/S 3 $550 m Non Sched $639 m Non Pharm. $1. 2 b
 WHOLESALERS SIGMA API MAYNE Amcal 395 Soul Patt 230 Terry White 105 Chemmart 255 Guardian 264 Chemworld 131 Healthsense 110 Full Life 40 Pharm Adv. 91 Med. Shoppe 7
 Wholesaler & Pharmacist Relationship • Wholesalers guarantee loans for pharmacists to acquire pharmacies. • The pricing mechanism for pharmacists is artificially inflated, 1: 1 ratio of turnover to goodwill • Pharmacists align to a banner through loose agreement • Distribution on a twice-a-day basis • Banner groups offer marketing programmes and some operational support • Private label products are key to the relationship
 Regulatory environment • Agreement between Government & Pharmacy Guild • No corporation can have pecuniary interest • Geographic restriction • Usage clause restriction - landlord • Limit to numbers in shopping centres • Regulations applied by Pharmacy Board - layout of stores • Approval numbers • Pharmacy Act - differs in each state
 Pharmacy Paradox Prescriptions & medicines back of store Front of store Sales 70% 30% Costs 20% 80% Margins 10% 32%
 Our Offer • • • Category management - increased margin Rebalance front and back of shop - increase sales Common IT platform Marketing programme - including Club. Card Retail services (merchandising and space management) • The Pharmacy Academy • Operational focus - shopfloor productivity • Brand equity
 Benefits for Fees • • • Annual franchise fee - a flat amount Distribution fee linked to purchases on front of shop IT annual maintenance fee Marketing fee linked to marketing programme costs Supplier rebates Significantly - no capital employed
 Store Growth • Three Opportunities • Existing Pharmacies convert to Priceline model • Convert Priceline stores to Pharmacies through a franchise arrangement • Secure new locations and through a relationship with pharmacists acquire approval numbers • Objective • 14 - 20 Stores secured by August 2003 • 1000 by ? ?
 The Year Ahead
 The Year Ahead – Store Growth 14 - 20 13 12 16
 AMF A Committed Team - Going Places Jeff Sher……………… George Meiliunas…… Alan Wein……………. Amanda Brook………. Rob Ellis……………… Bradley Wein………… Andrew Grant………. . Simon Burrow………. . Trevor Harris………… Country Leader Organisational Development Brand Leader - House Brand Leader - Priceline Brand Leader - Price Attack Franchising Logistics/IT Marketing Finance
 Summary A Positive Outlook • • • Price Attack, full year of profit Controlled growth of costs Loyalty to deliver Leverage gains in merchandise Roll-out of pharmacy
 Errol Gray Country Leader
 Agenda • NCSA performance • NCSA achievements • NCSA year ahead
 NCSA Performance Sales up 17. 1% Operating Profit up 15. 3%
 Comparative without Discom Sales up 18. 2% Operating profit up 27. 2%
 Clicks Performance Sales up 15. 4% Operating Profit up 23. 7% Store Growth 21
 Clicks Existing Store Growth 12 10 % increase 8 2001/2002 Cumulative 2000/2001 Cumulative 6 4 2 0 September October November December January February March April May June July August
 Clicks Key Issues • Repositioned Clicks - Live Life Beautifully • CRM loyalty programme - Data mining - Club. Card relaunch • Aggressive store upgrade • Stock reduction • Service campaign • New healthcare statement - 20 stores
 Discom Performance Sales up 12. 1% Operating Profit Down Stores Refurbished
 Discom Existing Store Growth 14 12 % increase 10 8 6 2001/2002 Cumulative 2000/2001 Cumulative 4 2 0 -2 -4 September October November December January February March April May June July August
 Discom Key Issues • Focus on re-engineering the margin mix • Exploring new primary health statement in store • Test a hair salon in Mitchell’s Plain store • Continue to develop private label • Ongoing focus on expenses • Ethnic haircare focus - R 100 m in sales • Leadership
 Music Division Performance Sales up 24. 9% Operating Profit up 104% New Stores 7
 Music Existing Store Growth 16. 00 14. 00 12. 00 8. 00 2001/2002 Cumulative 2000/2001 Cumulative 6. 00 4. 00 2. 00 st gu Au ly Ju ne Ju ay M ril Ap ar ch M ua ry Fe br Ja nu ar y r ec e m be r D m be ov e ct ob er N -4. 00 O pt em -2. 00 be r 0. 00 Se % increase 10. 00
 Music Division Key Issues • Maintaining margins • Increased stockturns • CDW opening two new stores • Market dominance - 35% • Bucking international market trends • Leadership
 The Body Shop Performance Sales R 27. 1 m Operating Profit R 3. 4 m Store Growth 11
 The Body Shop Key Issues • Mature brand internationally • New in SA - years of growth ahead • Brand being revitalised internationally • First corporate to be awarded a Master Franchise
 NCSA Achievements • Stock management • Discom repositioning • Data mining • SAMF
 Stock Management • Next year goal R 250 m improvement • Centralising imports, single item picking, algorithms • Stock turn 5 x, 6 x, 7 x, over next years to generate cash (JIT)
 NCSA DC's Year on Year Stock R 375, 000 R 350, 000 R 325, 000 Selling Value (Rands) R 300, 000 R 275, 000 R 250, 000 R 225, 000 R 200, 000 R 175, 000 R 150, 000 R 125, 000 R 100, 000 R 75, 000 R 50, 000 R 25, 000 R 0 Sep Oct Nov Dec Jan Feb Mar Financial Months Apr May Jun Jul Aug 1998/1999 yr 1999/2000 yr 2000/2001 yr 2001/2002 yr
 NCSA Stocks 1500000 1400000 1300000 2001/2002 1200000 2000/2001 value 11000000 900000 800000 700000 600000 S O N D J F M month A M J J A
 The Year Ahead - Store Growth 24 8 7 9
 SAMF Errol Gray……………. . Andre Vermeulen……. Lara Bryant…………… Trevor Vroom………… Mike Harvey…………. . Colin Robb…………… Monica Goertz………. . Simon Kilner…………. Byron Hofmeyr………. Country Leader Finance Marketing & Merchandise Brand Leader - Clicks Brand Leader - Discom Brand Leader - Music Division Brand Leader - Healthcare Supply Chain IT
 Year Ahead • Sustainable stockturn improvement • Discom profitability • Healthcare integration and performance • Clicks revitalisation • Focused brand performance
 Our Positioning Statement We are world-class originators and distributors of a range of compelling and differentiated health, lifestyle and beauty retail products and services to multiple brand formats in a variety of ownership models.
 Thank You