

0458362551149a94c6287d334771966b.ppt
- Количество слайдов: 125
 ANALISIS PROTEIN ----------------------Disampaikan oleh Sri Naruki Fakultas Teknologi Pertanian UGM
 • Food") PROTEIN • Protein are an abundant component in all cells (Nielsen, 2004) • Food protein : very complex; MW ranging from 5000 to more than a million Daltons • Function : growth & maintenance of tissue, formation of essential body compounds, transportation of nutrients, etc. (Guthrie, 1982)
PROTEIN • Protein are an abundant component in all cells (Nielsen, 2004) • Food protein : very complex; MW ranging from 5000 to more than a million Daltons • Function : growth & maintenance of tissue, formation of essential body compounds, transportation of nutrients, etc. (Guthrie, 1982)
 • Protein consist of polypeptides, extremely long chains of many amino acid units • All protein in all species, regardless of their function or biological activity, are built from the same basic set of 20 standard amino acids, which by themselves HAVE NO intrincsic biological activity
 • General structure of amino acids : COOH H 2 N C H R R = side chain or R group • The simples amino acid : glycine R = H • In all amino acids, except glycine, the carbon atom has 4 different substituent groups and is thus asymetric or chiral carbon (Lehninger, p. 96)
 The Peptide Bond • Peptide bond : how the amino acids are linked together to make a protein H H H 2 NCCOOH + H 2 NCCOOH R R’ H O H H 2 N-C-C-N-C-COOH + H 2 O R H R’
") • Proteins are composed of H, C, N, O, and S (Nielsen, 2004) • Composition of elements in proteins : - C : 50 – 55 % - O : 20 – 25 % - N : 13. 4 – 19. 1 % - H : 5 – 7 % - S : 0. 4 – 2. 5 % - P, Fe, Cu : trace
• Proteins are composed of H, C, N, O, and S (Nielsen, 2004) • Composition of elements in proteins : - C : 50 – 55 % - O : 20 – 25 % - N : 13. 4 – 19. 1 % - H : 5 – 7 % - S : 0. 4 – 2. 5 % - P, Fe, Cu : trace
 : merupakan penyusun terbesar • Bila C digunakan sebagai dasar") • C (karbon) : merupakan penyusun terbesar • Bila C digunakan sebagai dasar analisis protein • Analisis protein berdasarkan C mempunyai beberapa keuntungan : a. Digesti lebih mudah bila dibandingkan dengan digesti pada metoda analisis berdasarkan N b. Kadar C protein = tinggi sehingga - mengurangi error - faktor konversi relatif konstan
• C (karbon) : merupakan penyusun terbesar • Bila C digunakan sebagai dasar analisis protein • Analisis protein berdasarkan C mempunyai beberapa keuntungan : a. Digesti lebih mudah bila dibandingkan dengan digesti pada metoda analisis berdasarkan N b. Kadar C protein = tinggi sehingga - mengurangi error - faktor konversi relatif konstan
 • TAPI INGAT : ada beberapa senyawa lain yang juga mengandung C karbohidrat dan lipida • Oleh karena itu, C nonprotein tersebut harus dihilangkan terlebih dahulu • Pemisahan C nonprotein tersebut sulit Oleh karena itu, yang lazim dilakukan adalah : penentuan kadar protein berdasarkan kadar nitrogen
 • Nitrogen is the most distinguishing element present in proteins • N content in various food protein ranges from 13. 4% to 19. 1% an average = 16. 0% • Therefore, protein content (%) = 100/16 x % N = 6. 25 x % N conversion factor/CF (faktor konversi/FK)
 Conversion Factors • N content in various food protein ranges from 13. 4% to 19. 1% conversion factors for various food are varied : - Egg or meat CF = 6. 25 - Dairy products 6. 38 - Wheat 5. 70 - Other cereal grains & oilseeds 6. 25 - Almonds 5. 18 - Peanuts & Brazil nuts 5. 46 - Other tree nuts & coconut 5. 30
 ANALYSIS OF PROTEIN • Analysis of protein is very complicated since some food components posses similar physicochemical properties • Nonprotein nitrogen could come from : - Free amino acids - Some vitamins - Small peptide - Alkaloids - Nucleic acids - Uric acid - Porphyrin - Urea - Ammonium ions - Etc
 Aspartame is a small peptide composed of Asp, Phe, and methanol
 Nucleic acids are polymer formed from linking of various nucleotides
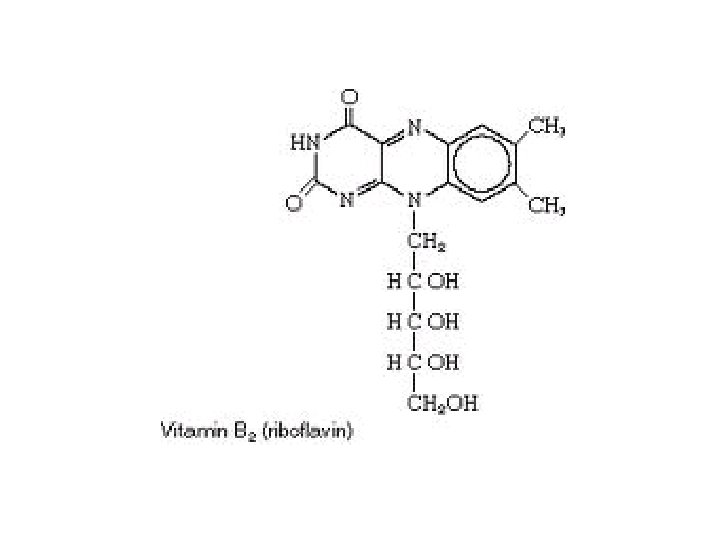
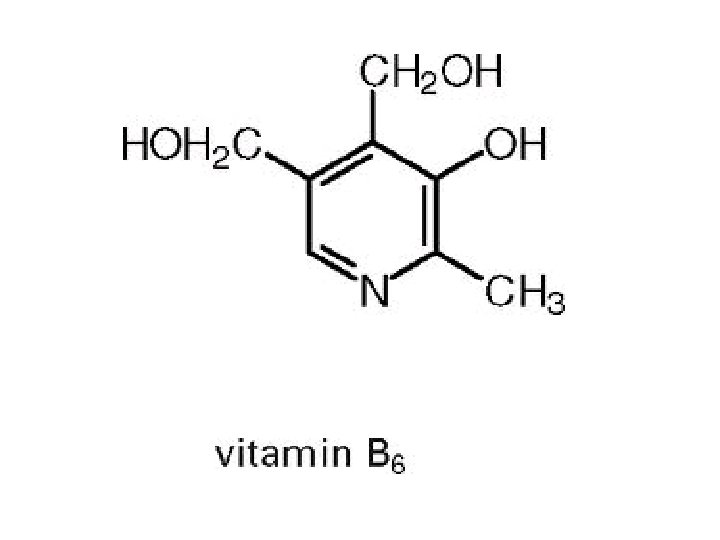
 juga mengandung N") Struktur vitamin B 1 (tiamin) juga mengandung N
Struktur vitamin B 1 (tiamin) juga mengandung N
 Caffeine alkaloid
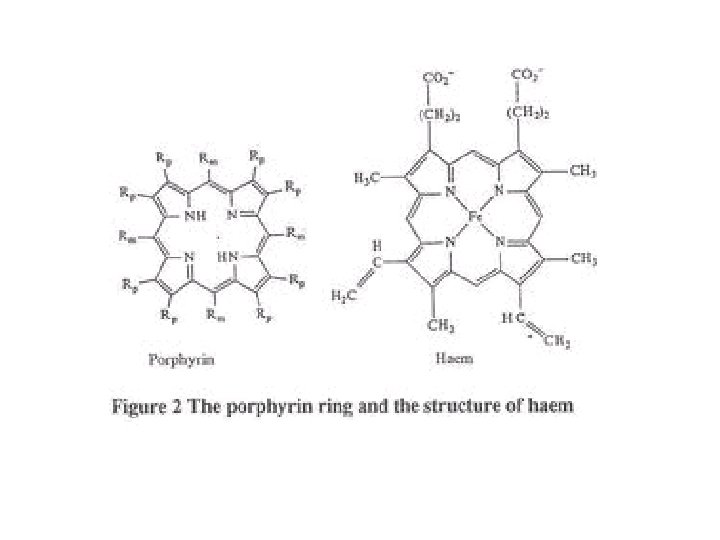
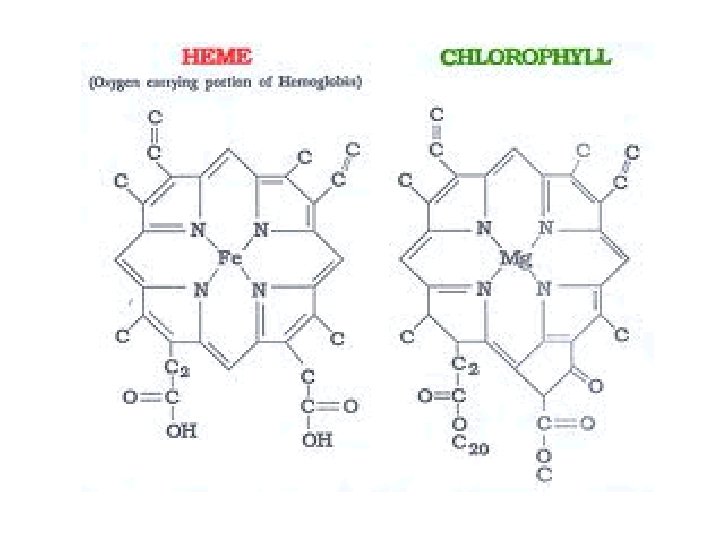
 Chemical structure of uric acid
 Chemical structure of urea
 • The total organic nitrogen in foods would represent nitrogen : - Primarily from protein - A lesser extent from all organic nitrogencontaining nonprotein substances • Therefore, % Protein = CF x % N is called : crude protein (protein kasar) • Other major food components, including carbohydrate and lipid, may interfere physically with analysis of food proteins
 Importance of Analysis 1. Nutrition labeling 2. Functional property investigation Proteins of food have unique functional properties. Example : gliadin & glutenin in wheat flour for bread making 3. Biological activity determination, including enzymes & enzyme inhibitor. Enzyme activity is expressed in terms of specific activity : unit of enzyme/mg of protein
 • Protein analysis is required if you want to know : 1. Total protein content 2. Content of particular protein in mixture 3. Protein content during isolation and purification of protein 4. Nonprotein nitrogen (ex. TMA content) 5. Amino acid composition (profil asam amino) 6. Nutritive value of protein (ex. PER, BV) 7. Activity (of enzyme)
 CEREALS &") Protein Content of Selected Foods Food item % Protein (wet weight basis) CEREALS & PASTA Rice, brown, raw Wheat flour Corn flour, yellow Spaghetti, dry, enriched Cornstarch 7. 9 13. 7 6. 9 12. 8 0. 3 DAIRY PRODUCTS Milk, whole, fluid Cheese, cheddar 3. 3 24. 9 FRUITS AND VEGETABLE Apple, raw, with skin Potato, whole, flesh and skin 0. 2 2. 0 LEGUMES Soybean, mature seeds, raw 36. 5 MEAT, POULTRY. FISH Egg, raw, whole Ham, sliced, regular 12. 5 17. 6
Protein Content of Selected Foods Food item % Protein (wet weight basis) CEREALS & PASTA Rice, brown, raw Wheat flour Corn flour, yellow Spaghetti, dry, enriched Cornstarch 7. 9 13. 7 6. 9 12. 8 0. 3 DAIRY PRODUCTS Milk, whole, fluid Cheese, cheddar 3. 3 24. 9 FRUITS AND VEGETABLE Apple, raw, with skin Potato, whole, flesh and skin 0. 2 2. 0 LEGUMES Soybean, mature seeds, raw 36. 5 MEAT, POULTRY. FISH Egg, raw, whole Ham, sliced, regular 12. 5 17. 6
 The Basic Principles of Some Methods to Measure Protein Content • Determination of nitrogen, peptide bonds, aromatic amino acids • Based on the dye-binding capacity of protein • Based on the UV absorptivity of protein • Based on the light scattering properties of protein
 The Basic Principles of Some Methods to Measure Protein Content I. Determination of nitrogen, peptide bonds, aromatic amino acids A. Kjeldahl method B. Biuret method C. Lowry method D. Titrasi formol E. Dumas method F. BCA method
 A. KJELDAHL METHOD
 • On March 7, 1883, Johann Kjeldahl presented his method of N analysis • Today, the Kjeldahl method for the determination of organic nitrogen is the worldwide standard for the purpose of calculating the protein content in both human food animal feed • The Kjeldahl method has been adapted as a standard method of N analysis in fertilizer, fossil fuel, waste water, etc.
 PRINCIPLE • Proteins & other organic food components in a sample are digested with sulfuric acid in the presence of catalysts • The total organic nitrogen is converted to ammonium sulfate • The digest is neutralized with alkali and distilled into a boric acid solution • The borate anions formed are titrated with standardized acid, which is converted to N in the sample
 • The result of analysis represents the crude protein content of the food since N also comes from nonprotein components • The Kjeldahl method for nitrogen analysis is composed of three distinct steps : 1. Digestion (destruksi) 2. Neutralization and Distillation 3. Titration
 IMPROVEMENTS 1. Katalis logam seperti Hg, Cu, dan Se ditambahkan ke asam sulfat untuk menyempurnakan oksidasi. - Yang terbaik : Hg - Selenium dioksida dan Cu-sulfat (3: 1) juga efektif untuk digesti - Copper and titanium dioxide also have been used as a mixed catalyst for digestion the use of them poses less safety concern than Hg in the post-analysis disposal of the waste
 • Bila digunakan Hg, selama digesti akan terbentuk senyawa kompleks Hg-amonia • Hg harus diendapkan (sebagai Hg. S) dengan penambahan Na-tiosulfat (Na 2 S 2 O 3) presipitan Na 2 S 2 O 3 dicampur dengan Na. OH yang digunakan untuk membebaskan NH 3 (saat tahap netralisasi sebelum distilasi) • Na-tiosulfat juga ditambahkan untuk membantu membebaskan N dari ikatannya dengan Hg (lihat butir 3)
") • Di lapangan, campuran (Na. OH + Na 2 S 2 O 3) dikenal dengan istilah Na. OH-thio • Katalis Se (selenium) : - efek lebih hebat daripada Hg - Tidak perlu step tambahan (yaitu penambahan Na-tiosulfat /Na 2 S 2 O 3) - TAPI : bila jumlah Se berlebihan maka suhu destruksi/digesti tidak terkontrol sehingga ada kemungkinan kehilangan N (karena menguap)
• Di lapangan, campuran (Na. OH + Na 2 S 2 O 3) dikenal dengan istilah Na. OH-thio • Katalis Se (selenium) : - efek lebih hebat daripada Hg - Tidak perlu step tambahan (yaitu penambahan Na-tiosulfat /Na 2 S 2 O 3) - TAPI : bila jumlah Se berlebihan maka suhu destruksi/digesti tidak terkontrol sehingga ada kemungkinan kehilangan N (karena menguap)
 2. Penambahan potasium sulfat dapat dila- kukan untuk menaikkan titik didih asam sulfat sehingga meningkatkan digesti Suhu digesti yang ideal : 370 – 410 o. C. TAPI bila K-sulfat berlebihan maka akan terjadi kehilangan N 3. Sulfide or sodium thiosulfate are added to the diluted digest to help release nitrogen from mercury, which tends to bind to ammonium
 4. The ammonia is distilled directly into a boric acid solution, followed by titration with standard acid 5. Colorimetry Nesslerization, or ion chroma- tography to measure ammonia, is used to determine nitrogen content after digestion
 Beberapa Modifikasi 1. Cara makro Kjeldahl - Berat sampel : 1 g - Katalis : K 2 SO 4 -Hg. O - Distilasi : memapak lempeng Zn dengan tujuan agar supaya * tidak terjadi superheating * tidak terjadi percikan cairan * tidak terbentuk gelembung gas yang besar
 2. Cara mikro Kjeldahl - Berat sampel : 10 – 30 mg - Katalis : Na 2 SO 4 –Hg. O 3. Cara Gunning - Berat sampel : 0, 7 – 5, 5 g - Katalis : K 2 S atau Na 2 SO 4 dan Cu. SO 4
 GENERAL PROCEDURE & REACTIONS • As stated before, the Kjeldahl method for nitrogen analysis is composed of three distinct steps. Sample preparation should be done prior to these three steps. 1. 2. 3. 4. Sample preparation Digestion (destruksi) Neutralization and Distillation Titration
 1. Sample Preparation • Solid food are ground to pass a 20 mesh screen • Samples for analysis should be homogeneous • No other special preparation are required
 2. Digestion Step • The purpose of digestion : to break the intricate structure and chemical bonds that hold a chemical substances (piece of meat, cup of flour, or quart of oil) down into simple chemicals and ionic structures • Specifically, proteins and other forms of nitrogen are broken down and converted to ammonia
 • To digest the sample, 1 – 2 g of the sample are placed on a digestion tube with 12 – 15 m. L of concentrated H 2 SO 4. Seven grams of K 2 SO 4 and a metallic catalyst, usually Cu, are the added. • The digestion tube is heated to the boiling temperature of the mixture • Digestion was done to complete oxidation and conversion of N to ammonium sulfate • The digestion is usually completed after one hour at 370 – 400 o. C
 in a Kjeldahl flask •") a. Procedure of Digestion • Place sample (accurately weighed) in a Kjeldahl flask • Add sulfuric acid and catalyst UNTUK MENGOKSIDASI 1 g Protein 1 g Lemak 1 g Karbohidrat MEMERLUKAN H 2 SO 4 + 9, 0 g + 17, 8 g + 7, 3 g • Digest until CLEAR to get complete breakdown of all organic matter • Digesti diakhiri bila larutan menjadi jernih dan tak berwarna
a. Procedure of Digestion • Place sample (accurately weighed) in a Kjeldahl flask • Add sulfuric acid and catalyst UNTUK MENGOKSIDASI 1 g Protein 1 g Lemak 1 g Karbohidrat MEMERLUKAN H 2 SO 4 + 9, 0 g + 17, 8 g + 7, 3 g • Digest until CLEAR to get complete breakdown of all organic matter • Digesti diakhiri bila larutan menjadi jernih dan tak berwarna
 b. Reactions During Digestion • Nonvolatile ammonium sulfate is formed from nitrogen and sulfuric acid : Sulfuric acid Protein (NH 4)2 SO 4 Heat, catalyst • During digestion : - protein nitrogen is liberated to form ammonium ions
 - Sulfuric acid oxidized organic matter & combines with ammonium formed - C is converted to CO 2 (volatile/menguap) - H is converted to H 2 O (volatile/menguap) • Lama digesti bervariasi, tergantung dari jenis sampel yang dianalisis - Protein kaya akan asam amino histidin (His) dan triptofan (Trp) : digesti lama ( perlu katalis lebih banyak) - Sampel kaya lemak : digesti lama ( perlu H 2 SO 4 lebih banyak)
 c. Reaksi lengkap Hg. O + H 2 SO 4 Hg. SO 4 + H 2 O Hg. SO 4 Hg 2 SO 4 + SO 2 + On (CHON) + On + H 2 SO 4 CO 2 + H 2 O + (NH 4)2 SO 4 protein
2 SO 4 dipecah") 3. Neutralization & Distillation Step • Pada tahap ini (NH 4)2 SO 4 dipecah menjadi NH 3 dengan penambahan Na. OH (sampai dica -pai kondisi alkalis) dan pemanasan (distilasi) • Selama distilasi dapat ditambahkan lempeng Zn • NH 3 yang dibebaskan ditangkap oleh larutan asam standar berlebihan. Asam dapat berupa - Asam borat 4% - HCl 0, 1 N
3. Neutralization & Distillation Step • Pada tahap ini (NH 4)2 SO 4 dipecah menjadi NH 3 dengan penambahan Na. OH (sampai dica -pai kondisi alkalis) dan pemanasan (distilasi) • Selama distilasi dapat ditambahkan lempeng Zn • NH 3 yang dibebaskan ditangkap oleh larutan asam standar berlebihan. Asam dapat berupa - Asam borat 4% - HCl 0, 1 N
 • Ujung alat distilasi harus tercelup larutan asam • Distilasi diakhiri bila destilat yang dihasilkan tidak lagi bereaksi basa. Caranya ? ? • Reaksi yang terjadi saat netralisasi dan distilasi : (NH 4)2 SO 4 + 2 Na. OH 2 NH 3 + Na 2 SO 4 + 2 H 2 O • Selanjutnya NH 3 yang dibebaskan akan bereaksi dengan larutan penampung sebagai berikut :
 • Bila penampungnya asam borat : NH 3 + H 3 BO 3 (boric acid) NH 4 + H 2 BO 3– (borate ion) • Bila penampungnya HCl : 2 NH 3 + 2 HCl (berlebihan) 2 NH 4 Cl + HCl (sisa)
 Procedure of Netralization & Distillation • The digest is diluted with water • Alkali-containing sodium thiosulfate is added to neutralize the sulfuric acid • The ammonia formed is distilled into a boric acid solution containing the indicator methylene blue and methyl red
 - Borate anion") 4. Titration a. Bila digunakan penampung asam borat (METODA TITRASI LANGSUNG) - Borate anion (proportional to the amount of nitrogen) is titrated with standardized HCl (anion borat dalam penampung dititrasi dengan HCl standar 0, 1 N ) - Reaction : H 2 BO 3– + H+ H 3 BO 3 - Calculation Moles of HCl = moles of NH 3 = moles N in the sample
4. Titration a. Bila digunakan penampung asam borat (METODA TITRASI LANGSUNG) - Borate anion (proportional to the amount of nitrogen) is titrated with standardized HCl (anion borat dalam penampung dititrasi dengan HCl standar 0, 1 N ) - Reaction : H 2 BO 3– + H+ H 3 BO 3 - Calculation Moles of HCl = moles of NH 3 = moles N in the sample
 • A reagent blank should be run to subtract reagent nitrogen from the sample nitrogen • % N = N HCl x (corrected acid volume/g of sample) x (14 g N/mol) x 100 Where : - N HCl = normality of HCl, in moles/1000 ml - Corrected acid volume = (ml std acid for sample) – (ml std acid for blank)
") • Atau : % N = (ml HCl sampel – ml HCl blanko) : berat sampel (g) x 1000 x NHCl x 14, 008 x 100% • Untuk menghitung kadar protein, maka % N dikalikan faktor konversi (CF atau FK) CF beberapa jenis bahan makanan : lihat slide sebelumnya
• Atau : % N = (ml HCl sampel – ml HCl blanko) : berat sampel (g) x 1000 x NHCl x 14, 008 x 100% • Untuk menghitung kadar protein, maka % N dikalikan faktor konversi (CF atau FK) CF beberapa jenis bahan makanan : lihat slide sebelumnya
 •") b. Bila digunakan penampung HCl (METODA KONVENSIONAL / BACK TITRATION / TITRASI BALIK) • Bila digunakan penampung HCl, maka HCl sisa dititrasi dengan Na. OH standar (0, 1 N) • Reaksi - Saat distilasi : 2 NH 3 + 2 HCl (berlebihan) 2 NH 4 Cl + HCl (sisa) - Saat titrasi : HCl (sisa) + Na. OH Na. Cl + H 2 O
b. Bila digunakan penampung HCl (METODA KONVENSIONAL / BACK TITRATION / TITRASI BALIK) • Bila digunakan penampung HCl, maka HCl sisa dititrasi dengan Na. OH standar (0, 1 N) • Reaksi - Saat distilasi : 2 NH 3 + 2 HCl (berlebihan) 2 NH 4 Cl + HCl (sisa) - Saat titrasi : HCl (sisa) + Na. OH Na. Cl + H 2 O
 macam larutan standar yaitu HCl standar") Perhitungan • Pada metoda konvensional, perlu dua (2) macam larutan standar yaitu HCl standar dan Na. OH standar • meq NH 3 hasil distilasi = (meq asam mula – meq asam setelah distilasi) • meq NH 3 = (ml asam x N asam) – (ml Na. OH x N Na. OH) • Berat N (g) = meq N x 0, 014007 • Kadar N (%) = (ml HCl x N HCl) – (ml Na. OH x N Na. OH) x 1, 4 g sampel
Perhitungan • Pada metoda konvensional, perlu dua (2) macam larutan standar yaitu HCl standar dan Na. OH standar • meq NH 3 hasil distilasi = (meq asam mula – meq asam setelah distilasi) • meq NH 3 = (ml asam x N asam) – (ml Na. OH x N Na. OH) • Berat N (g) = meq N x 0, 014007 • Kadar N (%) = (ml HCl x N HCl) – (ml Na. OH x N Na. OH) x 1, 4 g sampel
 • Atau : %N = (ml Na. OH blanko – ml Na. OH sampel) : berat sampel (g) x 1000 x NNa. OH x 14, 008 x 100% • A factor is used to convert % N to % crude protein • Most proteins contain 16% N, so the conversion factor (CF) is 6. 25 % Protein = % N x 6. 25
") PROSEDUR LENGKAP METODA KJELDAHL 0, 7 – 2. 2 g sampel (dalam labu Kjeldahl) 0, 7 g Hg. O (atau 0, 65 g logam Hg) 15 g K 2 SO 4 (atau Na 2 SO 4 anhidrat) 25 ml H 2 SO 4 pekat DESTRUKSI/DIGESTI (didihkan) pelan-pelan, tambahkan sedikit parafin Setelah jernih, didihkan lagi + 30 menit PENDINGINAN (next slide)
PROSEDUR LENGKAP METODA KJELDAHL 0, 7 – 2. 2 g sampel (dalam labu Kjeldahl) 0, 7 g Hg. O (atau 0, 65 g logam Hg) 15 g K 2 SO 4 (atau Na 2 SO 4 anhidrat) 25 ml H 2 SO 4 pekat DESTRUKSI/DIGESTI (didihkan) pelan-pelan, tambahkan sedikit parafin Setelah jernih, didihkan lagi + 30 menit PENDINGINAN (next slide)
 PENDINGINAN + 200 ml aquades dingin Butiran Zn 25 ml larutan Na 2 S 2 O 3 8% + 15 g Na. OH PEMASANGAN RANGKAIAN DISTILASI PEMASANGAN ERLENMEYER PENAMPUNG (15 ml HCl 0, 02 N + 6 tetes MR-BCG) DISTILASI (Diakhiri bila distilat mencapai > 150 ml) (Cuci ujung kondenser) TITRASI HCl sisa dalam Erlenmeyer dengan Na. OH LAKUKAN PENENTUAN BLANKO !!
 2 g") PROSEDUR LENGKAP METODA MIKRO KJELDAHL + 30 mg Sampel (dalam labu Kjeldahl) 2 g K 2 SO 4; 40 mg Hg. O 2 ml H 2 SO 4 pekat Batu didih DESTRUKSI/DIGESTI Bila larutan sudah jernih, tambahkan aquades dan didihkan lagi + 1, 5 jam PENDINGINAN & PEMINDAHAN KE LABU DISTILASI
PROSEDUR LENGKAP METODA MIKRO KJELDAHL + 30 mg Sampel (dalam labu Kjeldahl) 2 g K 2 SO 4; 40 mg Hg. O 2 ml H 2 SO 4 pekat Batu didih DESTRUKSI/DIGESTI Bila larutan sudah jernih, tambahkan aquades dan didihkan lagi + 1, 5 jam PENDINGINAN & PEMINDAHAN KE LABU DISTILASI
 PENDINGINAN 8 – 10 ml Na. OH-Na 2 S 2 O 3 DISTILASI - Tampung distilat dalam Erlenmeyer berisi : 5 ml H 3 BO 3 4% + 4 tetes indikator (0, 2% MR + 0, 2% BCG) - Distilasi diakhiri saat distilat sudah tidak lagi alkalis TITRASI - Distilat dititrasi dengan HCl 0, 02 N LAKUKAN PENENTUAN BLANKO !!
 ALTERNATE PROCEDURES • In place of distillation & titration with acid, ammonia or nitrogen can be quantitated by : 1. NESSLERIZATION : 4 NH 4 OH + 2 Hg. I 2 + 4 KI + 3 KOH mercuric iodide NH 2 Hg 2 IO + 7 KI + 2 H 2 O ammonium dimercuric iodide
 can be determined spectrophotometrically at 440") • NH 2 Hg 2 IO (red-orange) can be determined spectrophotometrically at 440 nm • This method is rapid & sensitive, but the ammonium dimercuric iodide is colloidal and color is not stable OH– 2. NH 3 + phenol + hypochlorite indophenol (blue, 630 nm) 3. p. H measurement after distillation into known volume of boric acid 4. Direct measurement of ammonia, using ion chromatographic method
• NH 2 Hg 2 IO (red-orange) can be determined spectrophotometrically at 440 nm • This method is rapid & sensitive, but the ammonium dimercuric iodide is colloidal and color is not stable OH– 2. NH 3 + phenol + hypochlorite indophenol (blue, 630 nm) 3. p. H measurement after distillation into known volume of boric acid 4. Direct measurement of ammonia, using ion chromatographic method
") ADVANTAGES 1. Applicable to all types of foods 2. Inexpensive(if not usingan automated system) 3. Accurate; an official method for crude protein content) 4. Has been modified (micro Kjeldahl method) to measure microgram quantities of protein)
ADVANTAGES 1. Applicable to all types of foods 2. Inexpensive(if not usingan automated system) 3. Accurate; an official method for crude protein content) 4. Has been modified (micro Kjeldahl method) to measure microgram quantities of protein)
 DISADVANTAGES 1. Measures total organic nitrogen, not just protein nitrogen 2. Time consuming (at least 2 hr to complete) 3. Poorer precision than the Biuret method 4. Corrosive reagent
 CONTOH SOAL • Pada analisa kadar protein dengan metoda Kjeldahl, diperoleh hasil kadar protein susu bubuk skim adalah 40%. Penampung distilat yang digunakan adalah HCl berlebihan. Bila berat sampel = 0, 25 g dan titrasi blanko membutuhkan Na. OH 0, 1 N sebanyak 45 ml, hitunglah volume Na. OH untuk titrasi sampel. Faktor konversi N ke protein skim = 6, 38.
 B. BIURET METHOD
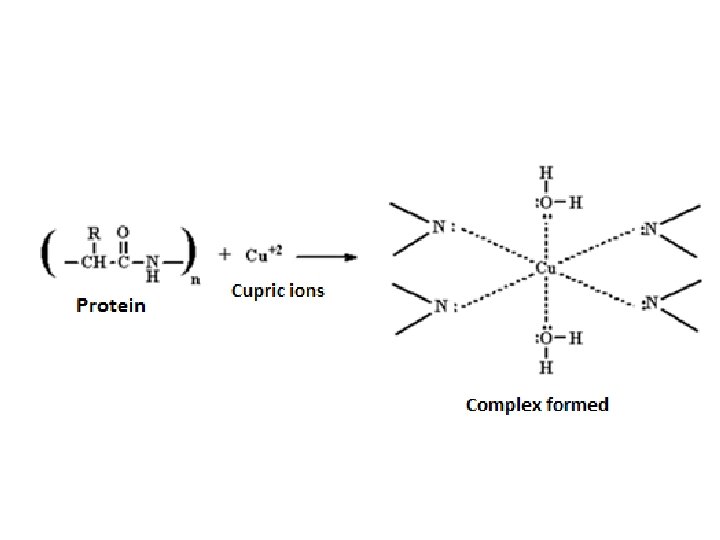
 1. PRINCIPLE • A violet-purple color is produced when cupric ions are complexes with > 2 peptide bonds, under alkaline conditions) • The absorbance of the color produced is read at 540 nm • The color intensity (absorbance) is proportional to the protein content of the sample
 2. REACTIONS H O H HOO–C–N–C –C –NH 2 + Cu. SO 4 + Na. OH R H R R H H R 2 HN–C–C–N–C–COOH HO H Cu + Na 2 SO 4 + H 2 O H O HOO–C–N–C–C–NH 2 R H H R (senyawa kompleks ungu)
 • Hasil yang diperoleh dapat dipengaruhi oleh adanya lipida dan komponen lain yang dapat mengubah warna ataupun memberikan respons yang sama dengan ikatan peptida. • Contoh gugus yang memberi respons yang sama dengan ikatan peptida : –CSNH 2 –C(NH)NH 2 –CH 2 NH 2 –CRHNH 2 –CHNH 2 CH 2 OH –CHNH 2 CHOH –CHOHCH 2 NH 2
 3. PROCEDURE 1. A 5 -ml biuret reagent is mixed with a 1 ml portion of protein solution (1 to 10 mg protein/ml). The reagent include copper sulfate, Na. OH, and K-Na-tartrate, which is used to stabilize the cupric ion in the alkaline solution 2. After the reaction mix is allowed to stand at room temperature for 15 or 30 min, the absorbance is read at 540 nm against a reagent blank
 • Filtration or centrifugation before reading absorbance is required if the reaction mixture is not clear • A standard curve of concentration versus absorbance is constructed using bovine serum albumin (BSA) BSA : 0, 20, 40, 60, 80, 100, 120 g/m. L
 4. ADVANTAGES • Lebih murah daripada metoda Kjeldahl, cepat (dapat selesai dalam < 30 menit), paling sederhana • Deviasi warna jarang terjadi dibanding dengan metoda Lowry, absorpsi UV, atau turbidimetri • Senyawa yang dapat mengganggu analisis hanya sedikit sekali • Tidak mendeteksi nitrogen dari sumbernonprotein
 5. DISADVANTAGES 1. Kurang sensitif bila dibandingkan dengan metoda Lowry; perlu minimal 2 – 4 mg protein untuk analisa 2. Absorbansi dapat berasal dari pigmen empedu, bila pigemen tersebut ada di dalam sampel 3. Garam amonium dengan konsentrasi tinggi dapat mengganggu reaksi
 4. Warna yang dihasilkan bervariasi dengan perbedaan jenis protein. Misal : gelatin menghasilkan warna pinkish-purple 5. Kondisi “tak tembus cahaya” dapat terjadi pada larutan final apabila terdapat lipida atau karbohidrat dalam jumlah banyak 6. Bukan merupakan metoda yang absolut : warna harus distandardisasi dengan protein yang diketahui (misal BSA) atau dicocokkan dengan metoda Kjeldahl
 A at 540 nm Hubungan antara absorbansi pada 540 nm pada Biuret method dengan kadar protein menurut metoda Kjeldahl % Protein (Kjeldalh)
 C. LOWRY METHOD
 with") 1. PRINCIPLE • The Lowry method combines the biuret reaction (see point B) with the reduction of the Folin-Ciocalteau phenol reagent (phosphomolybdic-phosphotungstic acid) by tyrosin & tryptophan residues in the protein • The bluish color developed is read at 750 nm (high sensitivity for low protein concentration) or 500 nm (low sensitivity for high protein concentration)
1. PRINCIPLE • The Lowry method combines the biuret reaction (see point B) with the reduction of the Folin-Ciocalteau phenol reagent (phosphomolybdic-phosphotungstic acid) by tyrosin & tryptophan residues in the protein • The bluish color developed is read at 750 nm (high sensitivity for low protein concentration) or 500 nm (low sensitivity for high protein concentration)
 Protein reaction with cupric ion under alkaline condition
 2 a. PROSEDUR • Terdapat 2 macam reagen Lowry, yaitu - Lowry A (mengandung fosfotungstat-fosfo molibdat 1 : 1) - Lowry B (mengandung Na-karbonat 2% dalam Na. OH 0, 1 N serta Cu-sulfat dan Na. K-tartrat 2%)
 • Cara : - 1 m. L larutan protein sampel + 5 m. L reagen Lowry B, gojog dan biarkan 10 menit - Kemudian tambahkan 0, 5 m. L reagen Lowry A dan biarkan 20 menit - Baca nilai absorbansi pada 600 nm
 2 b. PROCEDURE 1. Proteins to be analyzed are diluted to an appropriate range (20 – 100 g) 2. K Na Tartrate-Na 2 CO 3 solution is added after cooling and incubated at room temperature for 10 min 3. Cu. SO 4 -K Na Tartrate-Na. OH solution is added after cooling and incubated at room temperature for 10 min
 4. Freshly prepared Folin reagent is added, then the reaction mixture is mixedand incubated at 50 o. C for 10 min 5. Absorbance is read at 650 nm 6. A standard curve of bovine serum albumin (BSA) is carefully constructed for estimating protein concentration of the unknown
 • Cu++ in alkaline solution to form complexity with protein. A at 750 nm • Cu++ catalyses oxidation of phenol group of tyrosine with phosphomolybdic-phosphotungstic acid. g of protein (Kjeldahl)
 3. ADVANTAGES 1. Very sensitive : a. 50 – 100 times more sensitive than biuret method b. 10 – 20 times more sensitive than 280 nm UV absorption method c. Similar sensitivity as Nesslerization; however, more convenient than Nesslerization 2. Less affected by turbidity of the sample 3. More specific than most other methods 4. Relatively simple, can be done in 1 – 1. 5 hr
 4. DISADVANTAGES 1. Color varies with different proteins to a greater extent than biuret method 2. Color is not strictly proportional to protein concentration 3. The reaction is interfered with to varying degrees by sucrose, lipids, phosphate buffers, monosaccharides, and hexoamines 4. High concentration of reducing sugars, ammonium sulfate, and sulfhydryl compounds interfere with the reaction
 D. TITRASI FORMOL
, kemudian ditambah formalin sehingga") 1. PRINSIP • Larutan protein dinetralkan dengan basa (Na. OH), kemudian ditambah formalin sehingga terbentuk dimetilol • Dengan terbentuknya dimetilol maka gugus amino protein sudah terikat dan tidak mempengaruhi reaksi antara asam (gugus karboksil) dengan basa Na. OH sehingga akhir titrasi dapat diakhiri dengan tepat
1. PRINSIP • Larutan protein dinetralkan dengan basa (Na. OH), kemudian ditambah formalin sehingga terbentuk dimetilol • Dengan terbentuknya dimetilol maka gugus amino protein sudah terikat dan tidak mempengaruhi reaksi antara asam (gugus karboksil) dengan basa Na. OH sehingga akhir titrasi dapat diakhiri dengan tepat
 • Indikator yang dipakai adalah PP • Akhir titrasi ditandai saat terjadinya perubahan warna menjadi merah muda yang tidak hilang dalam 30 detik • Titrasi formol baik untuk digunakan untuk evaluasi proses terjadinya pemecahan protein (misal : pada fermentasi protein pada tempe, kecap, tauco, dzsb. ) • Proses hidrolisis protein ditandai dengan meningkatnya titrasi formol
 2. REAKSI PADA TITRASI FORMOL O H O R–CH–C–OH + Na. OH R–C–C–O– NH 2 NH 3+ pada p. H netral H O H R–C–C–O– + CH 2 O R–C–COOH NH 3+ (formalin) HOH 2 C–N–CH 2 OH (dimetilol) H R–C–COOH H O HOH 2 C–N–CH 2 OH + Na. OH R–C–C–ONa (dimetilol) HOH 2 C–N–CH 2 OH
 3. PROSEDUR • 10 ml larutan protein sampel + 20 ml aquades + 0, 4 ml larutan K-oksalat jenuh (Koksalat : air = 1 : 3) dan 1 ml indikator PP 1%. Diamkan selama 2 menit • Titrasi larutan tersebut dengan 0, 1 N Na. OH sampai terbentuk warna pink atau warna standar (10 ml susu + 10 ml aquades + 0, 4 ml K-oksalat jenuh + 1 tetes indikator rosanilin-khlorida 0, 01%)
 • Setelah warna tercapai, tambahkan 2 ml formaldehid 40% dan titrasilah kembali dengan larutan Na. OH sampai warna seperti warna standar tercapai lagi. Catatlah nilai titrasi kedua ini. • Dibuat titrasi blanko yang terdiri dari : 20 ml aquades + 0, 4 ml larutan K-oksalat jenuh + 1 ml indikator PP + 2 ml formaldehid, dan titrasilah dengan larutan Na. OH • Titrasi formol = titrasi terkoreksi = titrasi kedua – titrasi blanko
 • Bila nilai titrasi formol akan digunakan untuk menentukan kadar protein, maka harus dibuat percobaan serupa dengan menggunakan larutan yang telah diketahui kadar proteinnya (misalnya dengan metoda Kjeldahl) • Selanjutnya ditentukan hubungan antara titrasi formol dengan % protein. • Misal : - % protein susu = 1, 83 x ml titrasi formol - % kasein = 1, 63 x ml titrasi formol
 METHOD") E. DUMAS (NITROGEN COMBUSTION) METHOD
E. DUMAS (NITROGEN COMBUSTION) METHOD
 1. PRINCIPLE • Sample are combusted at high temperature (700 – 1. 000 o. C) • The nitrogen released is quantitated by gas chromatography using thermal conductivity detector (TCD) • The nitrogen determined is converted to protein content in the sample
 are weighed into") 2. PROCEDURE & APLICATION PROCEDURE • Sample (100 – 500 mg) are weighed into a tin capsule and introduced to a combuston reactor in automated equipment • The nitrogen released is measured by a built-in gas chromatograph APLICATION • It is an alternative to the Kjeldahl method • It is suitable for all type of foods
2. PROCEDURE & APLICATION PROCEDURE • Sample (100 – 500 mg) are weighed into a tin capsule and introduced to a combuston reactor in automated equipment • The nitrogen released is measured by a built-in gas chromatograph APLICATION • It is an alternative to the Kjeldahl method • It is suitable for all type of foods
 3. ADVANTAGES & DISADVANTAGES • Requires no hazardous chemicals • Can be accomplished in 3 minutes • Recent automated instrument can analyze up to 150 samples without attention DISADVANTAGES • Expensive equipment is required • Measures total organic nitrogen, not just protein nitrogen
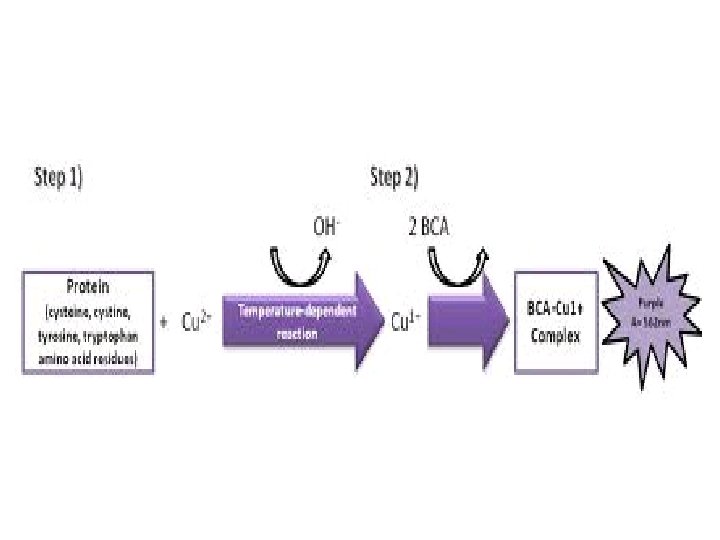
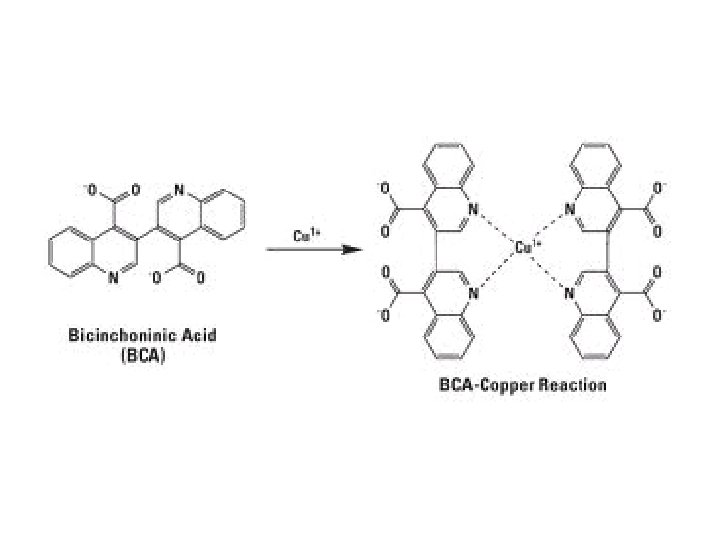
 METHOD") F. BICINCHONINIC ACID (BCA) METHOD
F. BICINCHONINIC ACID (BCA) METHOD
 menjadi ion kupro dalam") 1. PRINSIP • Protein mampu mereduksi ion kupri (Cu 2+) menjadi ion kupro dalam suasana alkalis • Dengan reagen BCA (berwarna applegreenish), ion kupro tersebut membentuk kompleks berwarna purplish, yang intensitasnya dapat ditera pada 562 nm • Intensitas warna purplish tersebut proporsional dengan kadar protein
1. PRINSIP • Protein mampu mereduksi ion kupri (Cu 2+) menjadi ion kupro dalam suasana alkalis • Dengan reagen BCA (berwarna applegreenish), ion kupro tersebut membentuk kompleks berwarna purplish, yang intensitasnya dapat ditera pada 562 nm • Intensitas warna purplish tersebut proporsional dengan kadar protein
 the protein solution with the BCA reagent, which") 2. PROSEDUR • Mix (one step) the protein solution with the BCA reagent, which contain BCA sodium salt, Na-carbonate, Na. OH, and Cusulfate p. H 11. 25 • Incubate at room temperature for 2 hr, or 60 o. C for 30 min. A higher temperature gives a greater color respon • Read the solution at 562 nm against a reagent blank • Construct a standard curve using BSA
2. PROSEDUR • Mix (one step) the protein solution with the BCA reagent, which contain BCA sodium salt, Na-carbonate, Na. OH, and Cusulfate p. H 11. 25 • Incubate at room temperature for 2 hr, or 60 o. C for 30 min. A higher temperature gives a greater color respon • Read the solution at 562 nm against a reagent blank • Construct a standard curve using BSA
 3. APPLICATION • BCA method had been used in protein isolation and purification • The suitability of BCA method for measuring protein in complex food has not been reported
") 4. ADVANTAGES 1. Sensitivity of the micro BCA method (0. 5 – 10 g) is better than Lowry method 2. One-step mixing is easier than in the Lowry method 3. The reagent is more stable than for the Lowry method 4. Nonionic detergent and buffer salts do not interfere with the reaction
4. ADVANTAGES 1. Sensitivity of the micro BCA method (0. 5 – 10 g) is better than Lowry method 2. One-step mixing is easier than in the Lowry method 3. The reagent is more stable than for the Lowry method 4. Nonionic detergent and buffer salts do not interfere with the reaction
 5. DISADVANTAGES 1. Color is not stable with time. The analyst needs to carefully control the time for reading absorbance 2. Any compound capable of reducing Cu 2+ to Cu+ will lead to color formation 3. Reducing sugar interfere to a greater extent than in Lowry method 4. Color variation among proteins are similar to those in the Lowry method
 The Basic Principles of Some Methods to Measure Protein Content II. Based on the UV absorptivity of protein
 280 nm METHOD") ULTRAVIOLET (UV) 280 nm METHOD
ULTRAVIOLET (UV) 280 nm METHOD
 1. PRINCIPLE • Protein show strong absorption at 280 nm, primarily due to tyrosine (Tyr) and tryptophan (Trp) residues in the protein • Because the content of Tyr & Trp in protein from each food source is fairly constant, the A 280 could be used to estimate the concentration of protein
 2. PROCEDURE • Protein are solubilized in buffer or alkali • Absorbance of protein solution is read at 280 nm against a reagent blank • Protein concentration is calculated according Beer’s law : A = abc • A = absorbance, a = konstanta (molar absorp- tivity for individual protein), b = cuvette path length, c = concentration • Bisa juga memakai standar BSA
 3. APPLICATION • It has been used to determine the protein content of milk and meat products • It has not been used widely in food system • It is better applied in a purified protein system • It is also better applied in proteins that have been extracted in alkali or denaturing agents such as 8 M urea
 4. ADVANTAGES 1. Rapid and relatively sensitive (at 280 nm, + 100 g protein is required, several times more sensitive than the Biuret method) 2. Nondestructive : sample can be used for other analysis after protein determination 3. No interference from ammonium sulfate and other buffer salts
 4. DISADVANTAGES 1. Nucleic acid also absorb at 280 nm. 2. The solution must be clear and colorless. Turbidity due to particulates in the solution will increase absorbance falsely 3. A relatively pure system is required to use this method
 The Basic Principles of Some Methods to Measure Protein Content III. Based on the dye-binding capacity of protein A. Dye : acid orange-12 B. Dye : coamassive brillian blue G-250
 A. DYE BINDING METHOD with acid orange-12 as a dye
 charged. These will") Principle: at low p. H, basic groups of protein are (+) charged. These will quantitatively bind a (-) charged dye. What are these basic groups?
Principle: at low p. H, basic groups of protein are (+) charged. These will quantitatively bind a (-) charged dye. What are these basic groups?
 Acid Orange 12: Procedure: 1. Mix protein, dye, buffer p. H = 2. protein + dye : membentuk komplex tidak larut 2. Filter or centrifuge. 3. Measure optical density (OD) or absorbancy of filtrate (filtrat mengandung dye sisa yang tak bereaksi dengan protein)
 Absorbance of dye bound by protein = Absorbance of initial dye – Absorbance of filtrate A. at 470 nm Kadar protein maka intensitas warna filtrat Skim milk 6 8 10 12 % Protein (Kjeldahl) 14 16
 Factors Influencing Dye Binding determination: 1. Temperature 2. Non-proteins. 3. Buffers systems 4. Protein quality
 B. DYE BINDING METHOD with coamassie brillian blue G-250 as a dye
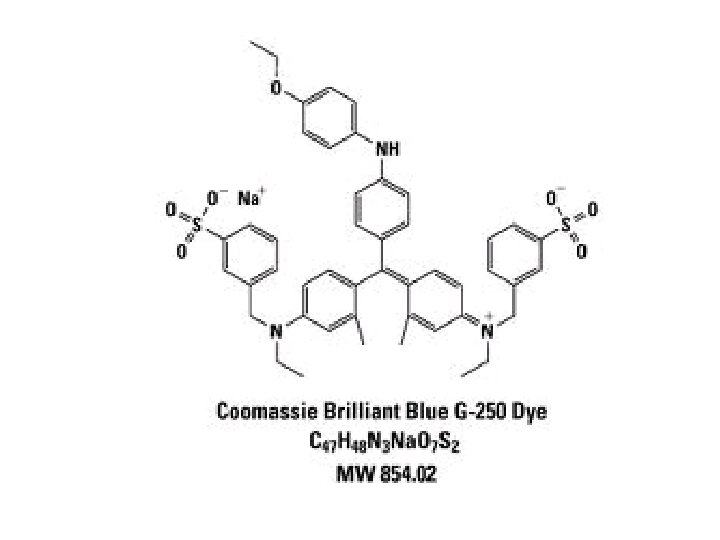
 • PRINSIP : dye + protein kompleks larut • Yang ditera : absorbansi senyawa kompleks yang larut tersebut • Oleh karena itu : bila kadar protein maka absorbansi juga • Dengan tabel konversi yang menunjukkan hubungan antara cat yang terikat protein dengan kadar protein sampel dapat diketahui • Dapat pula dibuat garis regresi yang menunjukkan hubungan antara cat yang terikat protein dengan kadar protein
 COMPARISON OF METHODS 1. SAMPLE PREPARATION • Kjeldahl & Dumas methods require little preparation sample particle size of 20 mesh is satisfactory • Other methods require fine particles for extraction of protein from the complex food systems
 2. PRINCIPLE • Kjeldahl & Dumas methods measure directly the total amount of organic N in the foods • Other method measure the various properties of protein. For examples : - The Biuret method measures peptide bonds - The Lowry methos measures a combination of peptide bonds and the amino acids Tyr & Trp
 3. SENSITIVITY • Kjeldahl, Dumas, and Biuret method are less sensitive than Lowry, BCA, or UV method 4. SPEED • Speed of determination in spectrophotometric method and the Dumas method are faster than with the Kjeldahl method
 AKHIR DARI KULIAH DENGAN POKOK BAHASAN PROTEIN TERIMA KASIH