

1d6c643192fe9fd6a604acc272010d14.ppt
- Количество слайдов: 29
 An Overview of Energy Management Initiatives in Sri Lanka M M R Pathmasiri Sri Lanka Sustainable Energy Authority
 Small (Industry &") Share of Electricity Consumption Sector Large & medium (Industry & Commercial) Small (Industry & Commercial) Religious Domestic Street Light Annual Consumption (2011) GWh 4677 1167 95 3980 105 10024
Share of Electricity Consumption Sector Large & medium (Industry & Commercial) Small (Industry & Commercial) Religious Domestic Street Light Annual Consumption (2011) GWh 4677 1167 95 3980 105 10024
 Institutions – 1400 (20%)") Cumulative Consumption of Large & Medium (Industrial & Commercial Sectors) Institutions – 1400 (20%) Consumption – 3737 GWh (80%) Institutions – 5523 (80%) Consumption – 927 GWh (80%) Projected saving is 375 GWh / annum considering 10% of energy consumption reduction (Equivalent to 3% of the overall national electricity consumption)
Cumulative Consumption of Large & Medium (Industrial & Commercial Sectors) Institutions – 1400 (20%) Consumption – 3737 GWh (80%) Institutions – 5523 (80%) Consumption – 927 GWh (80%) Projected saving is 375 GWh / annum considering 10% of energy consumption reduction (Equivalent to 3% of the overall national electricity consumption)
 Share of Electricity Consumption
 Energy Balance in a typical Office Building
 Energy Balance in a Hospital
 Energy Balance in a Textile Plant
 Energy Balance in a Garment Factory
 Energy Balance in a Tea Factory
 Energy Balance of a House
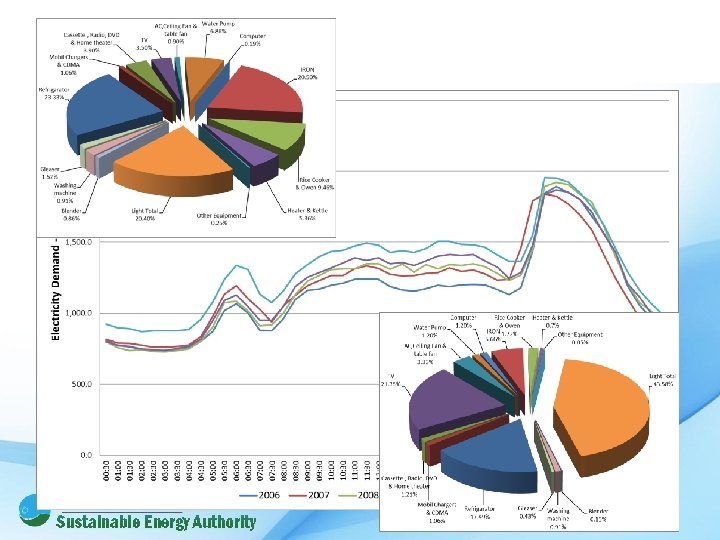
 Daily Electricity Demand - 2012
 SUSTAINABLE USE OF ENERGY Collaborative effort of Renewable Energy & Energy Efficiency
 SUSTAINABLE USE OF ENERGY Possibilities are there to reduce electricity consumption by 60% in conventional buildings
 Energy Savings Potential and Technologies Technology / Process Energy Labeling Program Ceiling Fans Tubular Fluorescent Lamps Ballasts Refrigerators Efficient lighting Air Conditioning ISO 50001 (1600 Institutions) Efficient motors and controls Building Management System (BMS) Efficient office equipments Solar water heaters Telecomunication Efficient air compressors Eliminating Incandescent Lamps Annual Saving Potential - GWh 35 65 80 16 173 250 375 185 20 16 5 11 11 205 (225 MW) 550 Green Buildings Total 1991
 IMPACT OF NATIONAL ENERGY MANAGEMENT PROGRAMMES ü Estimated budgetary requirement for 5 years is around LKR 1. 2 billion. ü Anticipated financial saving: - LKR 13 billion in the 1 st yr, will exceed LKR 34 billion at the 5 th yr, - Over a period of 5 years: Around LKR 135 billion. Source - National Energy Management Plan (En. MAP) 2012 -2016 16
 Energy Savings Achieved Projects Implemented Under National Energy Efficiency Award Scheme Savings Year No. of Applicants Electricity Saw dust / Diesel (l) Furnace oil LPG (kg) Kerosene (l) (GWh) Biomass(kg) (l) 2010 42 2 67697 66019 174701 2011 32 29 747846 404036 725, 713, 667332585 2012 29 37 8664246 614673 2013 21 28 1358400 104822 1920 6762176 41770 428306
 Good Practices Switching from fossil fuel to biomass Implementation of ISO 50001 Changing from Conventional to Green building 200 accredited energy managers are involving in implementation of EE activities in industrial sector Introduction of high efficient chillers Introduction of high efficient motors and VSDs. Introduction of sky lights Switching from T 8 to T 5 and high efficient LEDs Penetration of CFLs in domestic sector is more than 76%
 Energy Labelling Programme Code of Practice for Energy Efficient Buildings k. Wh Energy Manager / Energy Auditor Regulation ISO 50001 Certification Recognition at national level for the involvement in energy conservation activities in both state sector and private sector organizations
 Energy Management Program for Industrial and Commercial Sector Large Consumers – More than 600, 000 k. Wh per Annum Develop action plan and implement EE activities Reviewing the status of each industry Reporting of energy consumption data Establish base line Implement ISO 50001 Monitoring & Evaluation
 Energy Management Program for Industrial and Commercial Sector Small & Medium Institutions – Less than 600, 000 k. Wh per annum Improvement of Energy Efficiency activities in collaboration with National Productivity Movement Implementation of ISO 50001 (Mainly housekeeping practices)
 Energy Management Program for Domestic Sector Promoting use of efficient products – Energy labeling program Associate awareness programs Pricing
 Biomass Consumption
 Coconut Processing 1. 0 Rubber") 1990 Biomass Utilization Consumption by sectors Sector Consumption (%) Coconut Processing 1. 0 Rubber Processing 1. 2 Tea Processing 3. 7 Major Industries in western Province 4. 9 Brick 9. 1 Tile 3. 1 Lime 4. 0 Households Cooking 68. 7 Commercial Bakeries, Hotels 2. 4 Other Industries 1. 9 Agro Industry 2011 Manufacturing Industry Total consumption – 13, 156, 000 MT
1990 Biomass Utilization Consumption by sectors Sector Consumption (%) Coconut Processing 1. 0 Rubber Processing 1. 2 Tea Processing 3. 7 Major Industries in western Province 4. 9 Brick 9. 1 Tile 3. 1 Lime 4. 0 Households Cooking 68. 7 Commercial Bakeries, Hotels 2. 4 Other Industries 1. 9 Agro Industry 2011 Manufacturing Industry Total consumption – 13, 156, 000 MT
 Biomass Utilization for Thermal Applications in Industries in Western Province Total consumption – 2875 MT/Day
 Co-generation Applications Flue Gas loss 10 – 12% Mechanical Loss 2 -5% Elect 15 – 30 % G Steam Turbine Process Heat 60 - 75 % Fuel 100% Plant Type η Open Cycle 30 - 35 - Cogen Cycle 20 - 30 80 - 85 0. 4 – 0. 5 Combi Cycle 40 - 45 elect % η α Thermal % 1. 0 – 1. 3
 Co-generation Applications 1100 0 C Combustion chamber Supper heated steam 184 0 C 100 0 C 30 0 C Saturated steam Condensate Electricity Heat
 Cogeneration Applications Textile Plant Electricity + Heat for drying Tea Factory Electricity + Heat (Hot air) for drying & withering Tire Factory Electricity + Heat (steam) for curing Rubber Gloves Manufacturing Electricity + Heat (steam or thermic fluid) for curing Hotel, Hospitals Electricity + Hot water or Heat for generation of chilled water through absorption chiller Commercial Buildings Electricity + Heat for generation of chilled water through absorption chiller
 ou Y nk ha T