ba8076f449268323bfd0811b9d69bd9d.ppt
- Количество слайдов: 17


An Introduction to AWB Presentation to Ridley Agribusiness Investor Forum Andrew Lindberg 15 November 2000

Covering today…. • • Australian Wheat Industry Structure & Business Financial Results Challenges Growth and Diversified Profit Streams Key Industry Considerations Solid Foundation for Future Success Board & Management

Australian Wheat Industry • • 40, 000 wheat growing properties Geographically fragmented 21 million tonnes of wheat production 20 per cent of wheat grown is consumed domestically – about 4. 5 m tonnes • Balance of wheat is exported
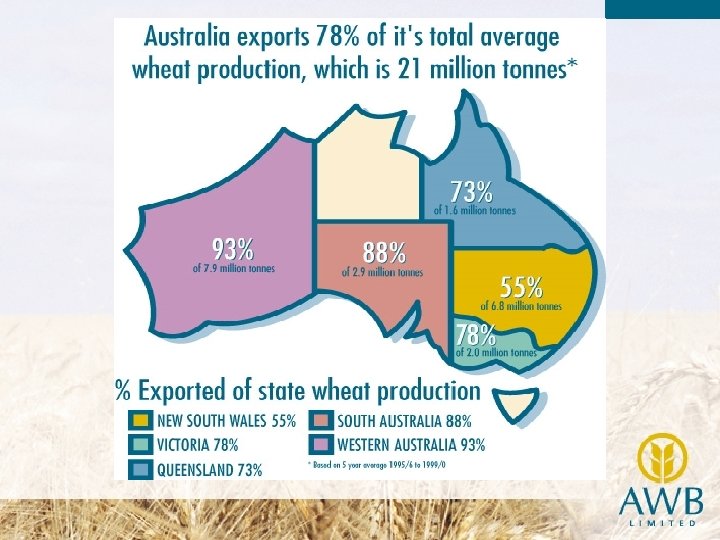

Australia’s Wheat Market Share

AWB is …. One of the largest wheat exporters in the world Exporter Wheat Export Volume (1) (m Tonnes) Canadian Wheat Board 19. 4 AWB 17. 1 Cargill (2) 13. 7 ADM (2) 4. 5 Conagra (2) 1. 9 1/ 99 -00, expected export volume 2/ U. S. exports only Source: USDA
 • Dual class – 37,")
AWB’s Structure • Unlisted public company (1 July 1999) • Dual class – 37, 000 A class shareholders • 1 share each with weighted voting – 67, 000 B class shareholders • 241 m shares issued • 425 employees, 30 offices in Australia and oversees

AWB’s Structure

Global Manager of Australian Grain. . . VISION Grains managed by AWB are the world grains of choice OBJECTIVE Maximise value for growers, customers, and shareholders MISSION AWB is the leading global manager of Australian grain

Financial Results • ½ year to 31 March 2000 – Operating Revenue: $1 b – NPAT: $41. 8 m – EPS: 17 cents • Full year to 30 September 2000 – – – Operating Revenue: $1. 7 -$1. 8 b(est) Related Revenue: $5. 5 b (est) NPAT: $62 -64 m (est) EPS: 26 cents (est) DPS: 22 cents (declared) Shareholders equity: $625 -630 m

AWB Faces Three Challenges. . . Business Strategy WINNING Stakeholder Satisfaction Organisational Capability

AWB is Building Strong Positions Across Each Link of the Value Chain AWB Seed Acquisition Storage Handling Shipping Trading Marketing Risk Mgmt Milling

The Wheat Industry Supply Chain Suffers Significant Inefficiencies Customer orders 1. Most customer orders are by telephone Customer AWB transport orders Product flows AWB forecasts & price signals 4. No access to actual grower production or delivery data 2. Most transport and BHC orders are by telephone, fax or manual e-mail Transport Companies Information flows AWB orders, & BHC inventory & movement reports 5. Most information flows are NOT automated BHCs 3. Most inventory and movement data are controlled by service providers • Limited access by AWB • Low data integrity due to manual systems Growers

Growth and Diversified Profit Streams 100% 80% Australian Export Wheat Harvest Value 60% Trading Performance Strategic Investments 40% Asset & Risk Management 20% 0% 2000 2003

Key Industry Considerations • Information Advantage • System Management • Regulation

Solid Foundation for Future Success • Strengthening our organisational capability • Strong and sustainable position within the industry • Strong profit growth in the core business • Reducing earnings volatility

Board & Management • Trevor Flugge - Chairman • Rob Barry – Deputy Chairman • Paul Ingleby – CFO • Tim Goodacre – Group GM Trading • Peter Geary – GM Export Pools
ba8076f449268323bfd0811b9d69bd9d.ppt