

a8c687ef72524506c6c2b1758c59a1f7.ppt
- Количество слайдов: 21
 An Econo-Physics Theory of Value: The Case of Micro. Finance in Africa Dr. Wolfgang Baer and Dr. Tom Housel Nascent Systems
 Digitality: Cell Phone Network Platform • Explosion of cell phone applications • Consumer financial transaction needs in developing African countries • Econophysics model to determine value of MPesa in Kenya and South Africa • Why does it work well in some African countries and not in others? • Implications for predicting the adoption rate of future cell phone applications
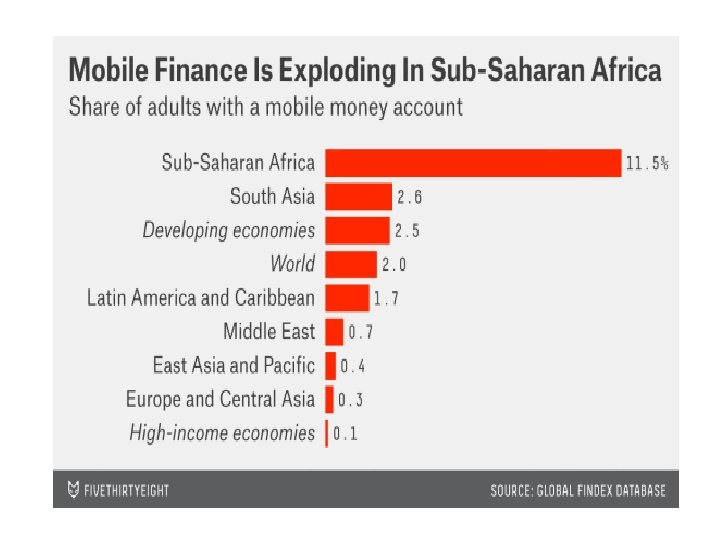
 Mobile Money Accounts • Worldwide = 2% of adults • sub-Saharan Africa =11. 5% of adults • Kenya = 58% of adults: – 20 million users – 2 million transactions per day – Moving 2. 1 Trillion KES per year (. 01 USD: 1 KES) – Accounts for approx. 60% of GDP in Kenya • South Africa = minimal penetration – 1 million users
 MPesa Services in Kenya • • • Deposit and withdraw money Transfer money to other users and non-users Pay bills Purchase airtime Bank account (with Equity Bank: M-KESHO) – interest-bearing accounts – loans – Insurance • Minimal cost per transaction
 Diagram 1: Econophysics Model: How To Calculate Market Performance from Fundamental Parameters Fundamental Attributes Update Attributes Feedback Customer Emotions Estimate Customer Needs Customer Engagement Customer Capabilities Product Price Product features Product design Manufacturing cost Advertising/ sales cost Competition Initial estimates Calculate Proto. Value Estimate Market Performance Parameters Adoption rate Market size Compare Measure
 Table 1: Comprehensive Physics-Economics Analogy PHYSICS ECONOMICS Potential-Energy Proto- Value Energy = Action/Time Proto-Value Ratio = Satisfaction/Distance Satisfaction is a need being satisfied Action is a change being made Happiness = rate at which satisfaction happens Energy = rate of Action flowing Proto-Value = Potential Happiness Distance = Barriers to Satisfaction Potential Energy = potential rate of Action flow Distance = Radius between masses Amount of Satisfaction = Amount of Need * Need to Solution Function* Amount of Solution Amount of Distance = cost to purchase + time to use + Learning-time + infrastructure + … Other. . (Baer, Housel, and Bergin, 2016)
 Diagram 2: Mass and Gravity Analogy Radiating Mass “M” M Potential Energy Field PE = m ∙G∙ M R m Absorbing mass “m” Distance “R” s = mass of a business product to satisfy “n” Proto-value Field s n∙G∙s PV = D Barrier “D” n n = mass of a Consumer’s need
 Diagram 3: Calculating Proto Value for in General Physics Analogy Equation for PE PE = Σi, jmj∙Gji∙Mi Rji Proto Value Matrix Calculation PV =Σi, jni∙Gij∙sj = Σi, j, kni • Hi, j • Fj, k • fk / Dik D Provider Solution Space an s. P O an Product Feature Space PIN Secured Tr Tr S O s. P Safe-S S Consumer Need Space k or ce Ac ss tw Ne User interface IF-Usability (1) Need vector ni = m i Solution Need Satisfaction Function H(ni, sj) Solution Vector S j = Mj Product Solution Function sj = Fj, k • fk Product Vector fk =Mk
 Diagram 4: Example Application Features to General Solutions Transform Tr a ns PO S Safe-S sj Application Solution Function sj = Fj, k • fk MPesa Vector k or w t PIN Secured – Secure PIN protected money storage Network Access- secure network availability Easy Interface – Pin, Business ID, Amount OK Trans. POS – Provides safe money transfer to Point of Sale(POS) 10 -4 Trans. POS (% Net Availability) . 9 10 = fk MPesa Features IF-Usability – min. Key stroke entry, max. control Safe-S – Provides safe money storage Safe-S (% money lost/trans) A User interface MPesa Solution 20 e cc Ne IF-Usability (sec/trans) H(ni, sj) ss PIN Secured Solution Vector 5 5 1 • . 0001. 9 Easy Interface 1 PIN Secured 1 Network Access
 Diagram 5: Example Customer to Provider Solution Fitness Matrix Customer Need to Solution Satisfaction Function Calculation ni = Hi, j • sj Provider Solution Space Customer Need Space an Tr Hi, j • sj S PO s Safe-S S O s. P an Tr IF-Usability If-Usability Customer Solution Appropriateness vector IF-Usability (sec/trans) 20 Safe-S(% money 2 x 10 -4 lost/trans) Trans. POS(% MPesa availability) . 522 Provider Solution Vector Fitness Matrix = 0 5 x 10 -6 1 0 20 0 1 0 0 . 58 • 10 -4 . 9 IF-Usability (sec/trans) Safe-S (% money lost/trans) Trans. POS (% Net Availability)
 Diagram 6: Common Gain Units Transformation of Solution Categories for the “MPesa” Application Gain by using MPessa Solution in (sec/trans) units in gain terms S 1 = 40 min*60 – 20 = 2380 (sec/trans gain) Solution in gain terms S 2 = 1 x 10 -1 - 2 x 10 -4 =. 0998 (KES gained/trans) Solution in gain terms S 3 = 52. 2% (availability / POS) Customer Solution Appropriateness vector in common units IF-Usability (KES/trans) Safe-S(money lost in KES/trans) Trans. POS (KES/trans) 276 315 131 = Customer Solution Appropriateness vector in gain terms Common Units Conversion Matrix 0 0 3157 0 0 0 2380 0 . 116 251 • IF-Usability (sec/trans) . 0998 Safe-S (%/100 money lost/trans) . 522 Trans. POS (%/100 Net Availability)
 Diagram 7: Need Vector Calculation for MPesa Lets assume the customer need is expressed by what he ideally would want. Instant transaction, completely safe, and always available. In gain units the results are: n 1 =30 sec/trans – 0 IF-Usability: His need is to execute the transaction in no time n 1 = 0 Safe-S: His need is to loose no money n 2 = 0 assumed loss 10%/trans Trans. POS: His need is to have the network be available 100% of the time Customer Need vector in common units IF-Usability (KES/trans) Safe-S (money lost in KES/trans) Trans. POS (KES/trans) 3. 48 315 251 = 0 3157 0 0 0 251 30 0 0 n 3 = 100%avail. Customer Need vector in gain terms Conversion Matrix. 116 n 2 =. 1 - 0 • IF-Usability (sec/trans) . 1 Safe-S (%/100 money lost/trans) 1 Trans. POS (%/100 Net Availability)
 Table 2: M-Pesa Application Protovalue Numerator Estimate Satisfaction Calculation Satisfaction Matrix Approximation S = Σi, j, k ni • Hi, j • Fj, k • fk Where: ni = need vector components Hi, j = the need to solution space fitness matrix Fj, k = the product feature to solution space matrix fj, k = the product feature vector components After combining in common units the Satisfaction “S” is the total need times the total satisfaction times the angle between them. Where: S = |n|*|s|* cos(Θ) s = Σj, k Hi, j • Fj, k • fk/Di, j the solution vector n = the need vector defined in the previous slide This is conveniently calculated by the dot product of the need and solution vector S = n • s = {c 1*s 1*c 1*n 1 + c 2*s 2*c 2*n 2 + c 3*(1 -s 3)*c 3*(1 -n 3)} (KES/trans)2 } = {276 * 487 964 Where: + 315*315 + 99478 + 131*251 } = + 32906 = 133349(KES/trans)2 Total solution (KES/Trans) = s = {c 1*s 1 + c 2*s 2 + c 3*s 3} KES/Trans Total need(KES/Trans) = n = {c 1*n 1 + c 2*n 2 + c 3*n 3} KES/Trans
 Table 3: Distance Calculation General formula for Proto. Value PV = Σi, j, k ni • Hi, j • Fj, k • fk/Di, j Where: Di, j = The distance-barrier is in general a matrix that defines the cost required for any product feature “k” to satisfy a need type “i” In simple cases for which common units are used the distancebarrier is “D” simply the transaction fee plus the operation time. D = (OT + TC + WAC)*NR =~ (2. 3 + 27+ 120) Where: OT = The operational time of 30 sec. in common units is 2. 1 KES/Trans TC = The transaction cost in common units is 27 KES/Trans WAC = Work around cost is = c 3*(1 -c 2) = 251*(1 -. 522) = 120 KES/trans NR = network reliability %/100 D = 165. 9 KES/Trans
 Table 4: Proto. Value General formula for Proto. Value PV = Σi, j, k ni • Hi, j • Fj, k • fk/Di, j In common units the general formula reduces to Proto. Value = n*s/D Where: D = 165. 9 (KES/trans) n • s = S = 133349 (KES/trans)2 Substituting Gives Proto. Value for the M-Pesa Case in Kenya: Proto. Value = 803 (KES/trans)
 Table 5: Kenya vs South Africa Kenya 27 kes/tran SA 2 zar/tran Baseline transaction cost without MPesa(wo MP) • MPesa Transaction per day 40 min/tran 20 min/tran • MPesa Tansaction Value per year 23 x 1012 kes/yr • Transaction fee • 2 x 10⁶ tran/day 2 x 10⁵ tran/day 58% • MPesa acceptance rate . 116 kes/sec • Value of user’s time 10% • Perceived % Cash loss(wo M-P) 1700 $/yr • Average income/person 57 x 109 Zar/yr 10%. 095 zar/sec 1% 9489 $/yr • Not Acceptance Work around rate 90% • Network and server availability rate 90% • Proto-Value (local currency • Proto-Value (usd/trans) 803. 6 KES/trans 7. 9 USD/trans 12. 3 ZAR/trans. 86 USD/trans
 Conclusions • Explaining and predicting monetized or non-monetized value – Vary product design parameters to determine benefit in Proto. Value to customers – Prior to sales revenue, establishing valuation • Predicting adoption rate – Adjusting product features, customer need fit over time • Need a library of Fundamental Attributes
 Contact Information • Wolfgang Baer Research Prof. Information Science NPS Ret. Research Director Nascent Systems Inc. Wolf@Nascent. Inc. com 380 W Carmel Valley Rd. Carmel Valley CA 93924 Wolf@Nascent. Inc. com URL http: //www. nascentinc. com Nascent Systems
 Different kinds of Masses The mass “M” of a business product are the solutions that satisfy three needs Barrier “R” A business projects a Proto-value Field for its Products Voice = M 1= E-mail = M 2 PV = MPesa= M 3 M 1∙G 11∙m 1 PV 1 = R 11 M 2∙G 22∙m 2 PV 2 = R 22 PV 3 = M 3∙G 33∙m 3 R 33 m m 1=talk The mass “m” of a Consumer’s three needs m 2=write m 3=buy Matrix notation M 1 M 2 M 3 PV = G 11/R 11 0 0 m 1 0 G 22/R 22 0 m 2 0 0 G 33/R 11 m 3 =Σi, j Mi∙Gij∙mj Rij
 Kenyan: MPesa Application Example MPesa Feature Space PIN Secured Provider Solution Space T S( 3 PO ns s. P n ra Tr a 3) S( O Safe-S (2) ) Consumer Need Space Usability (1) Need vector ni Solution Need Satisfaction Function H(ni, sj) Product satisfaction function Satisfaction Matrix Approximation Proto Value Matrix approximation sj k or tw Ne Phone interface Usability (1) Solution Vector ss ce Ac Product Solution Function sj = Fj(fk) Satisfaction: S =H(ni, Fj(fk)) S = Σi, j, k ni • Hi, j • Fj, k • fk PV = Σi, j, k ni • Hi, j • Fj, k • fk / Dik Product Vector fk =Mk