
American Society Economy. Demographics. Religion Economy


- Размер: 11.5 Mегабайта
- Количество слайдов: 105
Описание презентации American Society Economy. Demographics. Religion Economy по слайдам
American Society Economy. Demographics. Religion
Economy It is market-oriented economy. The United States has the largest, most technologically powerful and most diverse economy of any nation-state in the world. It has been the world’s largest national economy (not including colonial empires) since at least the 1890 s. As of 2010, the country remains the world’s largest manufacturer, representing a fifth of the global manufacturing output.
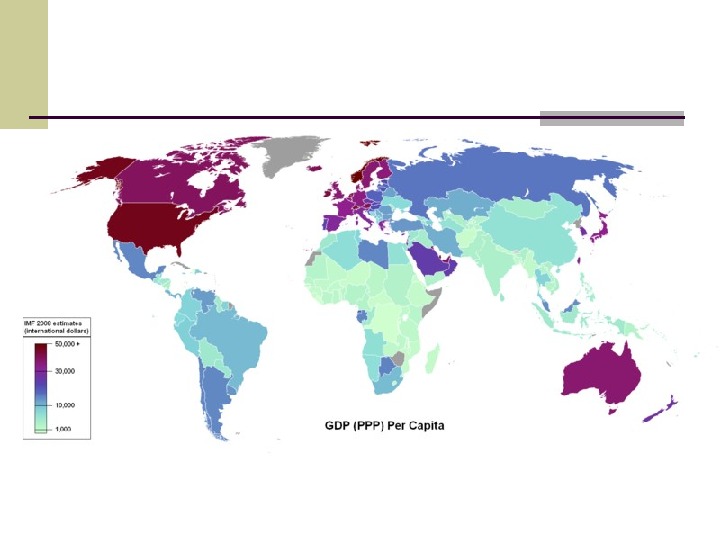
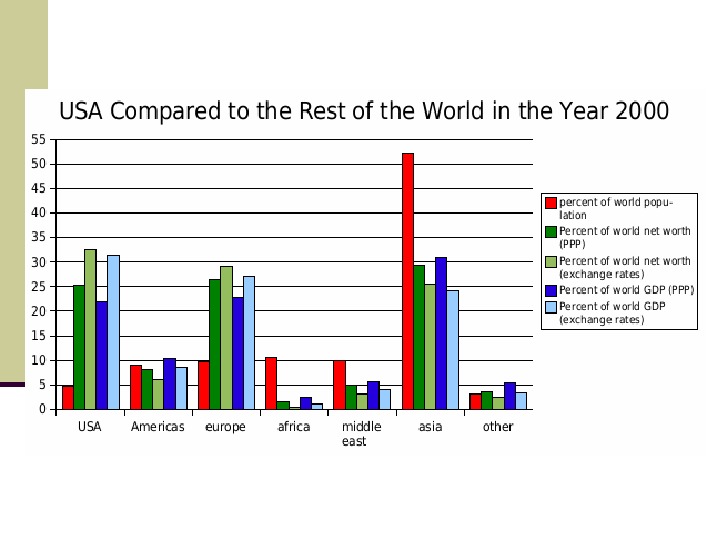
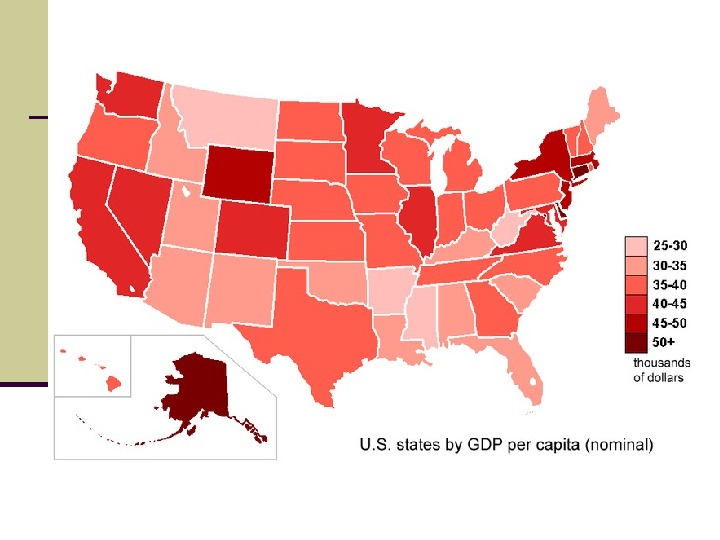
GDP – 1 st place $15. 6 trillion equals to 19% of global GDP (2012) or 22% of the gross world product, $14. 266 trillion (2009) The per capita GDP of the U. S. ($49, 601 in 2012) was the world’s sixth-highest as of 2010, the 17 th as of 2009.
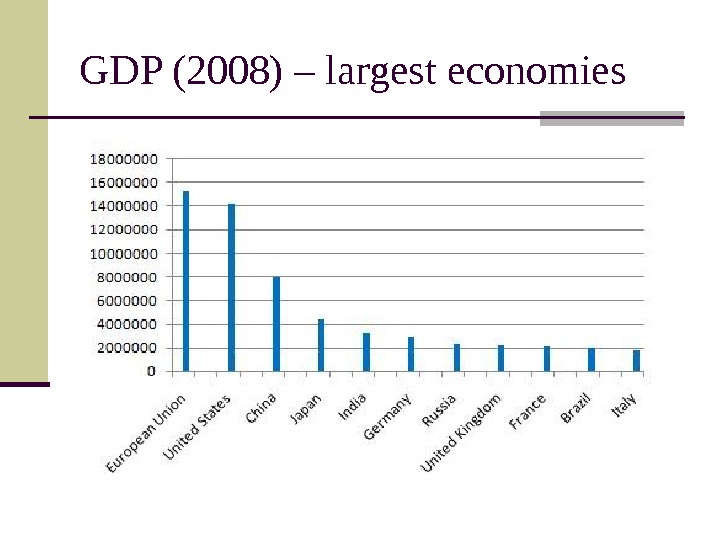
GDP (2008) – largest economies
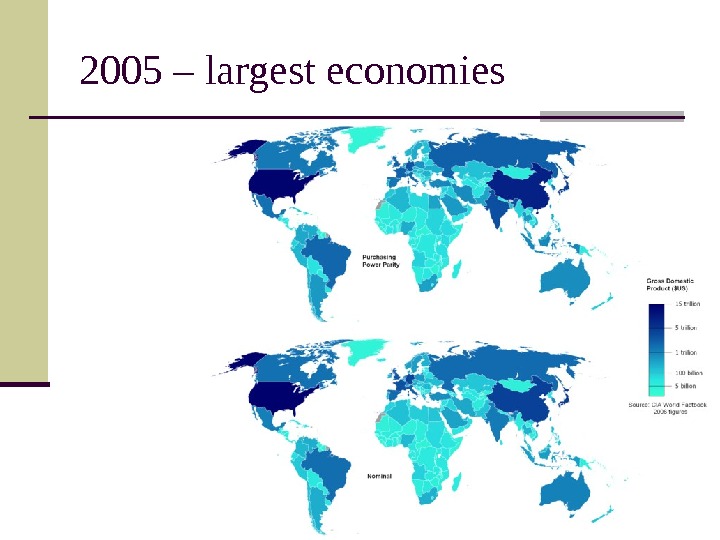
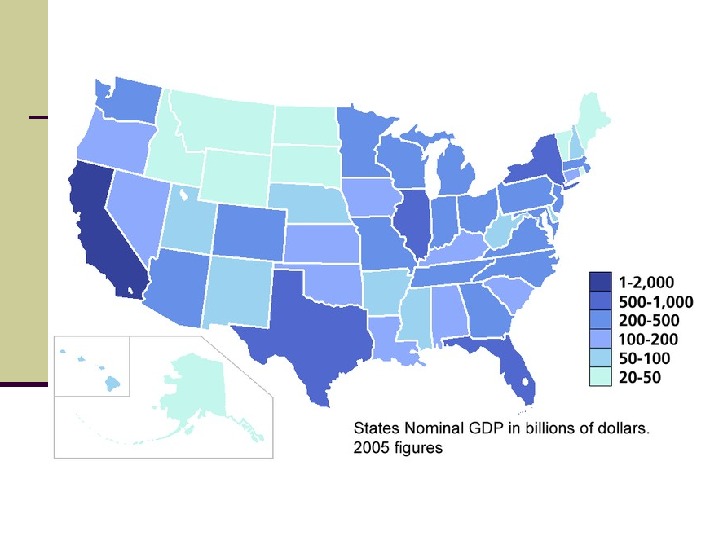
2005 – largest economies
Economy’s strengths an abundance of natural resources, a well-developed infrastructure, and high productivity, one of the world’s largest manufacturers a leader in scientific research and technological innovation relatively low levels of regulation and government involvement The U. S. is the world’s third-largest producer of oil and second-largest producer of natural gas. It is the second-largest trading nation in the world behind China.
Natural Resources The United States has many natural resources, including coal, copper, lead, molybdenum, phosphates, uranium, bauxite, gold, iron, mercury, nickel, potash, silver, tungsten, zinc, petroleum, natural gas, timber. One of the natural resources is land: arable land: 18. 01%; permanent crops: 0. 21%; other: 81. 78%; irrigated land : 223, 850 sq km note: the US has the world’s largest coal reserves with 491 billion short tons accounting for 27% of the world’s total
Main agricultural products In agriculture, it is a top producer of wheat, corn, other grains, fruits, vegetables, cotton; beef, pork, poultry, dairy products; fish; forest products ; the United States is a net exporter of food.
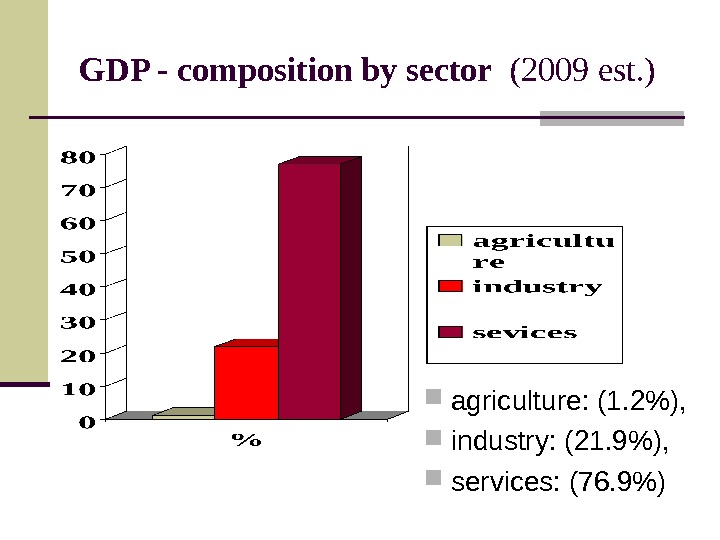
GDP — composition by sector (2009 est. ) agriculture: (1. 2%), industry: (21. 9%), services: (76. 9%)
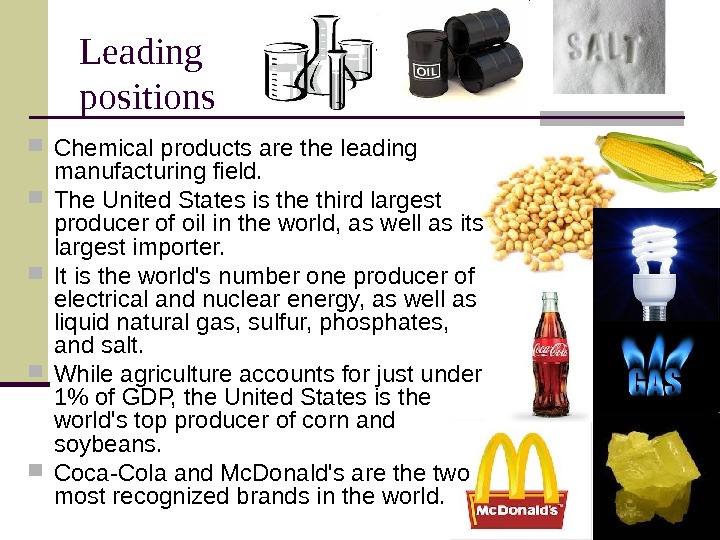
Leading positions Chemical products are the leading manufacturing field. The United States is the third largest producer of oil in the world, as well as its largest importer. It is the world’s number one producer of electrical and nuclear energy, as well as liquid natural gas, sulfur, phosphates, and salt. While agriculture accounts for just under 1% of GDP, the United States is the world’s top producer of corn and soybeans. Coca-Cola and Mc. Donald’s are the two most recognized brands in the world.
Main industries: petroleum, steel, motor vehicles, aerospace, telecommunications, chemicals, creative industries, electronics, food processing, consumer goods, lumber, mining, defense
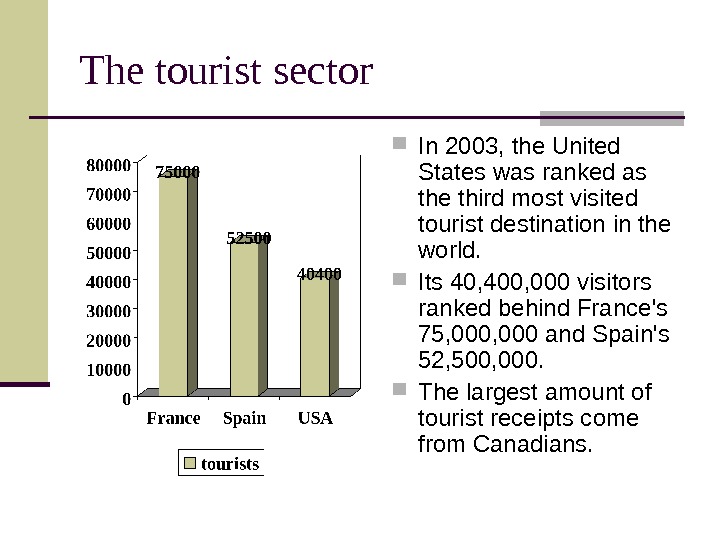
The tourist sector In 2003, the United States was ranked as the third most visited tourist destination in the world. Its 40, 400, 000 visitors ranked behind France’s 75, 000 and Spain’s 52, 500, 000. The largest amount of tourist receipts come from Canadians.
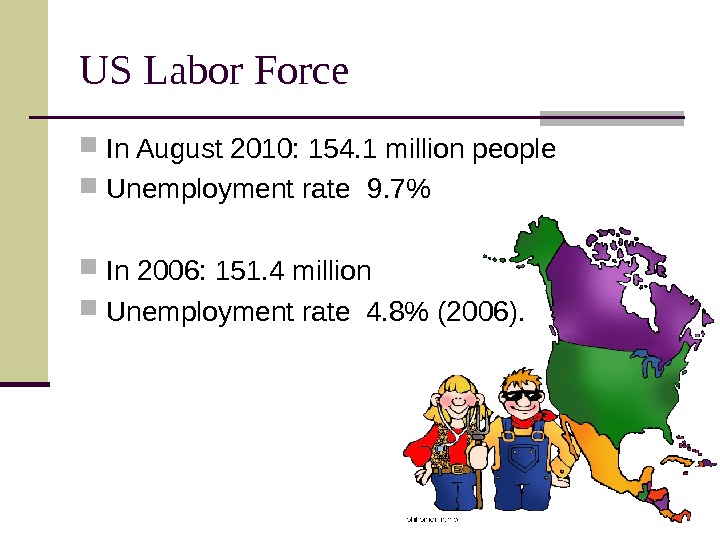
US Labor Force In August 2010: 154. 1 million people Unemployment rate 9. 7 % In 2006: 151. 4 million Unemployment rate 4. 8% (2006).
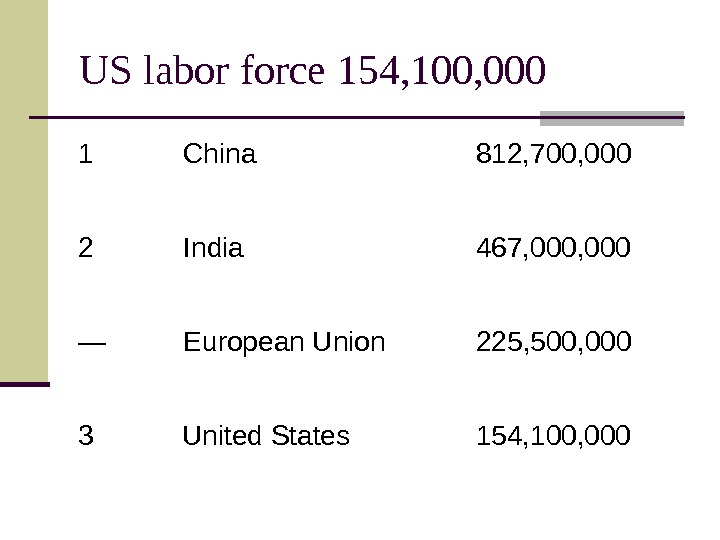
US labor force 154, 100, 000 1 China 812, 700, 000 2 India 467, 000 — European Union 225, 500, 000 3 United States 154, 100,
Labor force employment With 21. 2 million people, government is the leading field of employment. The largest private employment sector is health care and social assistance , with 16. 4 million people. About 12% of workers are unionized , compared to 30% in Western Europe. The World Bank ranks the United States first in the ease of hiring and firing workers.
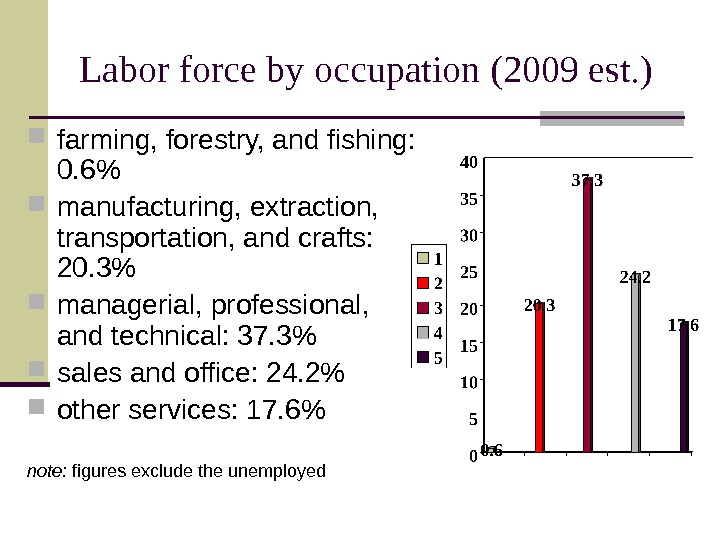
Labor force by occupation (2009 est. ) farming, forestry, and fishing: 0. 6% manufacturing, extraction, transportation, and crafts: 20. 3% managerial, professional, and technical: 37. 3% sales and office: 24. 2% other services: 17. 6% note: figures exclude the unemployed
Unemployment The unemployment rate now: 7. 8% in 2010: 9. 7% in 2008: 5. 8% For January 2008 in the U. S. the unemployment rates were 4. 4% for adult men, 4. 2% for adult women, 4. 4% for Caucasians, 6. 3% for Hispanics or Latinos (all races), 9. 2% for African Americans, 3. 2% for Asian Americans, and 18. 0% for teenagers.
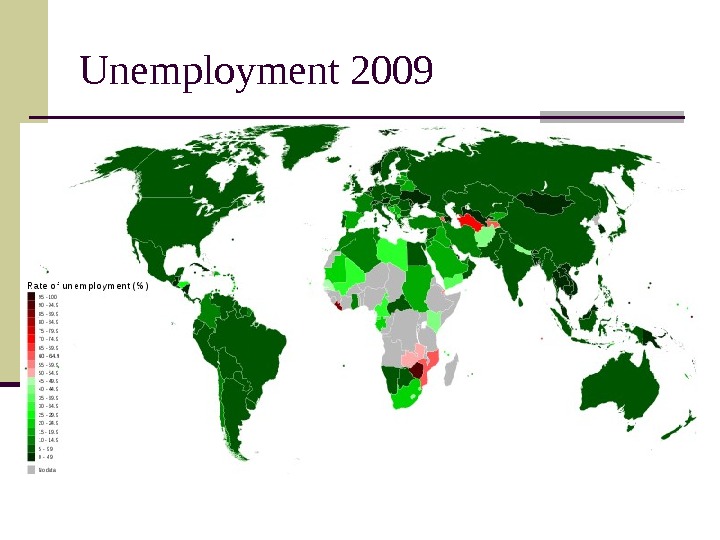
Unemployment
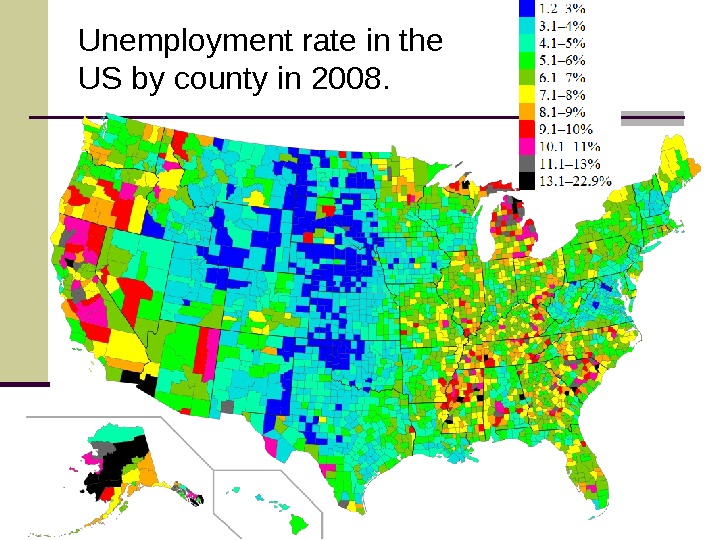
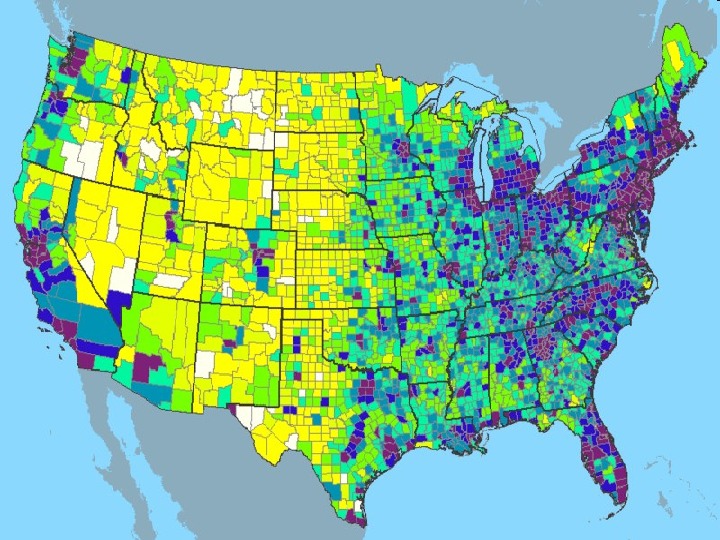
Unemployment rate in the US by county in 2008.
Productivity In 2009, the United States had the third highest labor productivity person in the world, behind Luxembourg and Norway. It was fourth in productivity per hour, behind those two countries and the Netherlands.
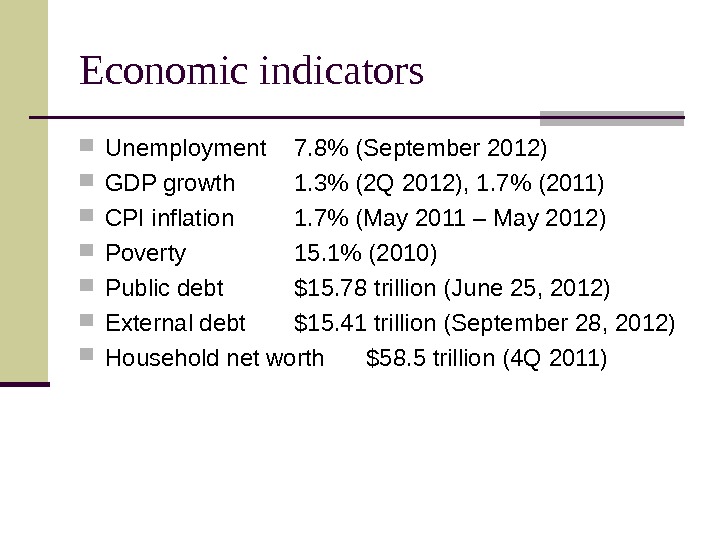
Economic indicators Unemployment 7. 8% (September 2012) GDP growth 1. 3% (2 Q 2012), 1. 7% (2011) CPI inflation 1. 7% (May 2011 – May 2012) Poverty 15. 1% (2010) Public debt $15. 78 trillion (June 25, 2012) External debt $15. 41 trillion (September 28, 2012) Household net worth $58. 5 trillion (4 Q 2011)
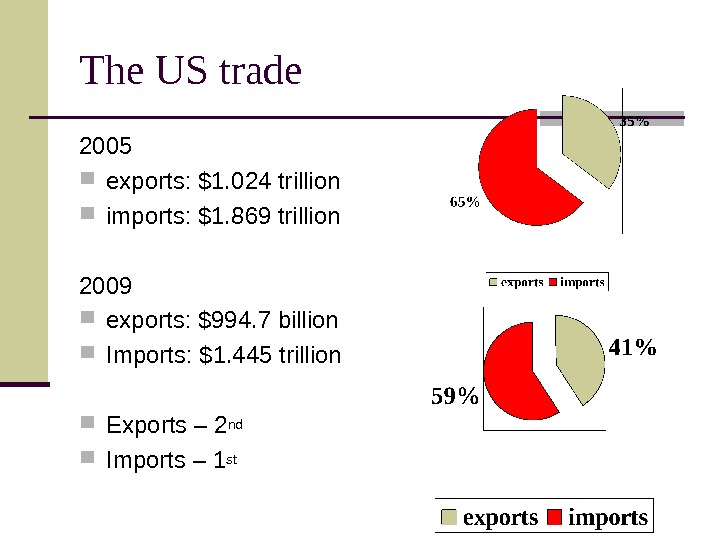
The US trade 2005 exports: $1. 024 trillion imports: $1. 869 trillion 2009 exports: $994. 7 billion Imports: $1. 445 trillion Exports – 2 nd Imports – 1 st
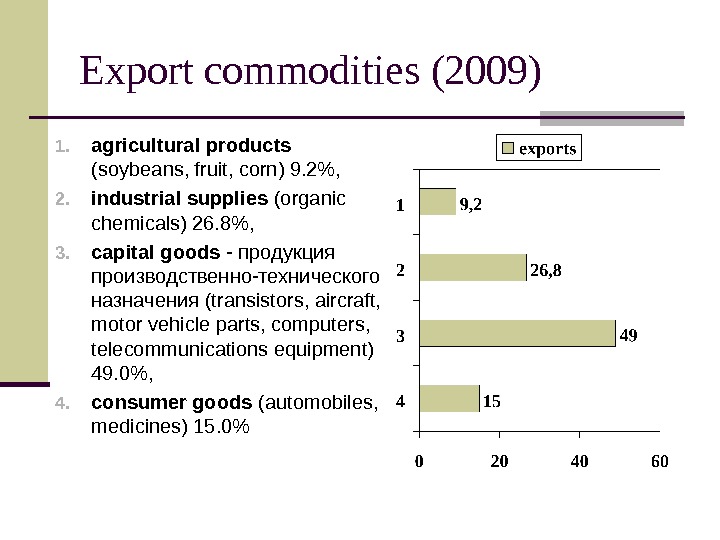
Export commodities (2009) 1. agricultural products (soybeans, fruit, corn) 9. 2%, 2. industrial supplies (organic chemicals) 26. 8%, 3. capital goods — продукция производственно-технического назначения (transistors, aircraft, motor vehicle parts, computers, telecommunications equipment) 49. 0%, 4. consumer goods (automobiles, medicines) 15. 0%
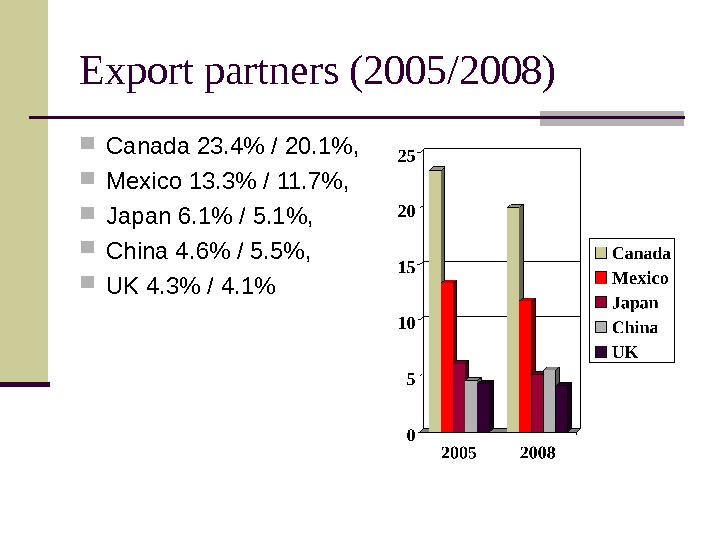
Export partners (2005/2008) Canada 23. 4% / 20. 1%, Mexico 13. 3% / 11. 7%, Japan 6. 1% / 5. 1%, China 4. 6% / 5. 5%, UK 4. 3% / 4. 1%
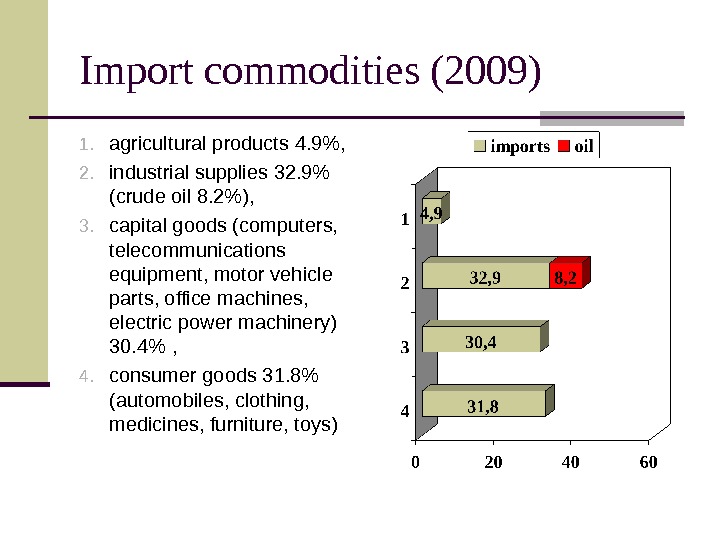
Import commodities (2009) 1. agricultural products 4. 9%, 2. industrial supplies 32. 9% (crude oil 8. 2%), 3. capital goods (computers, telecommunications equipment, motor vehicle parts, office machines, electric power machinery) 30. 4% , 4. consumer goods 31. 8% (automobiles, clothing, medicines, furniture, toys)
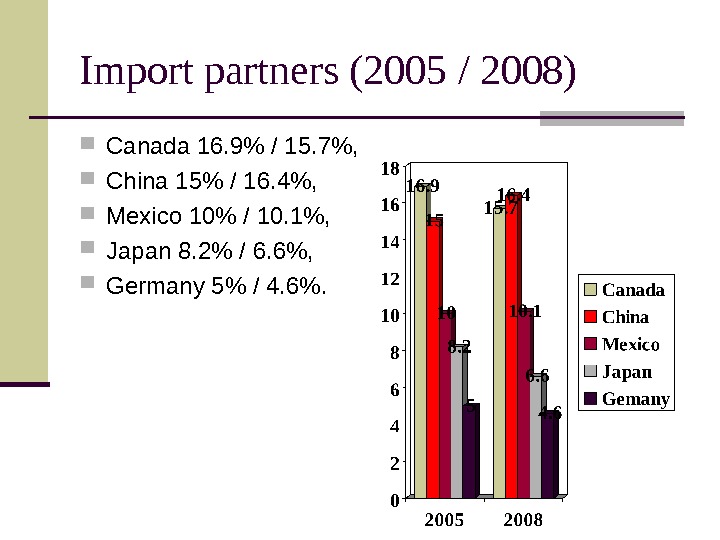
Import partners (2005 / 2008) Canada 16. 9% / 15. 7%, China 15% / 16. 4%, Mexico 10% / 10. 1%, Japan 8. 2% / 6. 6%, Germany 5% / 4. 6%.
Economic Diversification New York City — financial, publishing, broadcasting, and advertising industries. Silicon Valley — high technology hub. Los Angeles — film and television production. The Midwest — manufacturing and heavy industry (Chicago is the «Capital of the Midwest, » Detroit and Michigan serve as the center of the American automotive industry). The Great Plains — the «breadbasket» (tremendous agricultural output). The intermountain region — a mining hub and gas resource. The Pacific Northwest — fish and timber. Texas — the oil industry. The Southeast — medical research and the textiles industry.
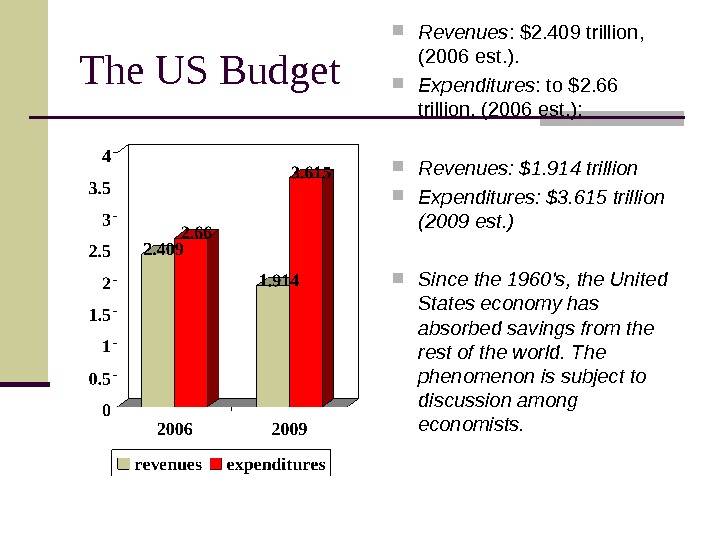
The US Budget Revenues : $2. 409 trillion, (2006 est. ). Expenditures : to $2. 66 trillion, (2006 est. ); Revenues: $1. 914 trillion Expenditures: $3. 615 trillion (2009 est. ) Since the 1960’s, the United States economy has absorbed savings from the rest of the world. The phenomenon is subject to discussion among economists.
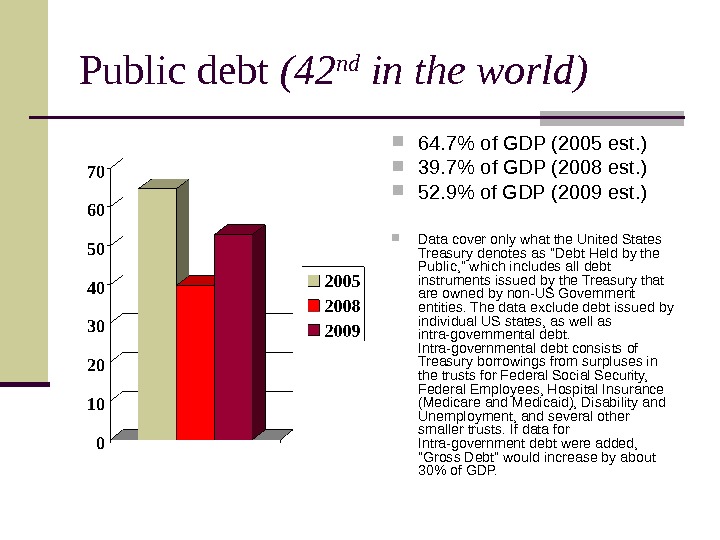
Public debt (42 nd in the world) 64. 7% of GDP (2005 est. ) 39. 7% of GDP (2008 est. ) 52. 9% of GDP (2009 est. ) Data cover only what the United States Treasury denotes as «Debt Held by the Public, » which includes all debt instruments issued by the Treasury that are owned by non-US Government entities. The data exclude debt issued by individual US states, as well as intra-governmental debt. Intra-governmental debt consists of Treasury borrowings from surpluses in the trusts for Federal Social Security, Federal Employees, Hospital Insurance (Medicare and Medicaid), Disability and Unemployment, and several other smaller trusts. If data for Intra-government debt were added, «Gross Debt» would increase by about 30% of GDP.
Summary Debt Accounting The Summary Debt Accounting program is responsible for accounting for the public debt of the United States and related interest expenses. Summary Debt Accounting : Over $ 16. 615 trillion (June 25, 2012)
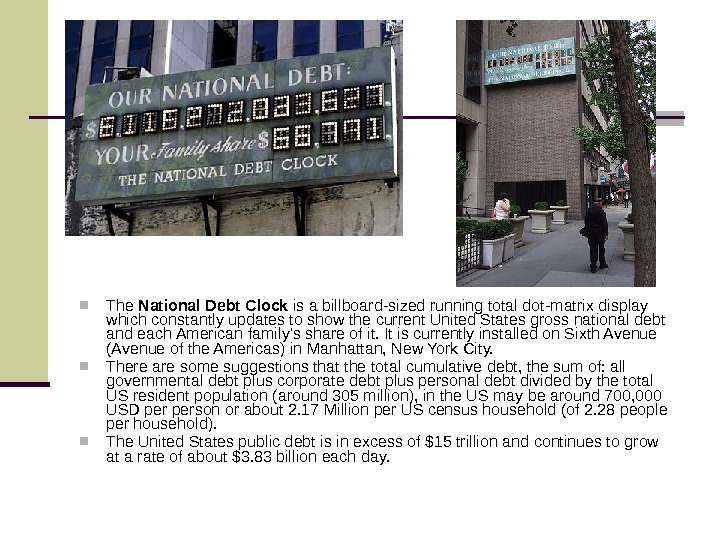
The National Debt Clock is a billboard-sized running total dot-matrix display which constantly updates to show the current United States gross national debt and each American family’s share of it. It is currently installed on Sixth Avenue (Avenue of the Americas) in Manhattan, New York City. There are some suggestions that the total cumulative debt, the sum of: all governmental debt plus corporate debt plus personal debt divided by the total US resident population (around 305 million), in the US may be around 700, 000 USD person or about 2. 17 Million per US census household (of 2. 28 people per household). The United States public debt is in excess of $15 trillion and continues to grow at a rate of about $3. 83 billion each day.
http: //www. usdebtclock. org/
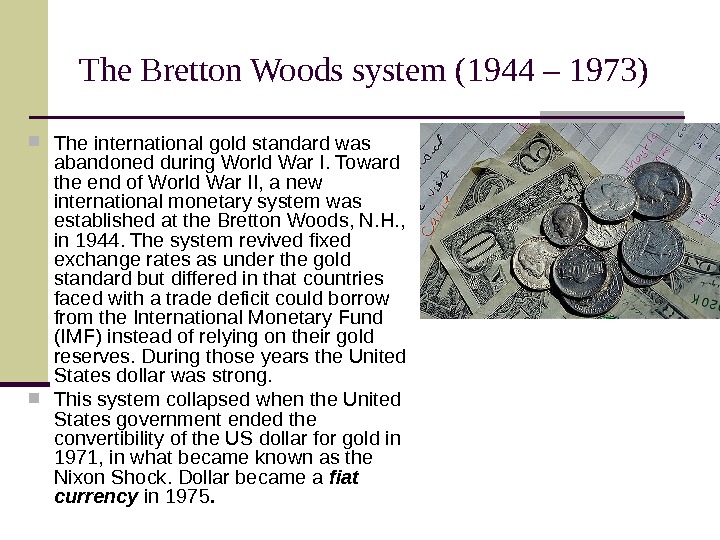
The Bretton Woods system (1944 – 1973) The international gold standard was abandoned during World War I. Toward the end of World War II, a new international monetary system was established at the Bretton Woods, N. H. , in 1944. The system revived fixed exchange rates as under the gold standard but differed in that countries faced with a trade deficit could borrow from the International Monetary Fund (IMF) instead of relying on their gold reserves. During those years the United States dollar was strong. This system collapsed when the United States government ended the convertibility of the US dollar for gold in 1971, in what became known as the Nixon Shock. Dollar became a fiat currency in 1975.
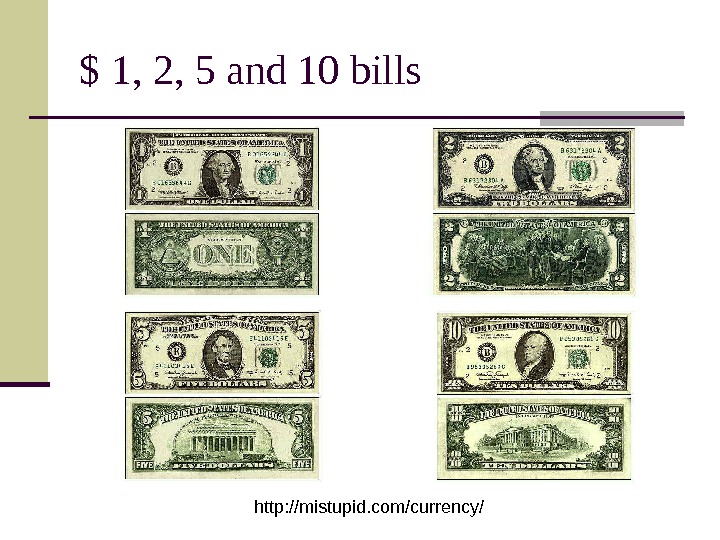
$ 1, 2, 5 and 10 bills http: //mistupid. com/currency/
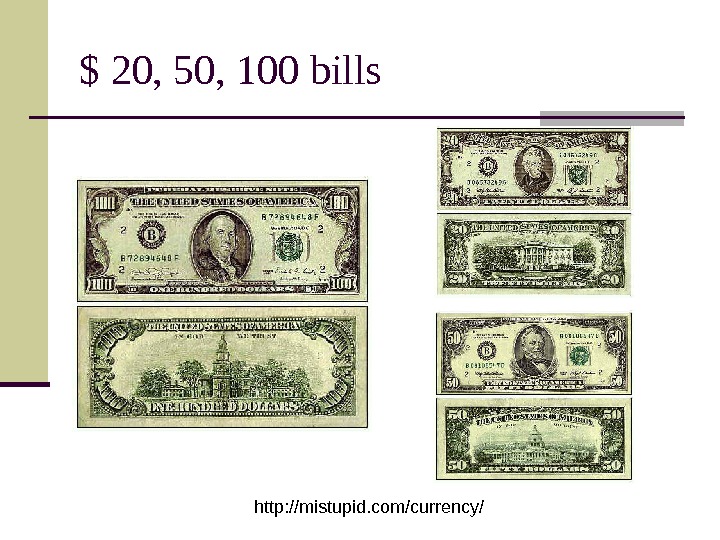
$ 20, 50, 100 bills http: //mistupid. com/currency/
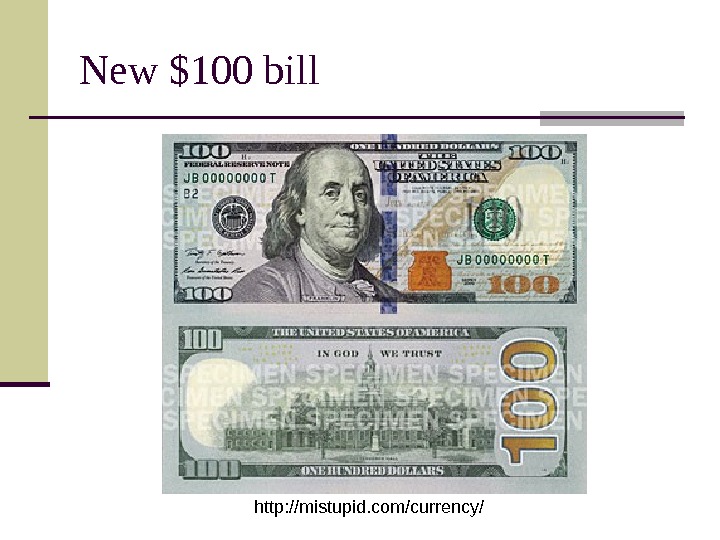
New $100 bill http: //mistupid. com/currency/
Financial markets About 60% of the global currency reserves have been invested in the United States dollar, while 24% have been invested in the euro. The country is one of the world’s largest and most influential financial markets.
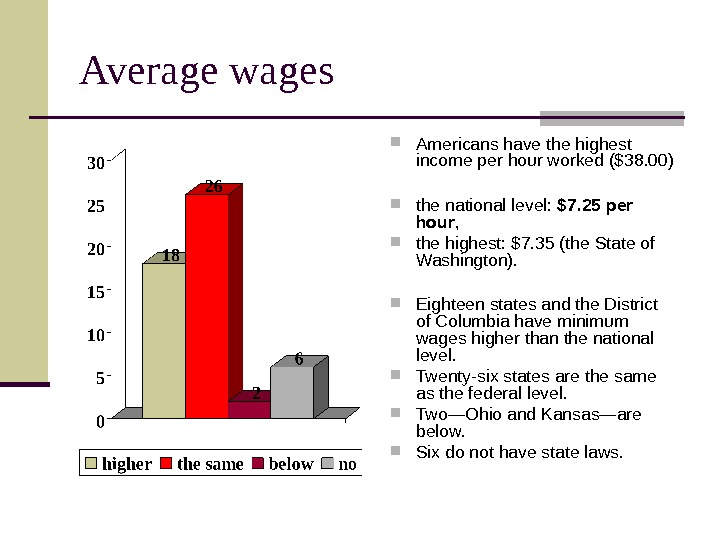
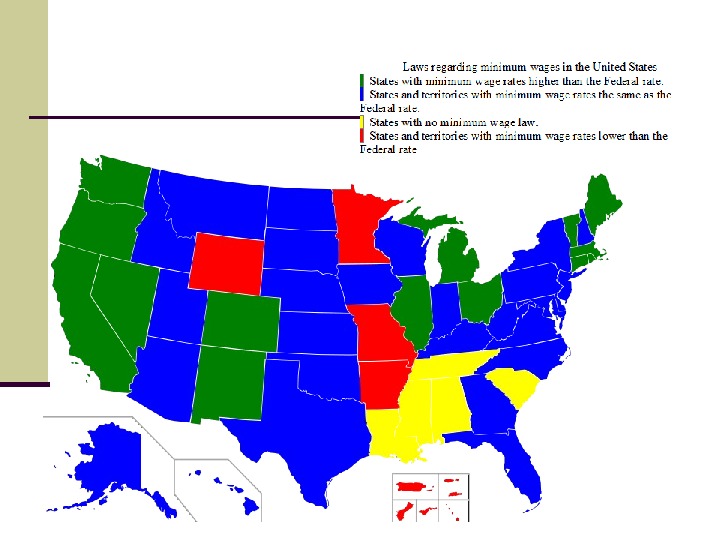
Average wages Americans have the highest income per hour worked ($38. 00) the national level: $7. 25 per hour , the highest: $7. 35 (the State of Washington). Eighteen states and the District of Columbia have minimum wages higher than the national level. Twenty-six states are the same as the federal level. Two—Ohio and Kansas—are below. Six do not have state laws.
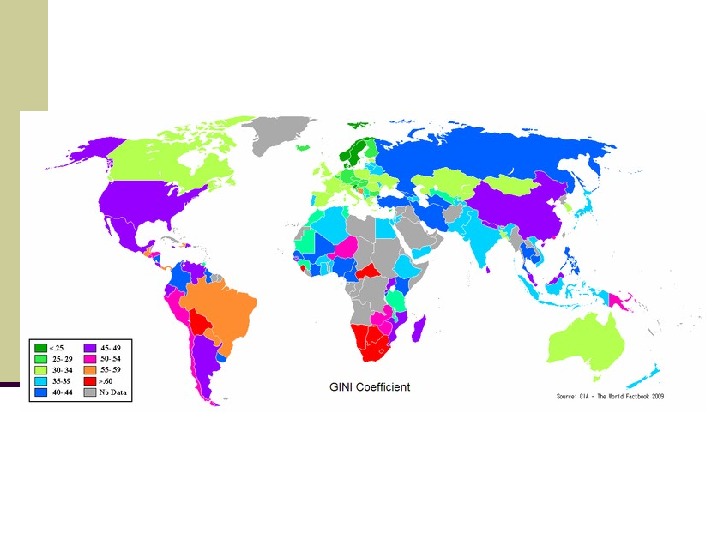
Income ratings The United Nations Development Programme Report 2005 ranks income the United States as the 74 th out of 124 countries, as measured by the Gini coefficient. The Gini coefficient is a measure of inequality of income or wealth (used in economics, health science, ecology, and chemistry). The richest 10% make 15. 9 times as much as the poorest 10%, and the richest 20% make 8. 4 times as much as the poorest 20%. However, the median income in America is greater than in most industrialized nations, placing higher by the Gini coefficient.
Poverty line America’s poverty line is defined for a family of four as an income of less than $19, 157. About 12. 7% of the general population are below the poverty line. One out of every five children in the US grows up below the official poverty line. Among racial groups : Native Americans and Alaska Natives have the lowest median income; Asians have the highest. Regionally: the southern states have the lowest median incomes; the West Coast and New England have the highest.
Standard of living UN Human Development Index The Human Development Index (HDI) is a comparative measure of life expectancy, literacy, education and standards of living for countries worldwide. It is a standard means of measuring well-being, especially child welfare. It is used to distinguish whether the country is a developed, a developing or an under-developed country, and also to measure the impact of economic policies on quality of life. The United States is always in the top ten, though lower than the Scandinavian countries, Canada, Australia, and Japan Human Poverty Index the US is ranked lowest among the selection of 17 wealthiest countries, scoring low on all counts but long term unemployment.
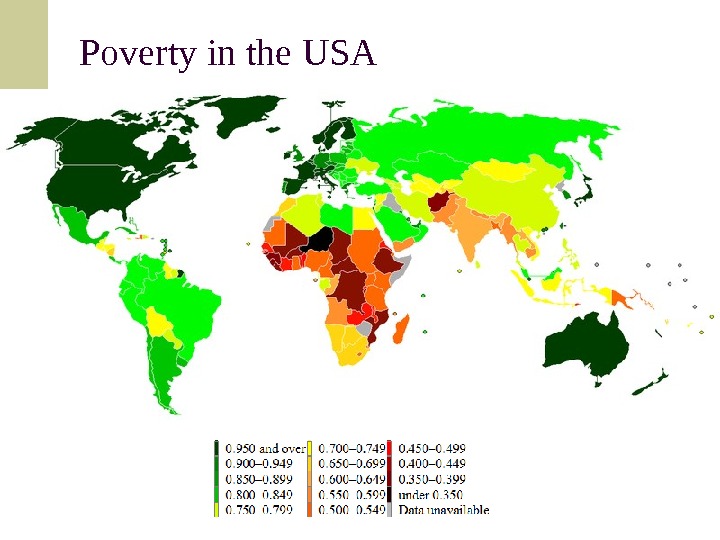
Poverty in the US
Standard of living Americans are some of the wealthiest people in the world, with a very high GDP per capita ( $ 49, 601 ). Americans are top in the world for most material possessions. The numbers of televisions, vehicles, and other such products person are considerably higher than in any other country. For instance, the United States has some 754 televisions for every thousand people; no other major state is even above 700, with Japan being closest at 680/1000.
What is Fi. Di?
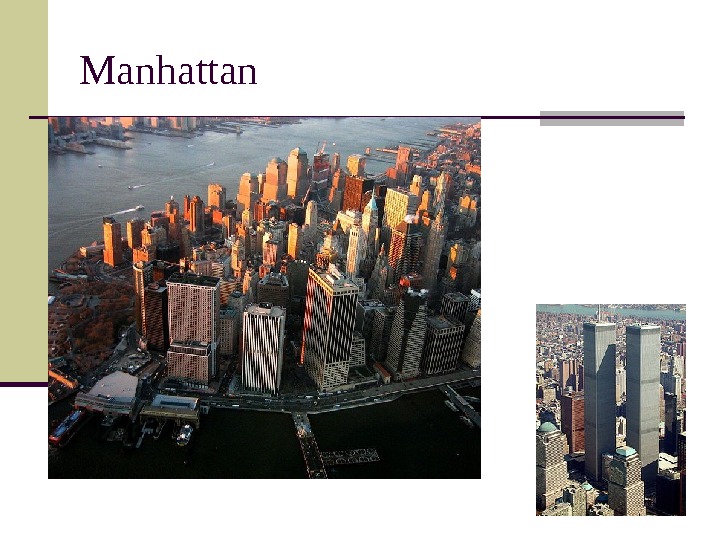
Financial District The Financial District of New York City (sometimes called Fi. Di ) is a neighborhood on the southernmost section of the borough of Manhattan which comprises the offices and headquarters of many of the city’s major financial institutions, including the New York Stock Exchange and the Federal Reserve Bank of New York. The World Trade Center existed in the neighborhood until the September 11 attacks and is currently being rebuilt. The neighborhood roughly overlaps the boundaries of the New Amsterdam settlement in the late 17 th century and has a residential population of about 56, 000. During the day, the population swells to about 300, 000.
Manhattan
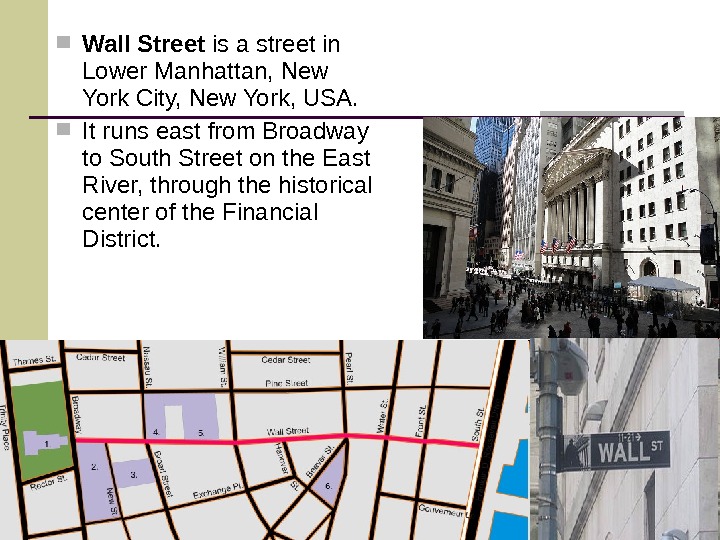
Wall Street is a street in Lower Manhattan, New York City, New York, USA. It runs east from Broadway to South Street on the East River, through the historical center of the Financial District.
What is Wall Street?
Wall Street
Wall Street in films The film Die Hard with a Vengeance has a plot involving thieves breaking into the Federal Reserve Bank of New York and stealing most of the gold bullion stored underground by driving dump trucks through a nearby Wall Street subway station.
Wall Street in films In the film National Treasure a clue to finding the Templar Treasure leads the main characters to Wall Street’s Trinity Church.
What is NYSE?
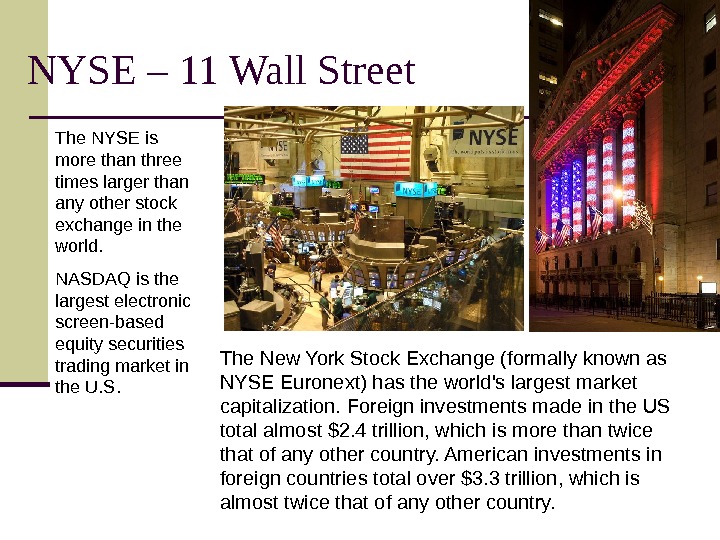
NYSE – 11 Wall Street The New York Stock Exchange (formally known as NYSE Euronext) has the world’s largest market capitalization. Foreign investments made in the US total almost $2. 4 trillion, which is more than twice that of any other country. American investments in foreign countries total over $3. 3 trillion, which is almost twice that of any other country. The NYSE is more than three times larger than any other stock exchange in the world. NASDAQ is the largest electronic screen-based equity securities trading market in the U. S.
Market Trends A bull market is associated with increasing investor confidence , and increased investing in anticipation of future price increases (capital gains). A bullish trend in the stock market often begins before the general economy shows clear signs of recovery. It is a win situation for the investors. A bear market is a general decline in the stock market over a period of time. It is a transition from high investor optimism to widespread investor fear and pessimism.
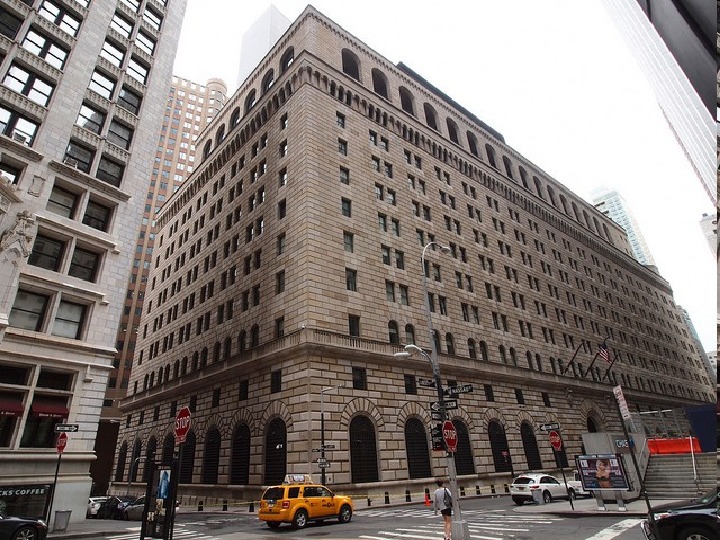
Federal Reserve Bank of New York The Federal Reserve Bank of New York is one of the 12 Federal Reserve Banks of the United States. It is located at 33 Liberty Street, New York, NY. It is responsible for the Second District of the Federal Reserve System, which encompasses New York state, the 12 northern counties of New Jersey, Fairfield County in Connecticut, Puerto Rico, and the U. S. Virgin Islands. Working within the Federal Reserve System, the New York Fed implements monetary policy, supervises and regulates financial institutions and helps maintain the nation’s payment systems.
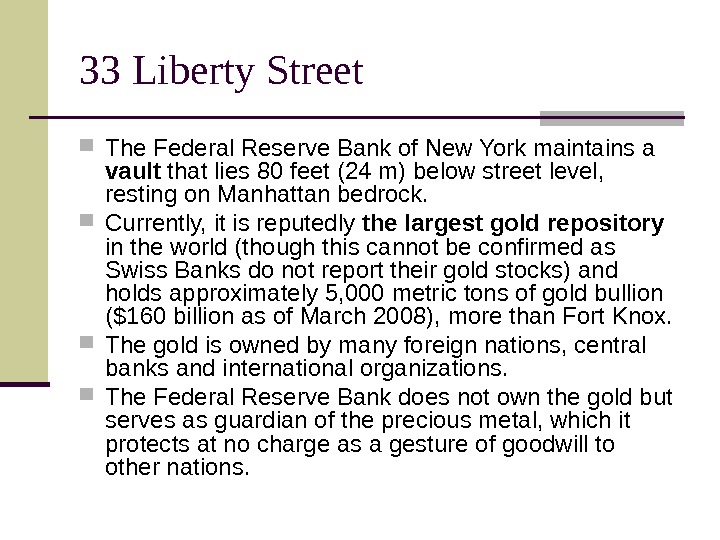
33 Liberty Street The Federal Reserve Bank of New York maintains a vault that lies 80 feet (24 m) below street level, resting on Manhattan bedrock. Currently, it is reputedly the largest gold repository in the world (though this cannot be confirmed as Swiss Banks do not report their gold stocks) and holds approximately 5, 000 metric tons of gold bullion ($160 billion as of March 2008), more than Fort Knox. The gold is owned by many foreign nations, central banks and international organizations. The Federal Reserve Bank does not own the gold but serves as guardian of the precious metal, which it protects at no charge as a gesture of goodwill to other nations.
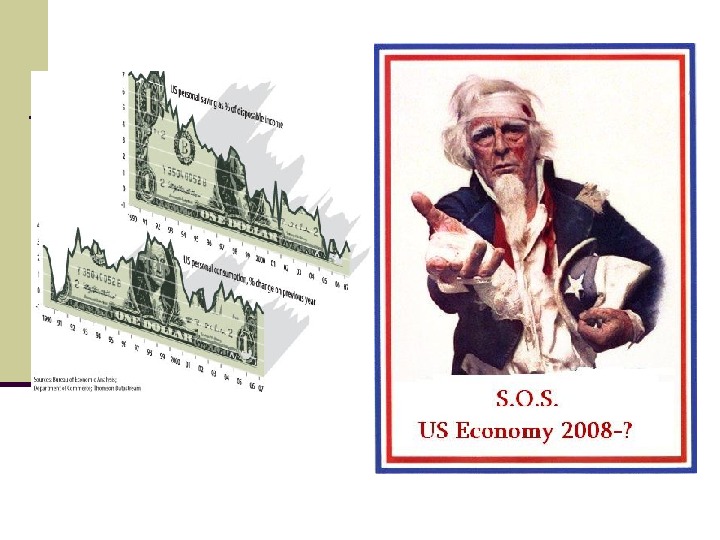
World Crisis
Trade organizations NAFTA — The North American Free Trade Agreement, or NAFTA, created the largest trade bloc in the world in 1994. WTO — World Trade Organization, OECD — Ogranization for Economic Co-operation and Development, G-20, G 8 and others
Curious facts A 2011 poll found that more than half of all Americans think the U. S. is still in recession or even depression, despite official data. In 2013, the United States ranks equal 16 th in the best-country-to-be-born-in list. The United States is ranked first globally in the IT industry competitiveness index
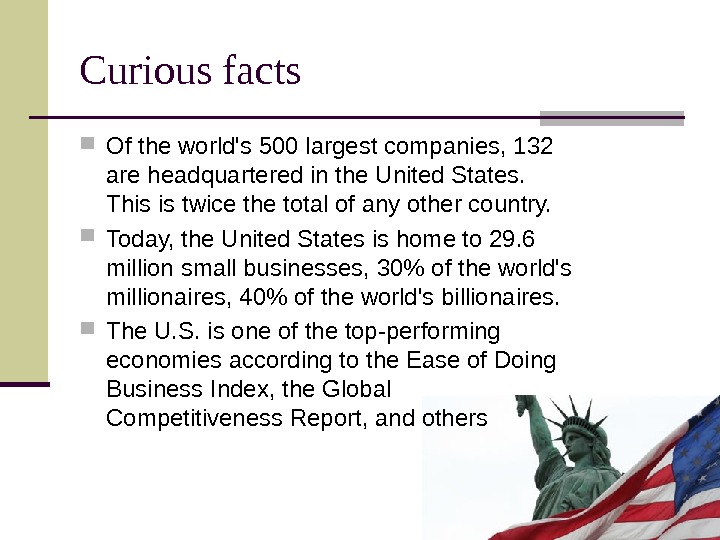
Curious facts Of the world’s 500 largest companies, 132 are headquartered in the United States. This is twice the total of any other country. Today, the United States is home to 29. 6 million small businesses, 30% of the world’s millionaires, 40% of the world’s billionaires. The U. S. is one of the top-performing economies according to the Ease of Doing Business Index, the Global Competitiveness Report, and others
Curious facts In 2011, the 20 largest U. S. -based companies by revenue were Walmart, Exxon. Mobil, Chevron, Conoco. Phillips, Fannie Mae, General Electric, Berkshire Hathaway, General Motors, Ford Motor Company and Hewlett-Packard, AT&T, Cargill, Mc. Kesson Corporation, Bank of America, Federal Home Loan Mortgage Corporation, Apple Inc. , Verizon, JPMorgan Chase, and Cardinal Health.
Curious facts Apple, Google, IBM, Mc. Donald’s, and Microsoft are the world’s five most valuable brands in an index published by Millward Brown
Curious facts The United States has been the birthplace of 161 of Britannica’s 321 Great Inventions, including items such as the airplane, internet, microchip, laser, cellphone, refrigerator, email, microwave, Personal Computer, LCD and LED technology, air conditioning, assembly line, supermarket, bar code, electric motor, ATM, and many more. Mass production is an American invention
Demographics
Population ( 2013 est. ) Population: 315, 591, 000 (3 rd ) Density: 34. 2/km 2 or 88. 6/sq mi Urbanized population: 82% (the worldwide urban rate is 50. 5%) Population growth rate: 0. 75 % Birth rate: 14. 14 births/1, 000 population Death rate: 8. 26 deaths/1, 000 population 13% of the population was foreign-born in
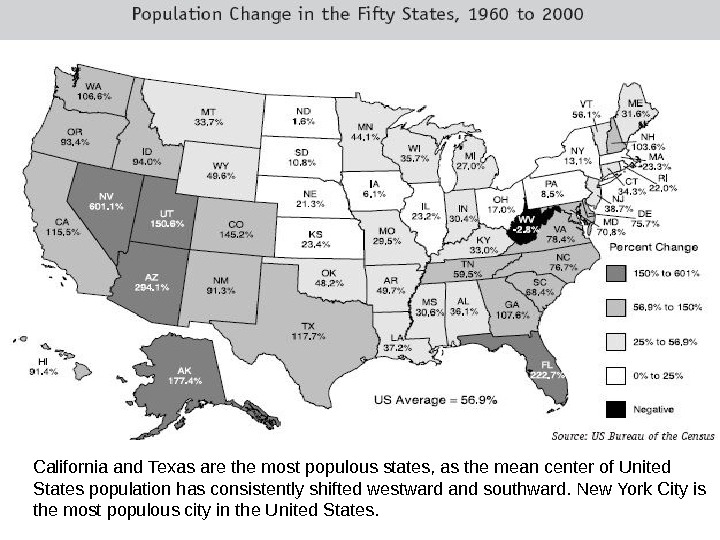
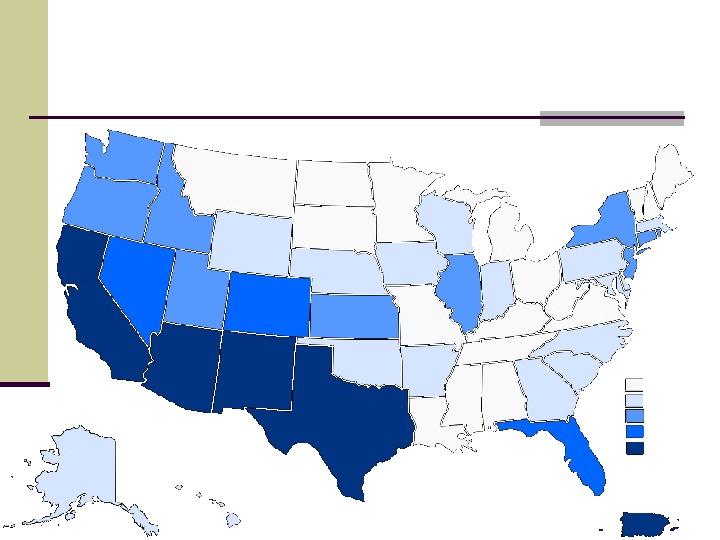
California and Texas are the most populous states, as the mean center of United States population has consistently shifted westward and southward. New York City is the most populous city in the United States.
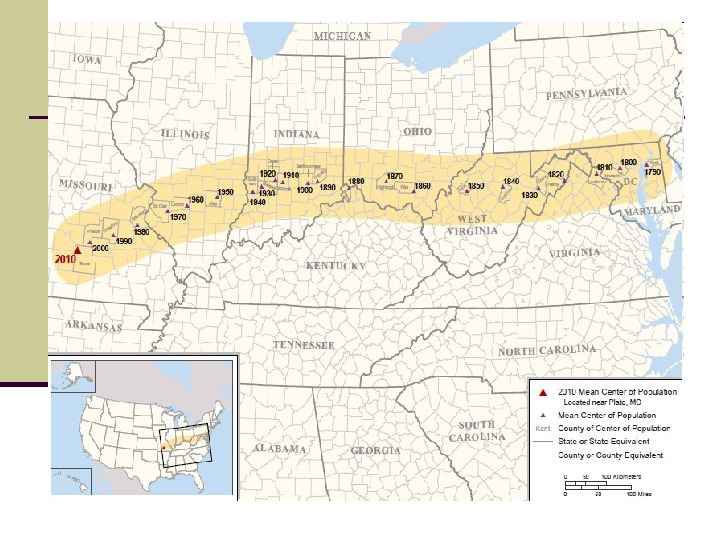
Population distribution The mean center of the U. S. population continues to drift farther west and south. The fastest growing region is the West, followed by the South. Between 1990 and 2000, 19 of the 20 fastest-growing states were in these two regions. Growth in some parts of the nation have been particularly extreme such as the fastest growing metropolitan area, Las Vegas, Nevada, which went from 273, 288 people in 1970 to about 1, 650, 671 in 2004.
Major population tendencies the mass immigration of Hispanics from Latin America into the Southwest , which is home to 60% (21 of the 35 million) of the nation’s Hispanics; the West Coast has been the residence of choice for immigrating Asians , particularly from the Philippines and China. The West Coast is now home to approximately half of all American citizens of Asian ancestry.
Tendencies and facts The American population more than tripled during the 20 th century—at a growth rate of about 1. 3% a year—from about 76 million in 1900 to 281 million in 2000. It reached the 200 million mark in 1967, and the 300 million mark on October 17, 2006. Currently, population growth is fastest among minorities as a whole, and according to the Census Bureau’s estimation for 2012, 50. 4% of American children under the age of 1 belonged to minority groups
Cities The United States has dozens of major cities, including 9 of the 66 «global cities» of all types, with 10 in the «alpha» group of global cities: New York City, Los Angeles, Chicago, Washington, DC, Boston, San Francisco, Miami, Atlanta, Dallas, and Philadelphia. As of 2011, the United States had 51 metropolitan areas with a population of over 1, 000 people each.
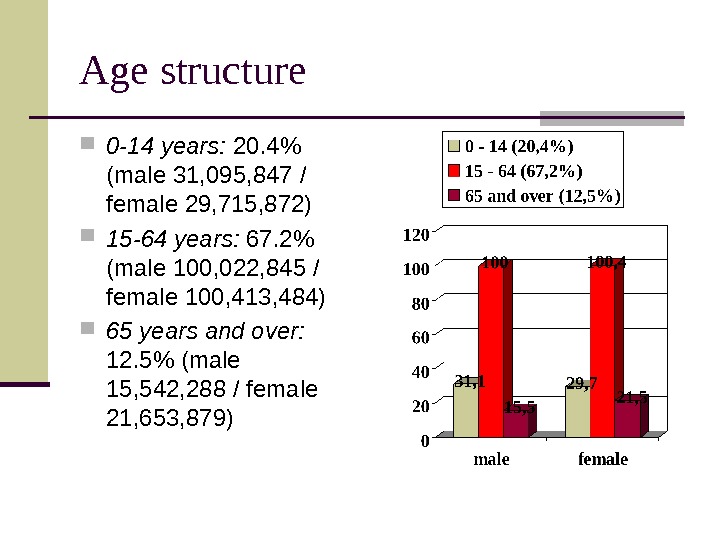
Age structure 0 -14 years: 20. 4% (male 31, 095, 847 / female 29, 715, 872) 15 -64 years: 67. 2% (male 100, 022, 845 / female 100, 413, 484) 65 years and over: 12. 5% (male 15, 542, 288 / female 21, 653, 879)
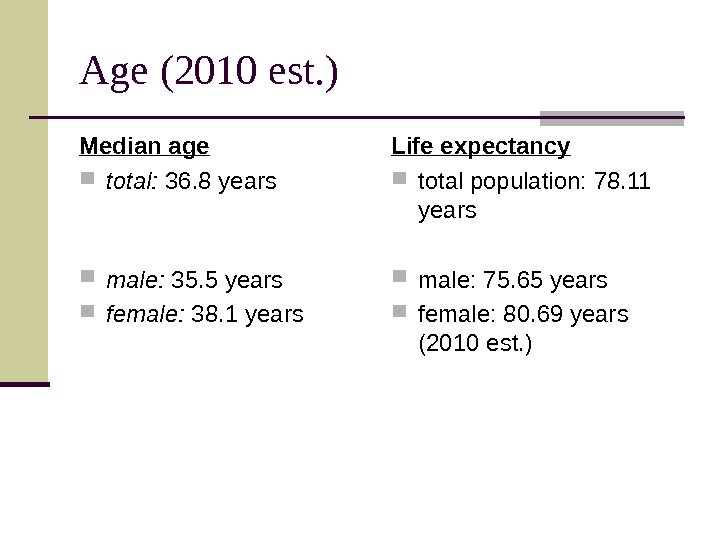
Age (20 10 est. ) Median age total: 36. 8 years male: 35. 5 years female: 3 8. 1 years Life expectancy total population: 78. 11 years male: 75. 65 years female: 80. 69 years (2010 est. )
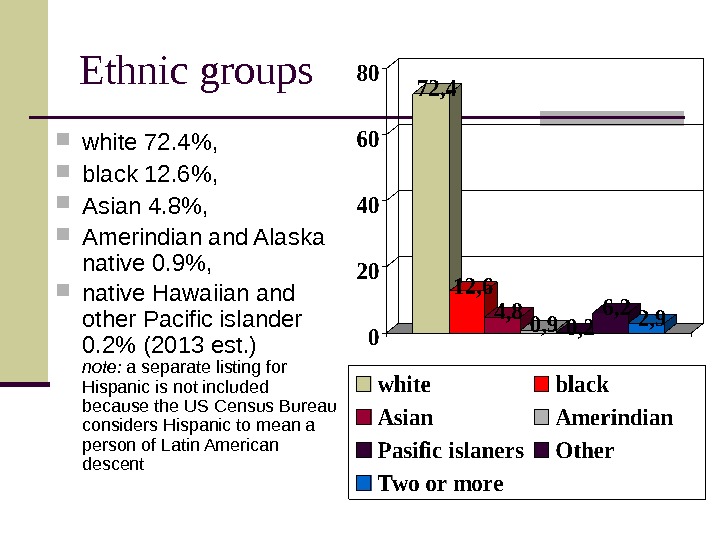
Ethnic groups white 72. 4 %, black 12. 6 %, Asian 4. 8 %, Amerindian and Alaska native 0. 9 %, native Hawaiian and other Pacific islander 0. 2% (20 1 3 est. ) note: a separate listing for Hispanic is not included because the US Census Bureau considers Hispanic to mean a person of Latin American descent
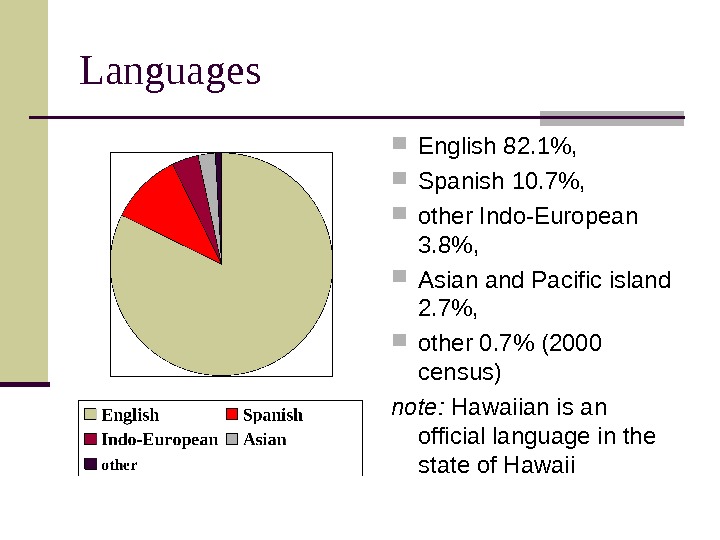
Languages English 82. 1%, Spanish 10. 7%, other Indo-European 3. 8%, Asian and Pacific island 2. 7%, other 0. 7% (2000 census) note: Hawaiian is an official language in the state of Hawaii
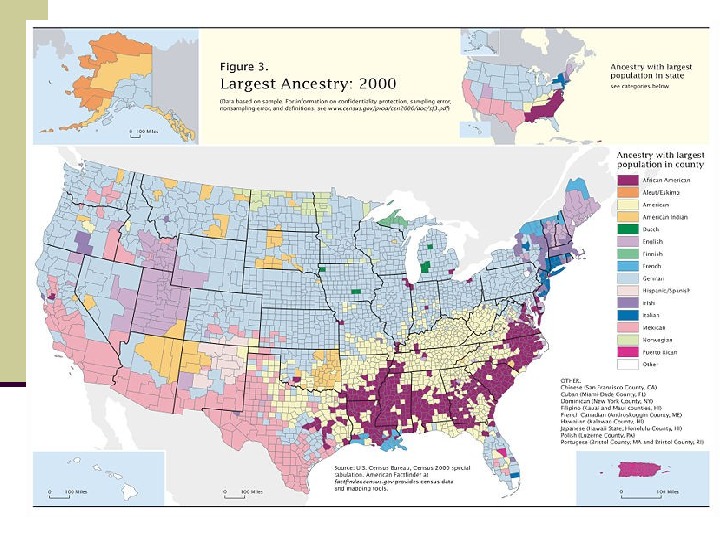
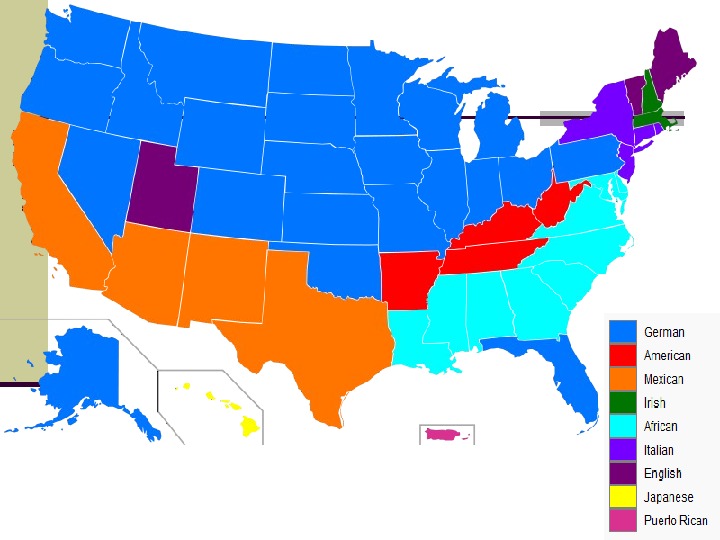
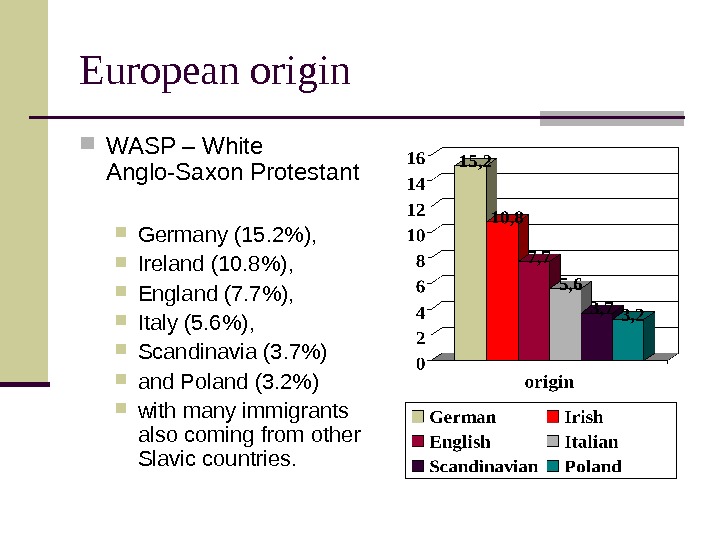
European origin WASP – White Anglo-Saxon Protestant Germany (15. 2%), Ireland (10. 8%), England (7. 7%), Italy (5. 6%), Scandinavia (3. 7%) and Poland (3. 2%) with many immigrants also coming from other Slavic countries.
Hispanics are second only to the German-American population in the single-race category. Hispanics comprise 10, 7% of the population (2003 census) which include people from South and Central America. People of Mexican descent made up 7. 3% of the population and about 66% of the Hispanic-American community. This proportion is expected to increase significantly in the coming decades.
African Americans or Blacks comprise 12, 9% (2009 census) of the American population. The initial wave of people from Africa arrived enslaved, particularly throughout the colonial period and infancy of the new nation (1690 -1808). Today, African Americans are spread throughout the country, but the population is largely concentrated in the Southern United States.
Asian Americans , including Native Hawaiians and Pacific Islanders, are a fourth significant minority (4, 2% of the population). Most Asian Americans are concentrated on the West Coast and Hawaii with a growing concentration in the New York City Metropolitan Area and Northern Virginia. The largest groups are immigrants or descendants of emigrants from the Philippines, China, India, Vietnam, South Korea, and Japan.
Indigenous peoples in the United States, such as American Indians and Inuit, make up 1% of the population (2003 census). About 35% live on Indian reservations.
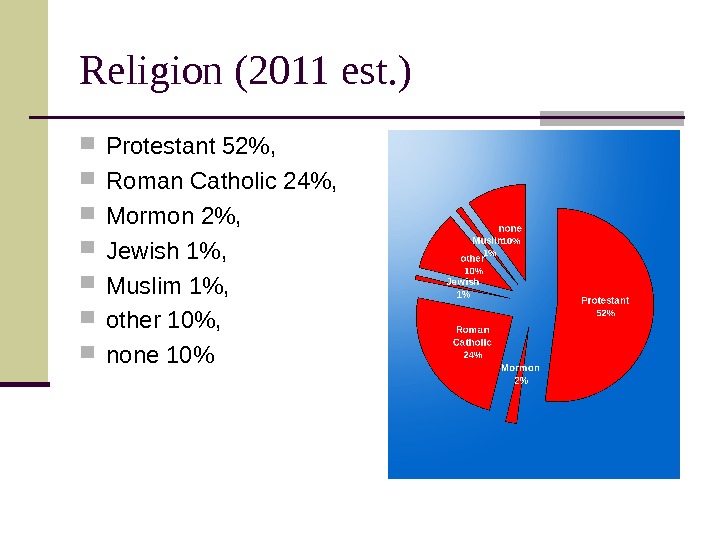
Religion (20 11 est. ) Protestant 52%, Roman Catholic 24%, Mormon 2%, Jewish 1%, Muslim 1%, other 10%, none 10%
Religion
Christian denominations Catholic, Baptist, Methodist, Lutheran, Presbyterian, Pentecostal (Charismatic or Evangelical), Episcopalian, Latter-Day Saints, Church of Christ, Congregational
Religiosity The United States is noteworthy among developed nations for its relatively high level of religiosity. According to a 2009 Gallup poll , about 44% of Americans attend religious services at least once a week. However, this rate is not uniform across the country; regular attendance is more common in the Bible Belt — composed of Southern and Midwestern.
Christian religions distribution In the Southern states, Baptists constitute the largest group, followed by Methodists. Roman Catholicism is predominant in the Northeast and in large parts of the Midwest due to these being settled by descendants of Catholic immigrants from Europe, such as Germany, Ireland, Italy, and Poland, or other parts of North America (mainly Quebec and Puerto Rico).
Mormons The Church of Jesus Christ of Latter-day Saints , whose members are commonly known as Mormons, is the predominant religion in the state of Utah , with significant populations in neighboring states, as well. The rest of the country generally has a mixture of various Christian denominations.
Thank you for attention!