

e307c6e80ebc42fdac4e9745ec5a27ed.ppt
- Количество слайдов: 54
 American Logistics Association Military Market Facts January 2012
 American Logistics Association A Brief Overview
 QMA was composed of") Our History n 1920 Incorporated as the Quartermaster’s Association (QMA) QMA was composed of officers of the Regular Army, the National Guard, the Organized Reserves, key civilians in the federal government and leaders of industry. QMA disseminated professional information concerning all Quartermaster and related activities, and fostered and promoted a spirit of cooperation and friendly exchange of ideas among the members. n 1961 QMA becomes the Defense Supply Association (DSA) The name was changed in response to the establishment of the Defense Supply Agency, as well as the increasing responsibilities being placed upon the U. S. Army Quartermaster Corps to provide food, clothing and general supplies to all the Armed Forces under Do. D’s single manager concept. The Association was composed of officers of the Armed Forces, key civilians in the federal government and leaders of industry. n 1972 DSA becomes the American Logistics Association (ALA) To eliminate confusion with the Defense Supply Agency, the Association changed its name to the American Logistics Association and adopted the “eagle in the oval” logo. The new ALA carried forward the same objectives of the Quartermaster and Defense Supply Associations. According to an editorial in the July/August 1972 issue of ALA’s Review Magazine, the new name “was chosen to “show clearly who we are, what we do and how we intend to function. ‘American’ must always exalt the pride of patriotism…we believe in our country, in its customs, in its ideas and in its business efforts. ‘Logistics’ is defined as that branch of the military art which embraces the details of transport and supply. ‘Association’ is a union; a connection of persons or things, or a union of persons in a company or society for some particular purpose. ”
Our History n 1920 Incorporated as the Quartermaster’s Association (QMA) QMA was composed of officers of the Regular Army, the National Guard, the Organized Reserves, key civilians in the federal government and leaders of industry. QMA disseminated professional information concerning all Quartermaster and related activities, and fostered and promoted a spirit of cooperation and friendly exchange of ideas among the members. n 1961 QMA becomes the Defense Supply Association (DSA) The name was changed in response to the establishment of the Defense Supply Agency, as well as the increasing responsibilities being placed upon the U. S. Army Quartermaster Corps to provide food, clothing and general supplies to all the Armed Forces under Do. D’s single manager concept. The Association was composed of officers of the Armed Forces, key civilians in the federal government and leaders of industry. n 1972 DSA becomes the American Logistics Association (ALA) To eliminate confusion with the Defense Supply Agency, the Association changed its name to the American Logistics Association and adopted the “eagle in the oval” logo. The new ALA carried forward the same objectives of the Quartermaster and Defense Supply Associations. According to an editorial in the July/August 1972 issue of ALA’s Review Magazine, the new name “was chosen to “show clearly who we are, what we do and how we intend to function. ‘American’ must always exalt the pride of patriotism…we believe in our country, in its customs, in its ideas and in its business efforts. ‘Logistics’ is defined as that branch of the military art which embraces the details of transport and supply. ‘Association’ is a union; a connection of persons or things, or a union of persons in a company or society for some particular purpose. ”
 Our History n 1974 ALA reorganizes into a national trade association Led by a Board of Directors comprised of representatives from industry, the newly organized association was designed to serve industry and its related interests in military and other government activities. 2005 The ALA Board of Directors revised the mission of ALA to include a focus on Total Quality of Life and MWR/Services. The American Logistics Association promotes, protects, and enhances the military resale and quality of life benefits on behalf of our members and the military community.
 Programs and Services n It is our goal to provide valuable programs and services that enable all members to operate effectively and efficiently with the military resale system and services. n ALA is the only organization that can give you the resources and the information you need to succeed. We strive to increase the visibility of the Association and enhance the services that ALA provides its members.
 Contact Information n American Logistics Association 1133 Fifteenth Street, N. W. Suite 640 Washington, DC 20005 (202) 466 -2520, Fax (202) 296 -4419 www. ala-national. org
 Military Resale Market FY 11 Total Sales: $20. 7 Billion Commissaries $ 5. 96 B Ships Afloat $ 78 M Exchanges $ 13. 965 B
 Military Patrons Active Duty Demographics
 Authorized Shoppers Total Shoppers Authorized 2012 12. 1 Million Source: AAFES Contingency Planning Offivce
 Active Duty Military Personnel Trend FY 2011 = 1. 46 Million
 Active Duty Demographics Male Female Age <22 202, 949 Officers 16. 4% Source: DMDC Updated Tri-anually 2011 14. 6% Enlisted 83. 5% 29% 17% 32 -36 13% 37 -49 85. 6% 22 -26 27 -31 1, 186, 525 23% 17% 50+ . 01%
 Army and Air") Military Resale Agencies • • • Defense Commissary Agency (De. CA) Army and Air Force Exchange Service (AAFES) Navy Exchange Service Command (NEXCOM) Marine Corps Exchange (MCX) Coast Guard Exchange Systems (CGES) Veterans Canteen Service (VCS)
Military Resale Agencies • • • Defense Commissary Agency (De. CA) Army and Air Force Exchange Service (AAFES) Navy Exchange Service Command (NEXCOM) Marine Corps Exchange (MCX) Coast Guard Exchange Systems (CGES) Veterans Canteen Service (VCS)
 Defense Commissa ry Agency
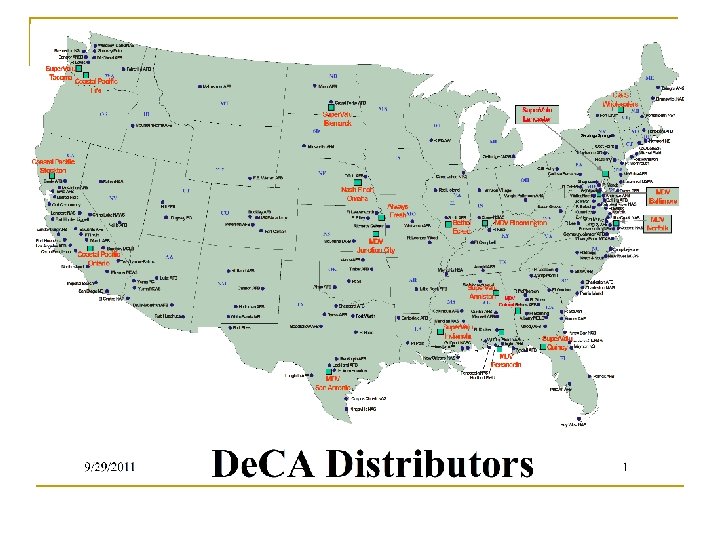
 De. CA Profile Established: 1991 Employees: Approximately 17, 000 Headquarters: 1300 E Avenue Fort Lee, VA 23801 -1800 Phone: (804) 734 -8253 Web site: www. commissaries. com Major Distribution Facilities: - CONUS Civilian Distributor Network - Overseas De. CA Central Distribution Centers FY 2011 Sales: $5. 96 Billion Director/CEO: Joseph Jeu, SES Deputy Director/COO: Vacant Selected Operations and Services: Grocery; Freeze; Chill; Produce Meat; Dairy Deli/Bakery
 Senior Enlisted Advisor Director / Chief Executive Officer General Counsel Inspector General/Security Deputy / Chief Operating Officer Internal Audit Washington Office EEO Executive Services Division Executive Director Store Operations CONUS and OCONUS Stores Store Support Executive Director Sales, Marketing & Policy Executive Director Logistics and Engineering Operations & Policy Engineering Requirements and Strategic Integration Sales Acquisition Management Corporate Communications Health & Safety Logistics Resale Contracting Yellow blocks - ALL assets geographically dispersed Green blocks - assets located at Ft Lee & geographically dispersed Corporate Planning Resource Management CDC and CMPP Blue blocks - ALL assets at Fort Lee Executive Director Business Enterprise Human Resources Information Technology
 Mission Statement n Deliver the Premier Quality of Life Benefit to the Armed Services Community - To enhance recruiting, retention and readiness by efficiently and effectively providing exceptional savings and excellent products and superior services EVERYTIME, EVERYPLACE.
 De. CA Facts n n n n Annual operating Budget- Congressionally Funded Headquarters- Fort Lee, Virginia FY 2011 Sales- $5. 96 Billion 250 stores (182 in CONUS and 68 OCONUS) Merchandise sold at cost plus 1% to cover shrinkage, plus 5% surcharge applied at register Vendor Stocking-required for some categories Estimated that 45% of De. CA shoppers are retirees Commissaries recognized as the #1 non-pay benefit
 $6. 02 $5. 79 $5. 47 $5.") De. CA FY Sales Trends (In Billions) $6. 02 $5. 79 $5. 47 $5. 34 $5. 31 $5. 10 $4. 90 1992 1993 1994 1995 1996 1997 $5 1998 1999 2000 $5 $5. 98 $5. 84 $5. 96 $5. 65 $5. 80 $5. 24 $5. 37 $5. 42 $4. 97 $5. 04 2001 2002 2003 2004 2005 2006 2007 2008 2009 2010 2011
De. CA FY Sales Trends (In Billions) $6. 02 $5. 79 $5. 47 $5. 34 $5. 31 $5. 10 $4. 90 1992 1993 1994 1995 1996 1997 $5 1998 1999 2000 $5 $5. 98 $5. 84 $5. 96 $5. 65 $5. 80 $5. 24 $5. 37 $5. 42 $4. 97 $5. 04 2001 2002 2003 2004 2005 2006 2007 2008 2009 2010 2011
 1. Wal-Mart $154.") America’s Top Food Retailers Company Name Estimated Annual Sales (in billions) 1. Wal-Mart $154. 2 2. Kroger $62. 6 3. Safeway $35. 0 4. Supervalu $31. 4 5. Ahold, USA $24. 1 6. Publix $21. 6 7. Delhaize America $18. 8 8. H. E. Butt $11. 6 9. Great Atlantic & Pacific $9. 1 10. Meijer $8. 6 11. Winn-Dixie $8. 3 12. Whole Foods $7. 6 13. Trader Joe’s $6. 8 14. Target $6. 7 15. Defense Commissary Agency $5. 9 Source: Progressive Grocer Magazine, May 2010
America’s Top Food Retailers Company Name Estimated Annual Sales (in billions) 1. Wal-Mart $154. 2 2. Kroger $62. 6 3. Safeway $35. 0 4. Supervalu $31. 4 5. Ahold, USA $24. 1 6. Publix $21. 6 7. Delhaize America $18. 8 8. H. E. Butt $11. 6 9. Great Atlantic & Pacific $9. 1 10. Meijer $8. 6 11. Winn-Dixie $8. 3 12. Whole Foods $7. 6 13. Trader Joe’s $6. 8 14. Target $6. 7 15. Defense Commissary Agency $5. 9 Source: Progressive Grocer Magazine, May 2010
 Weekly Sales/Square Foot") Measure De. CA Actual* De. CA (Adjusted for De. CA Savings) Weekly Sales/Square Foot $17. 53 $25. 44 $11. 39 Average Customer Purchase $66. 54 $96. 58 $27. 61 Average Square Feet/Store 31, 764 46, 755 Sales $5. 037 B $7. 311 B $547. 1 B Supermarket** * De. CA sales data based on U. S. only stores over $2 million (174 Commissaries) so as to compare with industry ** Supermarket data from Food Marketing Institute (FMI) Web site www. fmi. org (Supermarket Facts - Figures - Industry Overview) De. CA Compares Well with Leading Supermarket Chains! 20 20
Measure De. CA Actual* De. CA (Adjusted for De. CA Savings) Weekly Sales/Square Foot $17. 53 $25. 44 $11. 39 Average Customer Purchase $66. 54 $96. 58 $27. 61 Average Square Feet/Store 31, 764 46, 755 Sales $5. 037 B $7. 311 B $547. 1 B Supermarket** * De. CA sales data based on U. S. only stores over $2 million (174 Commissaries) so as to compare with industry ** Supermarket data from Food Marketing Institute (FMI) Web site www. fmi. org (Supermarket Facts - Figures - Industry Overview) De. CA Compares Well with Leading Supermarket Chains! 20 20
 De. CA Sales Information Store Rank Sales 2011 Transactions #1 Fort Belvoir, VA $98, 814, 672 1, 076, 586 #5 Fort Meade, MD $73, 233, 845 1, 014, 392 #10 Langley AFB, VA $65, 962, 285 968, 339 #25 Travis AFB, CA $55, 718, 562 871, 353 #50 Kaneohe Bay, HI $39, 914, 436 665, 880 #100 Memphis NSA, TN $23, 662, 682 336, 566 Source: De. CA EOY FY 11 Sales Report
 + 5% (surcharge) n n") De. CA Prices All Merchandise at Cost +1% (shrinkage) + 5% (surcharge) n n n No Slotting fees or co-op advertising 100% of all deal money is passed to the patron 1% added at shelf & 5% is added at the register An ideal test market scenario since the effect of trade funds can truly be monitored
De. CA Prices All Merchandise at Cost +1% (shrinkage) + 5% (surcharge) n n n No Slotting fees or co-op advertising 100% of all deal money is passed to the patron 1% added at shelf & 5% is added at the register An ideal test market scenario since the effect of trade funds can truly be monitored
 Distance Deters Commissary Store Visits n n The average Commissary is 2. 5 times as far from home as the local grocery store However, by a 2 to 1 margin, patrons are willing to put up with inconveniences to save 30% on their grocery bill
 Coupons, SNAP and WIC Historical Comparisons COUPONS FY 2006 FY 2007 FY 2008 FY 2009 FY 2010 FY 2011 FY 2012 Q 1 Coupon Dollars $93, 744, 094 $98, 835, 469 $94, 160, 582 $105, 198, 170 $114, 122, 168 $112, 703, 419 $29, 018, 093 Coupon Quantity 127, 630, 435 126, 484, 119 116, 944, 671 123, 931, 649 129, 353, 453 123, 027, 684 32, 313, 836 $0. 73 $0. 78 $0. 81 $0. 85 $0. 88 $0. 92 $0. 90 % Change in Coupon $ vs. Prior FY 5% -5% 12% 8% -1% % Change in Coupon # vs. Prior FY -1% -8% 6% 4% -5% -3% % Change in $ per Coupon in Prior FY 6% 3% 5% 4% 4% 2% FY 2006 FY 2007 FY 2008 FY 2009 FY 2010 FY 2011 FY 2012 Q 1 $26, 225, 702 $24, 851, 516 $31, 146, 015 $52, 954, 938 $72, 831, 952 $87, 837, 643 $25, 184, 921 SNAP Transactions 272, 899 233, 876 282, 879 501, 477 717, 006 856, 330 243, 254 SNAP $ per Transaction $96. 10 $106. 26 $110. 10 $105. 60 $101. 58 $102. 57 $103. 53 % Change in SNAP Dollars vs. Prior FY -5% 25% 70% 38% 21% 15% % Change in SNAP Trans vs. Prior FY -14% 21% 77% 43% 19% 12% % Change in SNAP $/Trans vs. Pr FY 11% 4% -4% 1% 2% FY 2006 FY 2007 FY 2008 FY 2009 FY 2010 FY 2011 FY 2012 Q 1 WIC Dollars n/a $29, 266, 430 $31, 574, 375 $30, 209, 689 $29, 585, 040 $29, 878, 377 $8, 089, 543 WIC Transactions n/a 1, 719, 078 1, 653, 307 1, 651, 080 1, 779, 760 1, 754, 843 462, 870 WIC $ per Transaction n/a $17. 02 $19. 10 $18. 30 $16. 62 $17. 03 $17. 48 % Change in WIC Dollars vs. Prior FY 8% -4% -2% 1% 9% % Change in WIC Trans vs. Prior FY -4% 0% 8% -1% 3% % Change in WIC $/Trans vs. Prior FY 12% -4% -9% 2% 5% $ per Coupon SNAP Dollars WIC
 q") De. CA Business Drivers n Promotions via Display (Presented to De. CA Headquarters) q q q Manager Specials: Category leaders, high volume items, deep discounts, normally 7 days, mandated display, administered via automated VCM at Headquarters Power Buy Display: High volume items, excellent prices, mandated quantities and display Primary Display: Required displays (K 1 & K 2 display these to the maximum extent possible) Secondary Display: Optional displays (store discretion) One Time Buys/Shippers: Highly consumable, impulse items Continued…
De. CA Business Drivers n Promotions via Display (Presented to De. CA Headquarters) q q q Manager Specials: Category leaders, high volume items, deep discounts, normally 7 days, mandated display, administered via automated VCM at Headquarters Power Buy Display: High volume items, excellent prices, mandated quantities and display Primary Display: Required displays (K 1 & K 2 display these to the maximum extent possible) Secondary Display: Optional displays (store discretion) One Time Buys/Shippers: Highly consumable, impulse items Continued…
 De. CA Business Drivers n n n Case Lot Sales: Special events to sell patrons in case increments Dollar Days: Dollar price points and dollar multiples on brand name food items Coupons: On-shelf manufacturer coupons, FSI coupons & Internet coupons all accepted Demos: Very effective and cost efficient Advertising: Several effective Military specific vehicles available
 Military Exchange Market A Closer Look 50 States 2 U. S. Territories 30 Foreign Countries
 Exchange Sales Trends In Billions
 Exchanges AAFES, NEXCOM and Marine Corps Exchanges n Operate as Federal Instrumentalities - unique organizations within the Do. D n Self-funded, using few tax dollars n Exchanges pay their own operating costs from Revenues n Return earnings to Customers through payments to Morale, Welfare and Recreation Activities and investments in new, renovated exchange facilities Coast Guard Exchanges n An MWR activity; Coast Guard is part of the Department of Homeland Security Veterans Canteens n Operates under the authority of the Department of Veterans Affairs
 AAFES Profile Established: 1895 Employees: 43, 000 Headquarters: 3911 S. Walton Walker Blvd. Dallas, TX 75236 -1598 Phone: (214) 312 -2001 Web site: www. aafes. com Major Distribution Facilities: Forest Park, GA; Newport News, VA; French Camp, CA; Waco, TX; Giessen, Germany; Tokyo, Japan; Yakota, Japan; Inchon, Korea; Okinawa, Japan; Honolulu, Hawaii FY 2010 Sales: $8. 476 Billion Commander: Vacant COO: Mike Howard Selected Operations and Services: Retail Stores; On-line Shopping Concessions; Catalog Services Food Facilities; Gas and Auto Repair Military Clothing Stores; Movie Theaters Vending Centers, State Department Commissaries
 European Region Main Exchanges Pacific Region Main Exchanges England Italy Alaska") AAFES Regions (5) European Region Main Exchanges Pacific Region Main Exchanges England Italy Alaska Germany Greenland Eastern Region Main Exchanges Guam, Japan, S. Korea, Okinawa Hawaii Western Region Main Exchanges Central Region Main Exchanges Puerto Rico
AAFES Regions (5) European Region Main Exchanges Pacific Region Main Exchanges England Italy Alaska Germany Greenland Eastern Region Main Exchanges Guam, Japan, S. Korea, Okinawa Hawaii Western Region Main Exchanges Central Region Main Exchanges Puerto Rico
 NEXCOM Profile Established: 1946 Employees: 15, 000 Headquarters: 3280 Virginia Beach Blvd. Virginia Beach, VA 23452 Phone: (757) 463 -6200 Web site: www. navy-nex. com Major Distribution Facilities: Norfolk, VA; Chino, CA Pensacola, FL; Naples, Italy Honolulu, Hawaii; Yokosuka, Japan FY 2010 Sales: $2. 55 Billion CEO: Mr. Robert J. Bianchi COO: Michael Good, SES Selected Operations and Services: Retail Stores; Concessions Food Facilities; Gas and Auto Repair Authorized Uniform Stores Vending Centers; Ship Stores
 European District Northwest District Northeast District Capitol District Western District Tidewater") NEXCOM Districts (11) European District Northwest District Northeast District Capitol District Western District Tidewater District (HQ) Japan Guam Hawaii District Cuba Japan District Guam District Mid-South District Southeast District Puerto Rico
NEXCOM Districts (11) European District Northwest District Northeast District Capitol District Western District Tidewater District (HQ) Japan Guam Hawaii District Cuba Japan District Guam District Mid-South District Southeast District Puerto Rico
 Dillon (Acting) Employees: 3543 Headquarters: 3044") MCX Profile Established: 1897 Director: Mr. William (Bill) Dillon (Acting) Employees: 3543 Headquarters: 3044 Catlin Ave. Quantico, VA 23134 -5103 Phone: (703) 784 -3800 Web site: www. usmc-mccs. org Major Distribution Facilities: None FY 2010 Sales: $925. 3 Million Deputy Director Business Operations: Ms. Cindy Whitman Lacy Selected Operations and Services: Retail Stores; Concessions Vending Centers; Gas and Auto Repair Food and Hospitality Facilities MWR Programs Marine Corps Exchanges (MCX) are a part of the Marine Corps Community Services (MCCS) on the Marine Corps bases.
MCX Profile Established: 1897 Director: Mr. William (Bill) Dillon (Acting) Employees: 3543 Headquarters: 3044 Catlin Ave. Quantico, VA 23134 -5103 Phone: (703) 784 -3800 Web site: www. usmc-mccs. org Major Distribution Facilities: None FY 2010 Sales: $925. 3 Million Deputy Director Business Operations: Ms. Cindy Whitman Lacy Selected Operations and Services: Retail Stores; Concessions Vending Centers; Gas and Auto Repair Food and Hospitality Facilities MWR Programs Marine Corps Exchanges (MCX) are a part of the Marine Corps Community Services (MCCS) on the Marine Corps bases.
 Henderson Hall Quantico (MCX HQ) Camp Allen Barstow Twentynine Palms Camp") MCX Facilities (17) Henderson Hall Quantico (MCX HQ) Camp Allen Barstow Twentynine Palms Camp Pendleton Miramar & MCRD San Diego Yuma Beaufort Parris Island Albany Hawaii Japan Iwakuni Kaneohe Bay Cherry Point Camp Lejeune
MCX Facilities (17) Henderson Hall Quantico (MCX HQ) Camp Allen Barstow Twentynine Palms Camp Pendleton Miramar & MCRD San Diego Yuma Beaufort Parris Island Albany Hawaii Japan Iwakuni Kaneohe Bay Cherry Point Camp Lejeune
 CGES Profile Established: 1945 Commander: Employees: 1, 600 Captain Robert C. Mckenna Headquarters: Battlefield Technology Center 1 510 Independence Pkw. Ste 500 Chesapeake, VA 23320 Phone: (757) 8424901 Web site: www. uscg. mil/mwr 2009 MWR Revenue NAF $17. 8 M 2009 APF $8. 3 M Lodges 26 Food & Beverage 24 Golf Courses 2 Fitness Facilities 33 FY 2010 Sales: $147. 8 Million Chief Operating Officer: John Reiley Director of Merchandise Ms. Sara Mikus Selected Operations and Services: Retail Stores Gas Stations MWR Programs Food Operations (franchised) Vending Centers
 Kodiak CGES High-Volume Exchanges Port Ketchikan. Angeles North Coast, Cleveland Astoria Seattle South Portland North Bend New London Staten Cape Cod Island Humbolt Bay Petaluma Baltimore Alameda Yorktown Cape May Portsmouth Elizabeth City Charleston San Pedro Mobile (2) Honolulu Galveston New Orleans St. Petersburg Mayport Clearwater Miami Hawaii Puerto Rico Borinque San Juan
 VCS Profile n n Central Buying Office Core Customers: q q q n n Patients (including relatives and friends) Staff and Medical workers Volunteers Average Retail Store size: 1, 500 -1, 800 sq. ft. Approved items are placed in VCS’ Automated Merchandise Catalog (AMC). Items on AMC are available to each canteen for ordering merchandise.
 VCS Profile Established: 1946 Employees: 3, 100 Headquarters: #1 Jefferson Barracks Road Building #25 St. Louis, MO 63125 -4194 Phone: (314) 894 -1200 Web site: www. vcscanteen. com Major Distribution Facilities: None FY 2010 Sales: $219. 7 Million Director: MS. Marilyn Iverson, SES COO: Ray Tober, SES Chief Merchandising Offiver Mr. Carey Filer Selected Operations and Services: Retail Stores, Food Operations (Cafeterias) Personalized Services, Vending
 Exchanges - Main Stores CONUS AAFES OCONUS TOTAL 116 59 175 NEXCOM 73 32 105 MCX 15 3 18 VCS 172 2 174 CGES 63 5 68 Total 439 100 539 NOTE: Resale systems combined operate thousands of retail operations including Main Stores, Shoppettes, Troop Stores, Package Stores, Sport Shops, Lawn and Garden, Fast Food, Military Clothing Stores, Gas Stations, etc.
 Wal. Mart $408. 214. CVS $98.") Exchange Sales vs. America’s Top Retailers Sales (Billions) Wal. Mart $408. 214. CVS $98. 7 Costco $71. 4 Home Depot $66. 1 Target $65. 3 Walgreen $63. 3 Lowe’s $47. 2 Best Buy $45. 0 Sears $44. 04 Kohls $17. 1 U. S. Military Exchanges Source: NRF online 2009 $14. 04
Exchange Sales vs. America’s Top Retailers Sales (Billions) Wal. Mart $408. 214. CVS $98. 7 Costco $71. 4 Home Depot $66. 1 Target $65. 3 Walgreen $63. 3 Lowe’s $47. 2 Best Buy $45. 0 Sears $44. 04 Kohls $17. 1 U. S. Military Exchanges Source: NRF online 2009 $14. 04
 Exchange Resale Systems Business Drivers n n n Pricing equal to or lower than best customer Voluntary Price Reduction (VPR) Favorable payment terms Marketing funds for: üIn-store demos üPremiums, give-a-ways üTruckload and parking lot sales üContests, sweepstakes üClerk training üScholarships continued. . .
 Exchange Resale Systems Business Drivers n Advertising funds for: q Weekly tabloids, In-store flyers q Special programs n Prepaid freight Warehouse allowances Business Processes q Vendor Managed Inventory (VMI) q Pre-ticketing for certain kinds of merchandise n n
 Ship Stores Profile Established: 1909 Headquarters: 3280 Virginia Beach Blvd. Virginia Beach, VA 23452 Phone: (757) 463 -6200 Web site: www. navy-nex. com Major Distribution Facility: Yokosuka, Japan 158 Ships Globally FY 2010 Sales: $79. 2 Million Source CEO Robert J. Bianchi Vic President, Ship Stores Program: Charlie Vaughn Selected Operations and Services: Retail Stores; Vending Machines Laundries; Barber Shops
 What Makes Ship Stores Unique? n n n Investment in inventory is constrained q limited storage and display space Assortments reduced to best selling SKU’s Majority of sales occur while deployed Captive market when at sea Store hours restricted while in port or repair yards Requires 24 -72 hour turnaround for deliveries
 MWR/ Services MWR, GSA, Department of State
 MWR Operations Morale, Welfare and Recreation
 MWR is a term given to a complete range of community support, quality of life programs, services, and activities that are provided to members of the Armed Forces and their families on military installations throughout the world.
 Operations n n n Each of the military services operates MWR activities Each military service has its own MWR organization, and while they manage similar activities, each does so in its own manner within the broad policy mandates of Do. D Operations are generally decentralized, but there is growing trend toward regional operations in Army & Navy.
 Program Funding n n MWR operations are funded with a combination of tax payer funds (appropriated) and self generated funds (non-appropriated) referred to as “APF” and “NAF” respectively NAF is generated through the sale of goods and services by both MWR operations and the Exchanges (dividends)
 Programs Categories “A” Title Mission Essential Funds 100% APF Program Examples Fitness Center, Intramural Sports, Libraries, Rec. Centers “B” Community Support 35% NAF 65% APF Youth Program, Child Dev. Center Outdoor Rec. , Rec. Pool “C” Business Operations 100% NAF* Category may determine type of contracting procedures utilized q APF: Defense Federal Acquisition Regulations Supplemental q NAF: Do. D and Service Specific Regulations ** n Do. D Directive 4105. 67 n Do. D Instruction 4105. 71 Source: DMDC Clubs, Golf, Bowling, Retail Stores, Snack Bars Restaurants, Lodging, Marinas *With some limited exceptions ** www. defenselink. mil
 MWR’s Most Frequented Facilities Air Force Army Fitness Facilities Libraries Outdoor Rec. Clubs and Entertainment Fitness Facilities Gyms/fields Bowling Libraries ITT Navy Marines Fitness Facilities ITT Fast Food Venues Outdoor Rec. Gyms
 The Military Market Facts Presentation has been brought to you by the American Logistics Association. Advocates for Military Total Quality of Life www. ala-national. org