
Alexandrina Yurjevna Skorokhod associate professor Chair — Corporate


futures_markets_forward_contracts_2.ppt
- Размер: 746.5 Кб
- Количество слайдов: 40
Описание презентации Alexandrina Yurjevna Skorokhod associate professor Chair — Corporate по слайдам
Alexandrina Yurjevna Skorokhod associate professor Chair — Corporate finance and estimation of business a. skor 1@yandex. ru FUTURES MARKETS DERIVATIVES OPTIONS
TYPES OF ORDERS IN FUTURES MARKETS Market Orders : Execute at best available price Limit Orders : Sell above or buy below stated limits Stop-Loss Orders : Sell if price falls below a limit; buy if it rises above a limit. Used to limit losses on existing positions Day Orders: An order to buy or sell stock that automatically expires if it can’t be executed on the day. Participants : Brokers, Floor Traders, Hedgers and speculators.
Exchange Futures Quotations Prices Opening price Highest price Lowest price Settlement price Open Interest Volume of trading
Trading results: 01. 03. 2015 – 10. 03. 2015. Brent Futures contract. Moscow Exchange. Settle. WA Open High Low Close Change Volume of last trade/ contr. Number of Trades Volume of trading Rub. Contracts Open interest Rub. Contracts • Sometimes Volume of trading in a day is greater than the Open interest at the end of the day. This is the indicative of a large number of day traders. • The opening price – prices at which contracts were trading immediately after the opening bell. • During the day, the price traded between $60. 37 and $56. 76. • Settlement price: A price established at the close of a trading day used to calculate the settlement of futures contracts. Contract size: 10 barrels Tick size: USc. 0. 01 Expiry date: 17. 03. 2015 EXPIRY DATE: 2 BUSINESS DAYS BEFORE THE LAST WORKING DAY OF THE CONTRACT MONTH
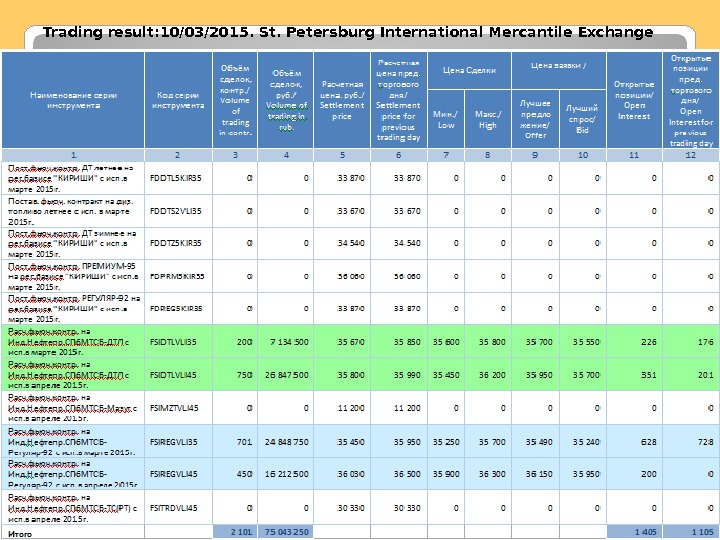
Trading result: 10/03/2015. St. Petersburg International Mercantile Exchange
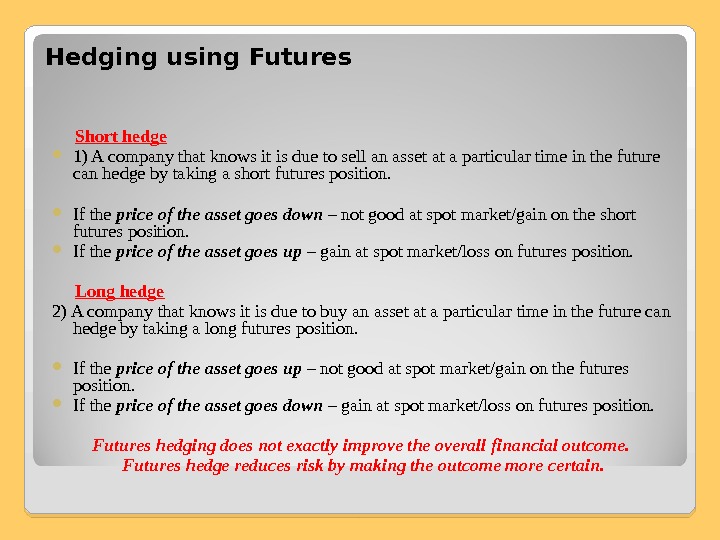
Hedging using Futures Short hedge 1) A company that knows it is due to sell an asset at a particular time in the future can hedge by taking a short futures position. If the price of the asset goes down – not good at spot market/gain on the short futures position. If the price of the asset goes up – gain at spot market/loss on futures position. Long hedge 2) A company that knows it is due to buy an asset at a particular time in the future can hedge by taking a long futures position. If the price of the asset goes up – not good at spot market/gain on the futures position. If the price of the asset goes down – gain at spot market/loss on futures position. Futures hedging does not exactly improve the overall financial outcome. Futures hedge reduces risk by making the outcome more certain.
Reasons why hedging using futures works not perfectly in practice: 1. The asset whose price is to be hedged may not be exactly the same as the asset underlying the futures contract. 2. The hedger may be uncertain as to the exact date when the asset will be bought of sold. 3. The hedge may require the futures contract to be closed out well before its expiration date. These problems give rise to what is termed basis risk.
FUTURES PRICES, SPOT PRICES AND EXPECTED SPOT PRICES Basis = (Spot Price – Futures Price) • If the asset to be hedged and the asset underlying the FC are the same the basis should be zero at the expiration of FC. • The basis may be positive and negative. • When the SP increases by more than FP, the Basis increases = Strengthening of the basis. • When the FP increases by more than SP, the Basis declines = Weakening of the basis. Basis risk can lead to an improvement or a worsening of a hedger’s position. Short hedge: • If the basis strengthens unexpectedly, the hedgers position improves. • If the basis weakens unexpectedly, the hedgers position worsens. Long hedge: reverse. Basis at time t 1 and t 2: The effective price that is paid with hedging:
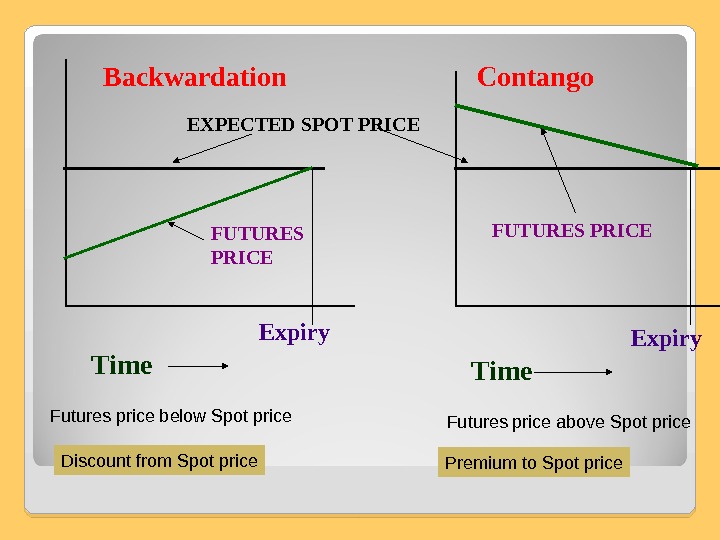
Backwardation Contango FUTURES PRICEEXPECTED SPOT PRICE FUTURES PRICE Time Expiry Time Futures price below Spot price Futures price above Spot price Premium to Spot price. Discount from Spot price
Choice of Contract The choice has two components : 1. The choice of the asset underlying the futures contract. If the asset being hedged exactly matches an asset underlying a futures contract If not – make analysis to determine which of the available futures contracts has futures prices that are most closely correlated with the price of the asset being hedged. 2. The choice of the delivery month. To choose a delivery month that is as close as possible to (but later than) the expiration of the hedge.
Example 1 It is March 1 US Company expects to receive 50 million Japanese yen at the end of July. Yen FC have delivery months of March, June, September, December Contract size: 12. 5 million yen The Company shorts four September yen FC on March 1 At the end of July when the yen are received, the Company closes out its position Futures price on March 1 is 0. 78 cents per yen End of July: Spot price is 0. 72, Futures price is 0. 725 Define: 1. Financial result if the Company does not short FC. 2. Financial result if the Company shorts four FC (Effective price in cents per yen; Total amount received for the 50 million yen).
Example 1 1. The gain on the FC is 0. 78 -0. 725 = 0. 055 cents per yen. 2. The basis is 0. 72 -0. 725 = -0. 005 cents per yen when the contract is closed out. (b 2 = S 2 – F 2) 3. The Effective price obtained in cents per yen is the final spot price plus the gain on the futures: 0. 72+0. 055 = 0. 775 4. This can also be written as the initial futures price plus the final basis: 0. 78 -0. 005 = 0. 775 (F 1 + b 2) 5. Total amount received be the Company for the 50 million yen is 50*0. 00775 million dollars = $387 500 6. Financial result if the Company does not short FC is 50*0. 0072 = $
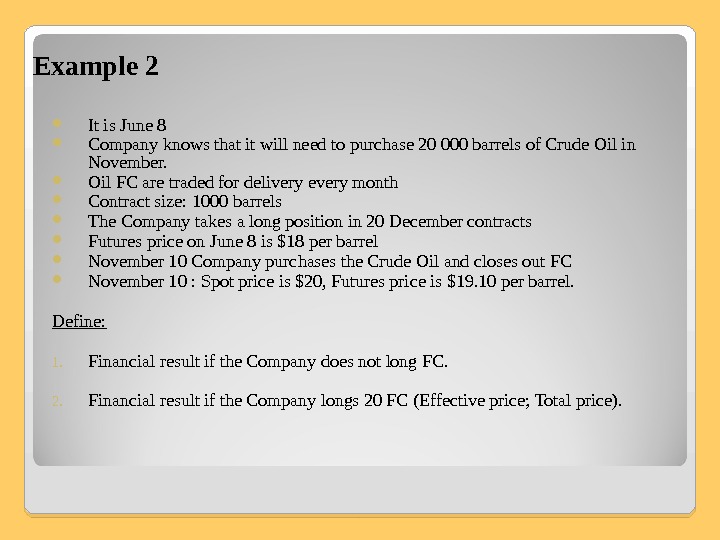
Example 2 It is June 8 Company knows that it will need to purchase 20 000 barrels of Crude Oil in November. Oil FC are traded for delivery every month Contract size: 1000 barrels The Company takes a long position in 20 December contracts Futures price on June 8 is $18 per barrel November 10 Company purchases the Crude Oil and closes out FC November 10 : Spot price is $20, Futures price is $19. 10 per barrel. Define: 1. Financial result if the Company does not long FC. 2. Financial result if the Company longs 20 FC (Effective price; Total price).
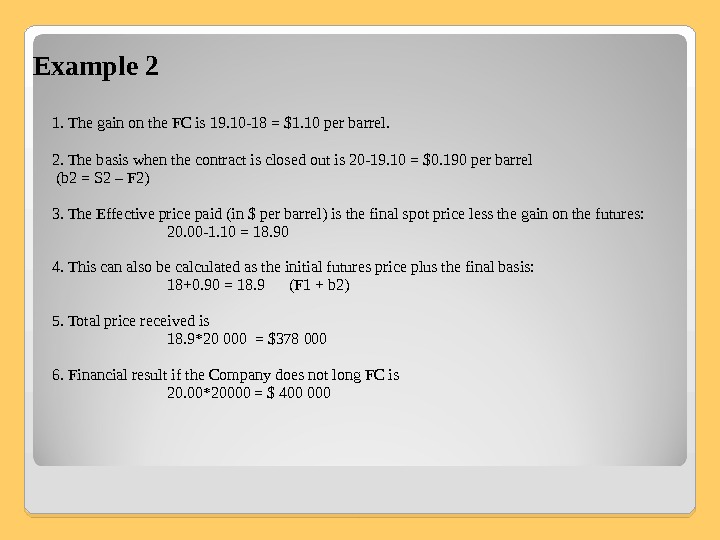
Example 2 1. The gain on the FC is 19. 10 -18 = $1. 10 per barrel. 2. The basis when the contract is closed out is 20 -19. 10 = $0. 190 per barrel (b 2 = S 2 – F 2) 3. The Effective price paid (in $ per barrel) is the final spot price less the gain on the futures: 20. 00 -1. 10 = 18. 90 4. This can also be calculated as the initial futures price plus the final basis: 18+0. 90 = 18. 9 (F 1 + b 2) 5. Total price received is 18. 9*20 000 = $378 000 6. Financial result if the Company does not long FC is 20. 00*20000 = $
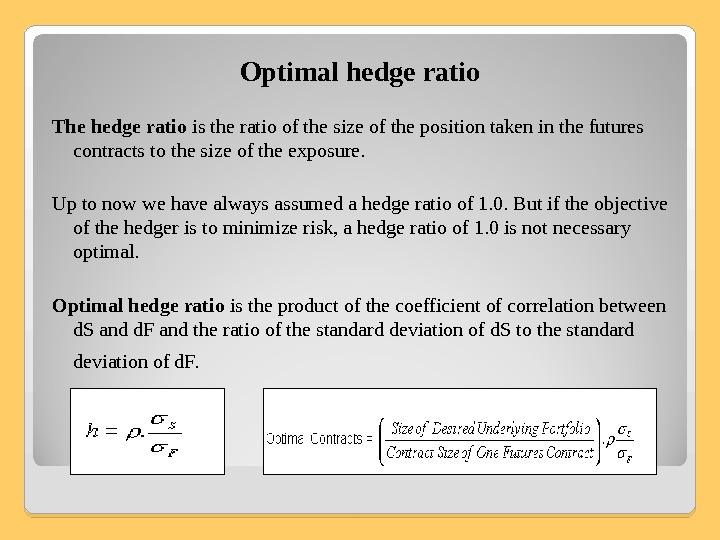
Optimal hedge ratio The hedge ratio is the ratio of the size of the position taken in the futures contracts to the size of the exposure. Up to now we have always assumed a hedge ratio of 1. 0. But if the objective of the hedger is to minimize risk, a hedge ratio of 1. 0 is not necessary optimal. Optimal hedge ratio is the product of the coefficient of correlation between d. S and d. F and the ratio of the standard deviation of d. S to the standard deviation of d. F.
Volatility is a measure of uncertainty or ”riskiness” Value-at-Risk and option valuation Asset volatility communicates the probability and magnitude of potential price movements for that asset. The use of returns allows us to compare the changes in different markets A higher volatility reflects a broader range of prices and returns and indicates a greater risk. Volatility is calculated using returns and not prices
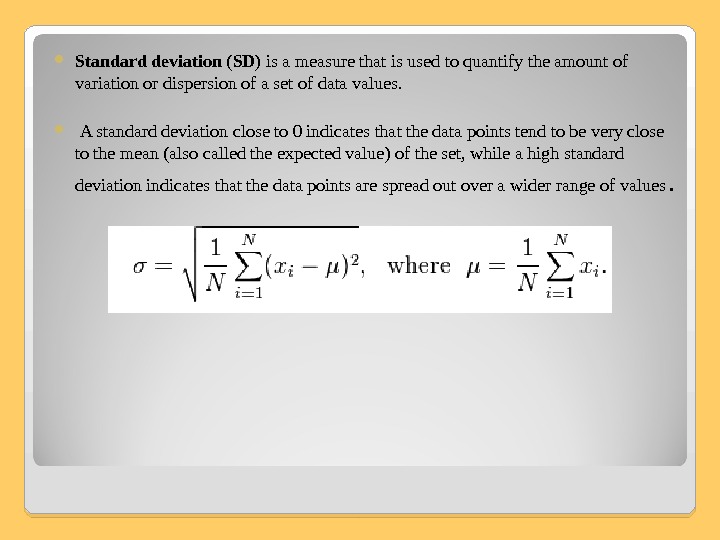
S tandard deviation ( SD ) is a measure that is used to quantify the amount of variation or dispersion of a set of data values. A standard deviation close to 0 indicates that the data points tend to be very close to the mean (also called the expected value) of the set, while a high standard deviation indicates that the data points are spread out over a wider range of values.
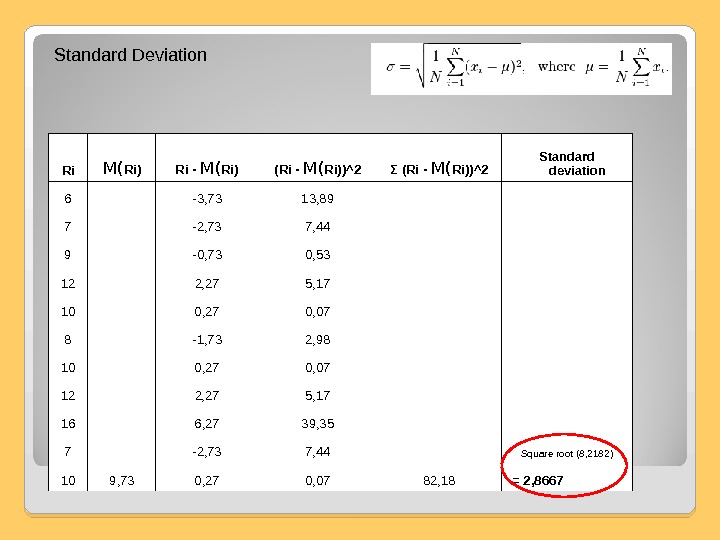
Ri M( Ri ) Ri — M( Ri ) (Ri — M( Ri ) )^2 Σ (Ri — M( Ri ) )^2 Standard deviation 6 -3, 73 13, 89 7 -2, 73 7, 44 9 -0, 73 0, 53 12 2, 27 5, 17 10 0, 27 0, 07 8 -1, 73 2, 98 10 0, 27 0, 07 12 2, 27 5, 17 16 6, 27 39, 35 7 -2, 73 7, 44 Square root (8, 2182) 10 9, 73 0, 27 0, 07 82, 18 = 2, 8667 Standard Deviation
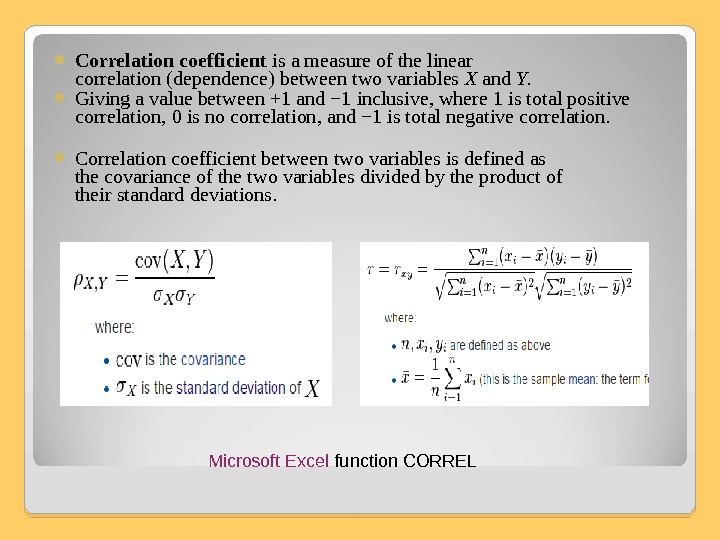
C orrelation coefficient is a measure of the linear correlation (dependence) between two variables X and Y. G iving a value between +1 and − 1 inclusive, where 1 is total positive correlation, 0 is no correlation, and − 1 is total negative correlation. C orrelation coefficient between two variables is defined as the covariance of the two variables divided by the product of their standard deviations. Microsoft Excel function CORREL
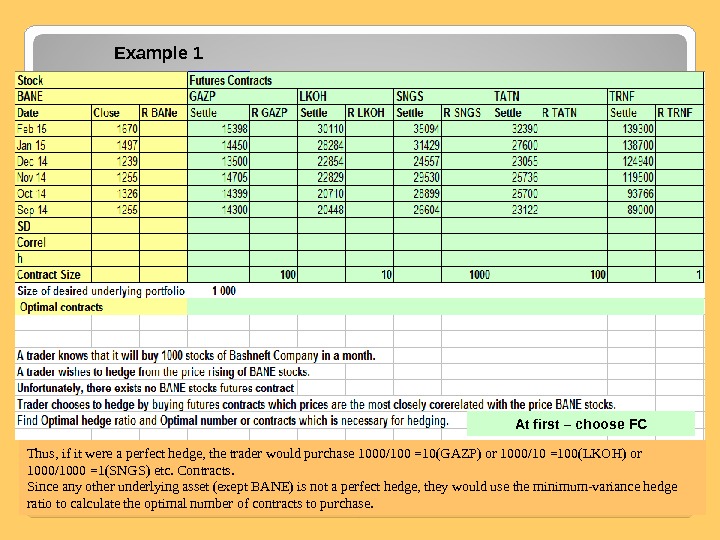
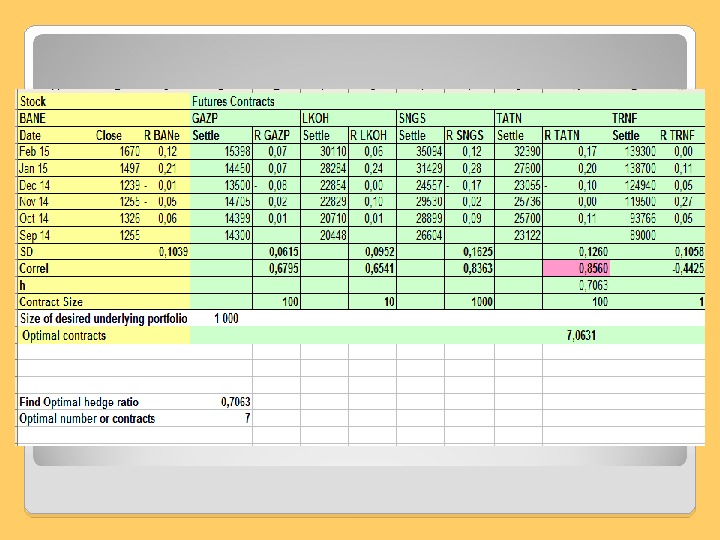
Example 1 Thus, if it were a perfect hedge, the trader would purchase 1000 / 100 =10(GAZP) or 1000/10 =100(LKOH) or 1000/1000 =1(SNGS) etc. Contracts. Since any other underlying asset (exept BANE) is not a perfect hedge, they would use the minimum-variance hedge ratio to calculate the optimal number of contracts to purchase. At first – choose
TYPES OF TRADERS Hedgers Speculators Arbitrageurs use derivatives to bet on the future direction of the market variable. take offsetting position in two or more instruments to lock in a profit. use derivatives to reduce the risk that they face from potential future movements in the variable market.
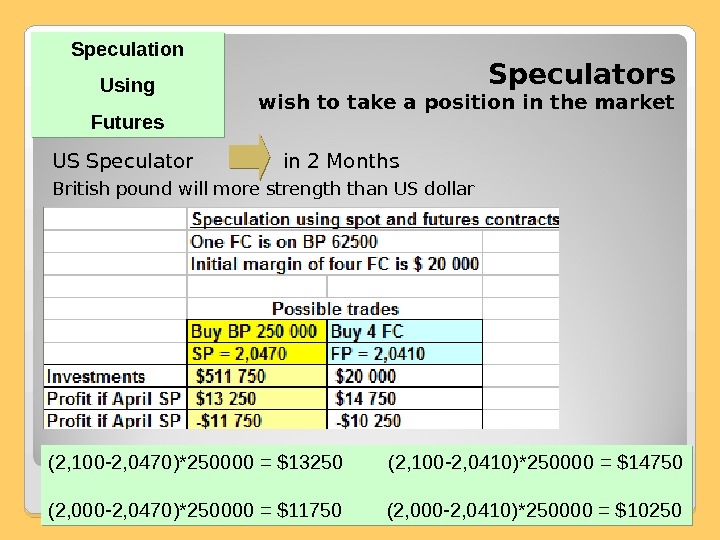
Speculators wish to take a position in the market US Speculator in 2 Months British pound will more strength than US dollar Speculation Using Futures (2, 100 -2, 0470)*250000 = $13250 (2, 100 -2, 0410)*250000 = $14750 (2, 000 -2, 0470)*250000 = $11750 (2, 000 -2, 0410)*250000 = $
The difference between two alternatives 1) Up-front investment = $511750 (250000*2, 0470) 2) Small amount to be deposited — $5000 per contract, $20000 in total The Futures Market allows the Speculator to obtain leverage. With a relatively small initial outlay, the investors able to take a large speculative position
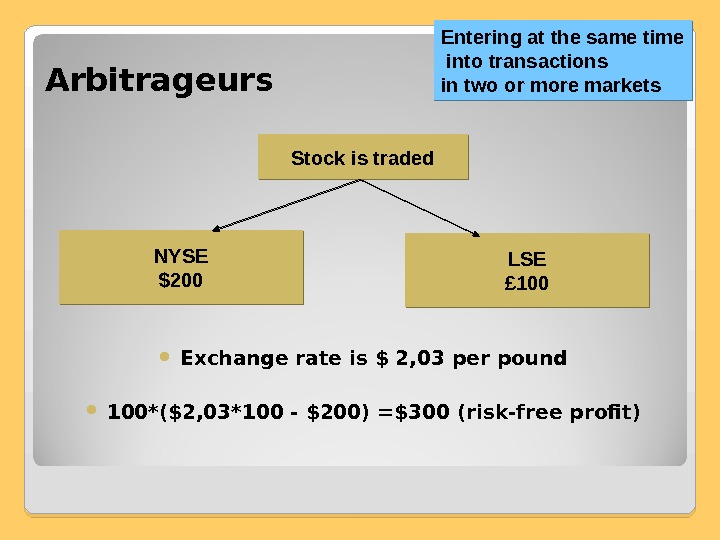
Arbitrageurs Exchange rate is $ 2, 03 per pound 100*($2, 03*100 — $200) =$300 (risk-free profit) Stock is traded NYSE $200 LSE £ 100 Entering at the same time into transactions in two or more markets
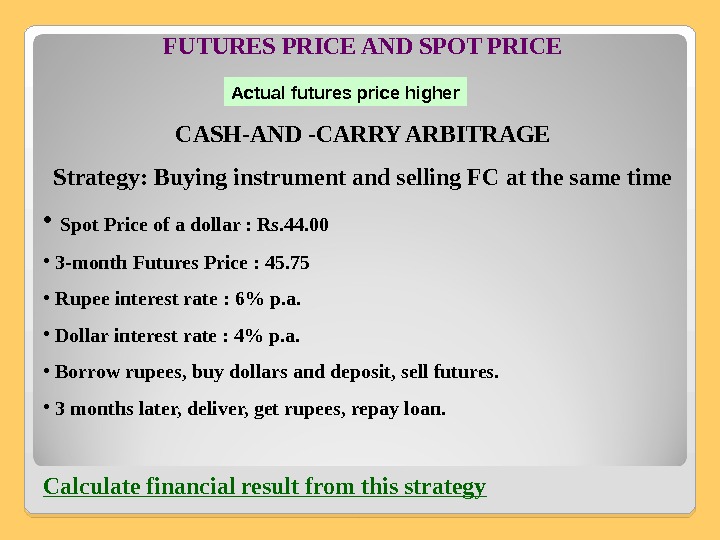
FUTURES PRICE AND SPOT PRICE CASH-AND -CARRY ARBITRAGE Strategy: Buying instrument and selling FC at the same time • Spot Price of a dollar : Rs. 44. 00 • 3 -month Futures Price : 45. 75 • Rupee interest rate : 6% p. a. • Dollar interest rate : 4% p. a. • Borrow rupees, buy dollars and deposit, sell futures. • 3 months later, deliver, get rupees, repay loan. Calculate financial result from this strategy Actual futures price higher
CASH-AND -CARRY ARBITRAGE Results 1. Borrow 44000 Rp in 3 month we must pay 44000*1. 015 = 44660 Rp 2. Buy $ 440000 / 44 = $1000 3. Deposit $ 1000*1. 01 = $1010 4. Sell FC In 3 months: 5. Deliver $1000. Get 46207. 5 Rp 6. Repay loan — 44600 Rp 7. Result: Net Profit of 1547. 5 Rp (46207. 5 -44600)
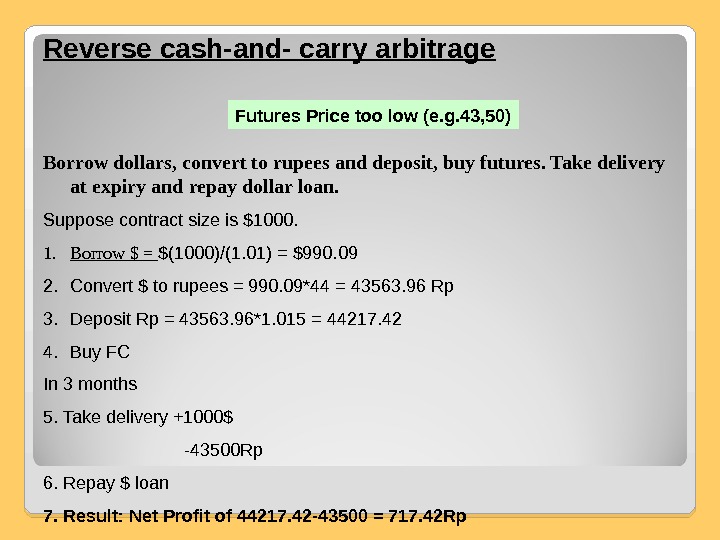
Reverse cash-and- carry arbitrage Borrow dollars, convert to rupees and deposit, buy futures. Take delivery at expiry and repay dollar loan. Suppose contract size is $1000. 1. Borrow $ = $(1000)/(1. 01) = $990. 09 2. Convert $ to rupees = 990. 09*44 = 43563. 96 Rp 3. Deposit Rp = 43563. 96*1. 015 = 44217. 42 4. Buy FC In 3 months 5. Take delivery +1000$ -43500 Rp 6. Repay $ loan 7. Result: Net Profit of 44217. 42 -43500 = 717. 42 Rp Futures Price too low (e. g. 43, 50)
Arbitrage and Theoretical Futures Price Let C denote the present value of carrying costs, S t the spot price, r the interest rate, and FU t, T the futures price for delivery at T, Then theoretical futures price is given by FU t, T = (S t + C)[1 + r(T-t)] Actual futures price higher : cash-and-carry arbitrage Actual futures price lower: reverse cash-and-carry arbitrage For currency futures, futures prices are almost identical to forward prices. A similar relation will hold between FU t, T 1 and Fu t, T 2>T 1>t
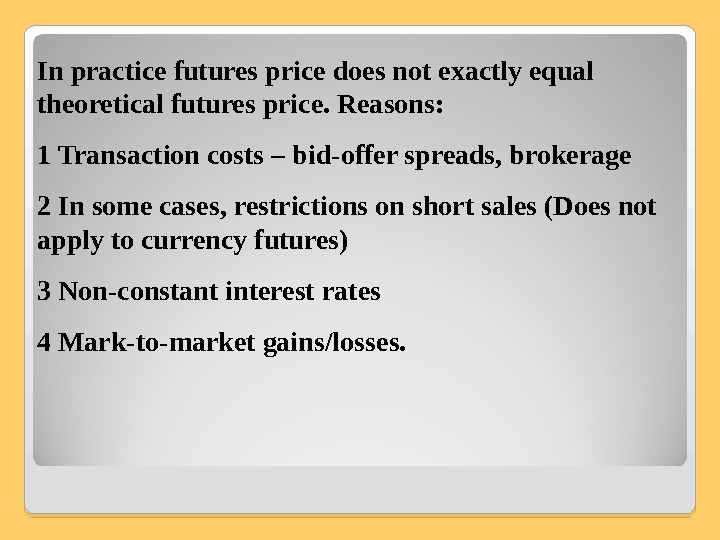
In practice futures price does not exactly equal theoretical futures price. Reasons: 1 Transaction costs – bid-offer spreads, brokerage 2 In some cases, restrictions on short sales (Does not apply to currency futures) 3 Non-constant interest rates 4 Mark-to-market gains/losses.
FUTURES PRICES AND FORWARD PRICES • DETERMINISTIC INTEREST RATES: FUTURES PRICES EQUAL FORWARD PRICES • STOCHASTIC INTEREST RATES : FUTURES PRICES DIFFER FROM SPOT PRICES DUE TO DAILY GAINS AND LOSSES • SPOT PRICE AND INTEREST RATE POSITIVELY CORRELATED : FUTURS PRICE EXCEEDS FORWARD PRICE • NEGATIVE CORRELATION: FUTURES PRICE LESS THAN FORWARD PRI
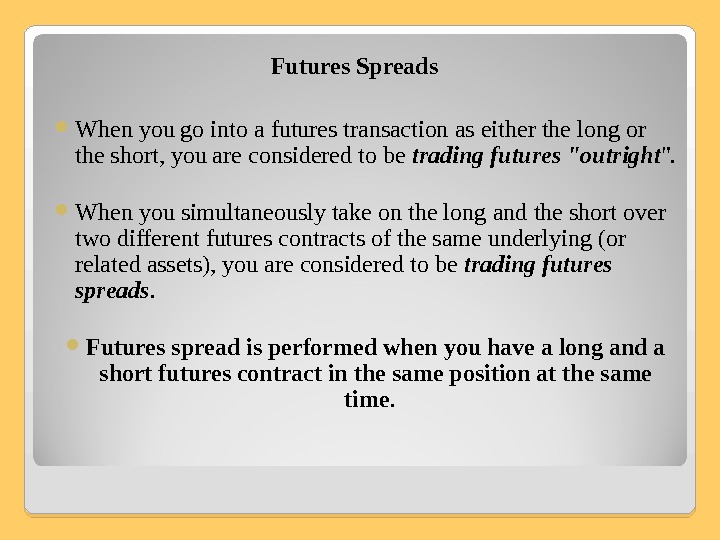
Futures Spreads When you go into a futures transaction as either the long or the short, you are considered to be trading futures «outright «. W hen you simultaneously take on the long and the short over two different futures contracts of the same underlying (or related assets), you are considered to be trading futures spreads. Futures spread is performed when you have a long and a short futures contract in the same position at the same time.
Why Use Futures Spreads? T wo main reasons : 1. Increase In Profit Avenues 2. Lowering of Margin Requirement and risk.
Increasing Avenues of Profit 1. When the long leg rises and short leg falls. 2. When the long leg rises and the short leg remained unchanged. 3. When the long leg rises and short leg rises at a lower rate. 4. When the short leg falls faster than the long leg. 5. When the long leg remains unchanged and short leg falls.
Lowering Margin and Risk F utures spreads are valued for their ability to limit risk. Futures spreads are really trading the difference in price (the «Spread») between the long and short legs and such price difference tends to trade within a determinable range. T his makes trading futures spreads a lot more predictable and subject the futures trader to much lower risk. As a rule, putting on a spread also decreases yourinitial marginrequirement.
Types of Futures Spreads 1. Intramarket Spreads ( «Calendar Spreads», «Intracommodity Spreads» or «Interdelivery Spreads“ ). F utures contracts of the same underlying but different expiration months. 2. Intermarket Spreads ( «Intercommodity Spread“ ) F utures contracts of different but somewhat related underlying assets. Gold/Silver, Soybean/Corn, Wheat/Corn, Soybean/Soybean Meal and Crude Oil/Heating Oil. 3. Interexchange Spreads F utures contracts of the same underlying traded in different exchanges.
Bull Spreads These are futures spreads that are structured to speculate on a spread price narrowing when the underlying asset is expected to move higher. This is done by being long on near term futures contracts and short on far term futures contracts. Bear Spreads These are futures spreads that are structured to speculate on a spread price widening when the underlying asset is expected to move lower. This is done by being short on near term futures contracts and long on far term futures contracts. Calendar Spreads These are any futures spreads that go long and short on futures contracts of different expiration months. In fact, both Bull Spreads and Bear Spreads are calendar spreads as well. Butterfly Spreads These are futures spreads that consist of three legs instead of the traditionally used two legged futures spreads. It is a combination of a bull spread and a bear spread on the same underlying asset.
Disadvantages of Futures Spreads More legs take up more commission Futures Spreads do not make the kind of explosive profit during a price breakout that outright futures positions can.