

370349e0d7fce380d15ae24d4caad9b9.ppt
- Количество слайдов: 41
 Air Pollution, Heat and Health in cities Klea Katsouyanni Department of Hygiene, Epidemiology and Medical Statistics, National and Kapodistrian University of Athens & King’s College London 20 -12 -2016
 attributable to risk factors 2010") Global Disability Adjusted Life Years (DALYs) attributable to risk factors 2010
Global Disability Adjusted Life Years (DALYs) attributable to risk factors 2010
 WHY CITIES? Ø Because more than 50% of the world population is already living in cities and megacities; projected to increase to 66% by 2050. Ø There is evidence that age-standardized life expectancy and other health outcomes present an adverse profile in urban compared to non-urban areas Ø There are well recognized environmental problems in cities such as air pollution, the urban heat island socioeconomic inequalities; all inter-related
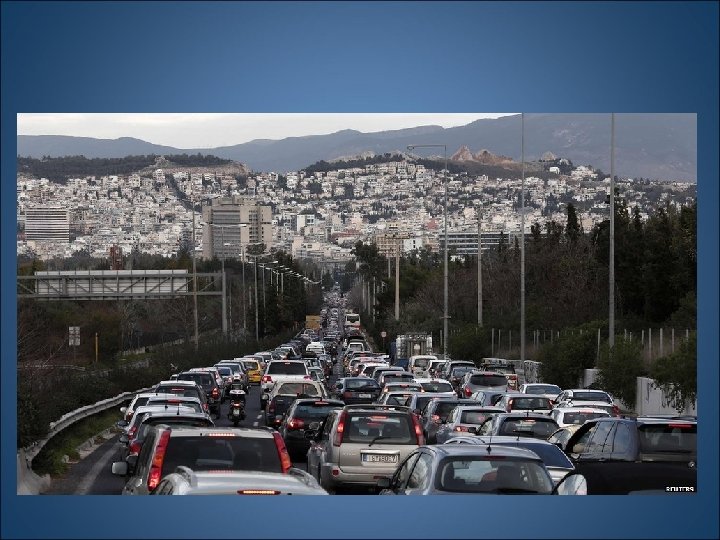
 Air pollution in cities….
 Beijing
") Indonesia (during a forest fire episode)
Indonesia (during a forest fire episode)
 Pollutant 1 hour or 8 hour 24 hour Annual") WHO Air Quality Guidelines (2005) Pollutant 1 hour or 8 hour 24 hour Annual ΡΜ 10 (μg/m 3) 50 20 ΡΜ 2. 5 (μg/m 3) 25 10 Όζον (μg/m 3) 100 ΝΟ 2 (μg/m 3) 200 SO 2 (μg/m 3) 40 20
WHO Air Quality Guidelines (2005) Pollutant 1 hour or 8 hour 24 hour Annual ΡΜ 10 (μg/m 3) 50 20 ΡΜ 2. 5 (μg/m 3) 25 10 Όζον (μg/m 3) 100 ΝΟ 2 (μg/m 3) 200 SO 2 (μg/m 3) 40 20
") A very large evidence data base exists for the health effects Particulate Matter (PM) Pollution Ø According to W. H. O. l l l In 382 European cities with ΡΜ 10 measurements , 34 had annual means > 40 μg/m 3. Among them 5 cities in Greece Other cities in Bulgaria, Cyprus, Israel, Italy, Spain, Bosnia , Poland, Romania, Serbia, and Turkey.
A very large evidence data base exists for the health effects Particulate Matter (PM) Pollution Ø According to W. H. O. l l l In 382 European cities with ΡΜ 10 measurements , 34 had annual means > 40 μg/m 3. Among them 5 cities in Greece Other cities in Bulgaria, Cyprus, Israel, Italy, Spain, Bosnia , Poland, Romania, Serbia, and Turkey.
 50μg/m 3") Legal limits for PM Ø Ε. U. PM 10 : 24 hour) 50μg/m 3 and annual 40μg/m 3. According to the Directive there is a possibility to discount particles from natural sources when assessing compliance Ø Ε. U. ΡΜ 2. 5 annual limit 20μg/m 3 Ø U. S. E. P. A. PM 10 (24 hour) 150μg/m 3. PM 2. 5 (24 hour) 35μg/m 3 and annual 12μg/m 3.
Legal limits for PM Ø Ε. U. PM 10 : 24 hour) 50μg/m 3 and annual 40μg/m 3. According to the Directive there is a possibility to discount particles from natural sources when assessing compliance Ø Ε. U. ΡΜ 2. 5 annual limit 20μg/m 3 Ø U. S. E. P. A. PM 10 (24 hour) 150μg/m 3. PM 2. 5 (24 hour) 35μg/m 3 and annual 12μg/m 3.
 We often think of the effects of air pollution on health in terms of SHORT and LONG-term effects
 Relative importance and overlap of effects from short- and long-term exposures FROM HIA SHOR T LONG SHO RT LONG
 Based on the U. S E. P. A. calculations
 Particles size and composition in Mediterranean countries geographical variability and short-term health effect MED-PARTICLES Project 2011 -2013 Under the Grant Agreement EU LIFE+ ENV/IT/327 MED PARTICLES: Short-term effects of fine and coarse particles on mortality and morbidity in 4 Mediterranean countries. Funded by LIFE+ Programme, DG Environment Coordinated by Francesco Forastiere, Department of Epidemiology, Lazio Region Health Service, Rome, Italy
 Particles size and composition in Mediterranean countries geographical variability and short-term health effect MED-PARTICLES Project 2011 -2013 Under the Grant Agreement EU LIFE+ ENV/IT/327 EFFECTS ON MORTALITY OUTCOMES Samoli et al. Environ Health Perspect 2013; 121(8): 121: 932 -8 Samoli et al. Environ Int 2014; 67: 54 -61 Ostro et al. The risks of acute exposure to black carbon in southern Europe: results from the MED-PARTICLES project, Occup Environ Med, under revision.
 in mortality associated with 10μg/m 3 increase in particles Association under") Percent change (95%CIs) in mortality associated with 10μg/m 3 increase in particles Association under investigation Lags 0 -1 Lags 2 -5 Lags 0 -5 PM 2. 5 0. 55 (0. 27, 0. 84) 0. 51 (0. 07, 0. 96) 0. 70 (0. 22, 1. 18) PM 10 0. 32 (0. 13, 0. 52) 0. 19 (-0. 18, 0. 56) * 0. 28 (-0. 14, 0. 71) * PM 2. 5 0. 57 (0. 07, 1. 08) 0. 77 (0. 20, 1. 34) 0. 86 (0. 15, 1. 57) PM 10 0. 31 (-0. 01, 0. 62) 0. 41 (0. 04, 0. 79) 0. 54 (0. 09, 0. 99) PM 2. 5 0. 72 (-0. 11, 1. 55) 1. 63 (0. 62, 2. 65) 1. 91 (0. 71, 3. 12) PM 10 0. 23 (-0. 35, 0. 81) 1. 14 (0. 28, 2. 00) 1. 12 (0. 29, 1. 95) All-cause mortality Cardiovascular mortality Respiratory mortality *Indication of heterogeneity, P<0. 1 and I 2>50%
Percent change (95%CIs) in mortality associated with 10μg/m 3 increase in particles Association under investigation Lags 0 -1 Lags 2 -5 Lags 0 -5 PM 2. 5 0. 55 (0. 27, 0. 84) 0. 51 (0. 07, 0. 96) 0. 70 (0. 22, 1. 18) PM 10 0. 32 (0. 13, 0. 52) 0. 19 (-0. 18, 0. 56) * 0. 28 (-0. 14, 0. 71) * PM 2. 5 0. 57 (0. 07, 1. 08) 0. 77 (0. 20, 1. 34) 0. 86 (0. 15, 1. 57) PM 10 0. 31 (-0. 01, 0. 62) 0. 41 (0. 04, 0. 79) 0. 54 (0. 09, 0. 99) PM 2. 5 0. 72 (-0. 11, 1. 55) 1. 63 (0. 62, 2. 65) 1. 91 (0. 71, 3. 12) PM 10 0. 23 (-0. 35, 0. 81) 1. 14 (0. 28, 2. 00) 1. 12 (0. 29, 1. 95) All-cause mortality Cardiovascular mortality Respiratory mortality *Indication of heterogeneity, P<0. 1 and I 2>50%
 Distributed lag models Total mortality Respiratory mortality
 Particles size and composition in Mediterranean countries geographical variability and short-term health effect MED-PARTICLES Project 2011 -2013 Under the Grant Agreement EU LIFE+ ENV/IT/327 EFFECTS ON HOSPITAL ADMISSIONS Stafoggia et al, Environ Health Perspect 2013; 121 (9): 1026 -33
 in hospital admissions associated with 10μg/m 3 increase in PM") Percent change (95% CIs) in hospital admissions associated with 10μg/m 3 increase in PM 2. 5 Cardiovascular Respiratory Pollutant Lag % increase (95%CI) I 2 PM 2. 5 0 -1 0. 51(0. 12, 0. 90) 29 0. 49(0. 12, 1. 09) 34 2 -5 0. 15(0. 02, 0. 53) 0 1. 07(0. 04, 2. 11) 71 0 -5 0. 49(0. 03, 0. 95) 0 1. 36(0. 23, 2. 49) 65
Percent change (95% CIs) in hospital admissions associated with 10μg/m 3 increase in PM 2. 5 Cardiovascular Respiratory Pollutant Lag % increase (95%CI) I 2 PM 2. 5 0 -1 0. 51(0. 12, 0. 90) 29 0. 49(0. 12, 1. 09) 34 2 -5 0. 15(0. 02, 0. 53) 0 1. 07(0. 04, 2. 11) 71 0 -5 0. 49(0. 03, 0. 95) 0 1. 36(0. 23, 2. 49) 65
 Distributed lag models Cardiovascular admissions Respiratory admissions
 The long-term effects however are more important in terms of health burden and are more related to a biomonitoring programme
 PM 2. 5 exposure and life expectancy in the U. S. Pope et al; N Engl J Med. 2009 Jan 22; 360(4): 376 -86.
 Air Quality Standards for annual PM 2. 5 concentration WHO AQG US EPA Standard EU Limit Value
 Mortality and low level ΡΜ 2. 5 exposure: Canadian National Study (Crouse και συν, EHP 2012) WHO AQG All-Cause Mortality
 (95% CI)") City-specific PM 2. 5 effect estimates on PD admissions, presented as log(HR) (95% CI) per 1 -μg/m 3 increase in PM 2. 5. PD, Parkinson’s disease. The size of the symbol used for the effect estimate is proportional to its precision. From Kioumourtzoglou et al, Long-term PM 2. 5 Exposure and Neurological Hospital Admissions in the Northeastern United States, EHP 2016.
City-specific PM 2. 5 effect estimates on PD admissions, presented as log(HR) (95% CI) per 1 -μg/m 3 increase in PM 2. 5. PD, Parkinson’s disease. The size of the symbol used for the effect estimate is proportional to its precision. From Kioumourtzoglou et al, Long-term PM 2. 5 Exposure and Neurological Hospital Admissions in the Northeastern United States, EHP 2016.
 Ø Evidence is also accumulating on the effects of PM exposure on children’s cognition and neurodevelopment Ø There are several known carcinogens incorporated in ambient particles but it is worth mentioning that, in 2012, IARC characterized diesel particles as carcinogenic
 Health Impact Assessment within the multi-city APHEIS project (Air Pollution and Health: A European Information System ) Monitoring the impact of Air Pollution on Public Health in 26 European cities www. apheis. net & www. aphekom. org
, cumulative short-term (DL), long term (LT) health impact on") PM 10: Short term (ST), cumulative short-term (DL), long term (LT) health impact on all causes mortality (ICD 9 < 800). Reductions to 20 µg/m 3. Number of deaths per 100 000 inhabitants.
PM 10: Short term (ST), cumulative short-term (DL), long term (LT) health impact on all causes mortality (ICD 9 < 800). Reductions to 20 µg/m 3. Number of deaths per 100 000 inhabitants.
 Expected gain in life expectancy at the age of 30 years if the mean PM 2. 5 annual concentration decreases to 15 µg/m 3
 The Urban Heat Island refers to the increase of ambient temperature inside cities during the warm period of the year. Maximum temperatures are observed in heavily built city centers, whilst lower temperatures are observed in less dense areas.
 The intensity of the UHI is measured as the difference of temperature between various points in the city from locations outside. This difference is maximized between 11 pm and 3 am.
 London 2006 : Larger intensity of the UHI at the British Museum 6οC
 Contributing factors 1. Building materials with low albedo 2. Air conditioned buildings contribute to an increase of outdoor temperature 3. Dense mobile sources (vehicles) 4. URBAN CANYONS 5. Lack of green space
 Meteorology and climate are known to affect human health Ø Mortality in all geographical areas displays seasonality with maxima during the winter and also acute short-term maxima during heat waves in the summer period Ø Morbidity displays similar or opposite seasonality depending on the cause
 Total mortality and temperature association in 15 European cities participating in the European project PHEWE.
 Relative risk for mortality according to temperature in 11 U. S. cities 1973 -94. Curriero et al, Am J Epidemiol 2002; 155: 80 -7
 Mean daily number of deaths per month in Athens 1984 -1987
 Mean daily number of deaths in French cities during the summer of 2003 Le Tertre et al, Epidemiology 2006; 17: 75 -9
 The is evidence of SYNERGY between high temperature and high air pollution in their effects on mortality
 Association of ΡΜ 10 and mortality in a city with mean temperature of 9οC (25ο percentile) and one with 14οC (75ο percentile)
 Concluding points Ø There is evidence that air pollution and meteorology are associated with short-term effects on health Ø However long-term effects of air pollution are more important in terms of total burden on disease Ø Long-term effects are those usually investigated within the framework of a biomonitoring programme. Ø The association between short-term exposures and long-term effects is not well understood.