87ad8208faffcd23fb3357fda37e3d1a.ppt
- Количество слайдов: 43


Air Pollution and Adverse Birth Outcomes in the South Coast Air Basin, 1989 -2000 Michelle Wilhelm, Ph. D. Beate Ritz, M. D. , Ph. D. Department of Epidemiology UCLA School of Public Health

Why Study Air Pollution and Pregnancy? Ø Developing organism is uniquely sensitive to environmental toxins within a short time window Ø Adverse outcomes are common; in US: Ø ~10% are preterm Ø ~ 5% are low weight Ø Immediate and long term health effects Ø Infant morbidity and mortality Ø Adverse effects on adult health?
 Ø")
Existing Epidemiologic Studies Ø Most completed in last 5 years (35 published studies) Ø China, U. S. , Brazil, Czech Republic, Canada, S. Korea, Taiwan, Lithuania, Croatia, Sweden, Mexico Ø Two recent review articles Ø Maisonet et al. 2004, Environmental Research, May; 95(1): 106 -15 Ø Glinianaia et al. 2003, Epidemiology, 15: 36 -45
 Ø")
Outcome Events Studied Ø Deaths Ø Intrauterine (28 weeks of gestation to birth) Ø neonatal (<28 days) Ø infant (< 1 year) Ø Low birth weight (LBW) Ø Ø Ø Weight at birth <2500 g Born LBW at term vs. preterm Reduction in mean weight Small for gestational age (SGA; <10 th percentile of weight for gestational age) Preterm births (<37 weeks of gestation) or Ø reduction of mean gestational age Ø Malformations (cardiac)

Methodologic differences Ø Outcome categories Ø Ø Term LBW, all LBW, SGA, preterm and/or LBW Fetal, neonatal, infant deaths Ø Air pollutants Ø Area-wide averages (all monitoring stations) Ø Use monitor closest to maternal residency Ø Ø Ø Pollutants measured, mixtures, co-pollutants Scaling of units for pollutants Timing of exposure during most relevant pregnancy periods (varies by pollutant and outcome? ) Ø Covariates included in model

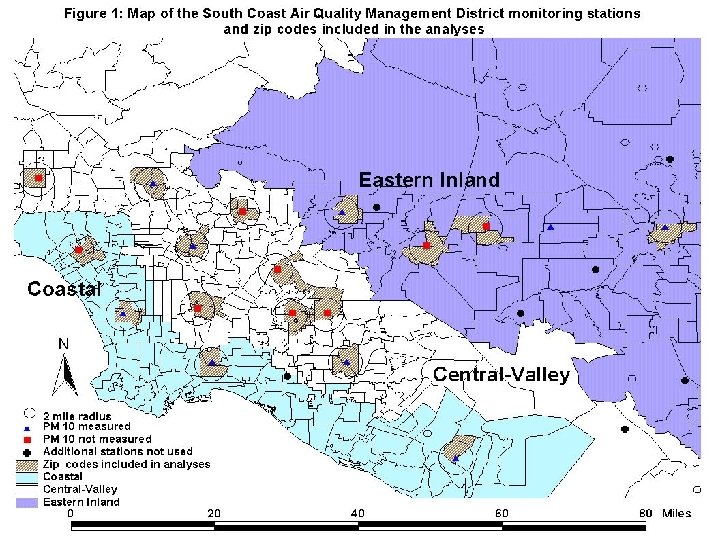
South Coast Air Basin Ø Large number of births (~half of all CA births, most in LA county) Ø Birth certificates are readily available Ø Network of government air monitoring stations Ø Nonattainment for PM 10, PM 2. 5 and O 3
 evaluated association")
Summary of So. CAB Studies Ø Ø Ø Ritz and Yu (1999) evaluated association between CO exposures during 3 rd trimester and risk of term LBW Infants born 1989 -1993 to women living in So. CAB Exposure based on CO measurements at SCAQMD monitoring stations (n=18) – Focused on mothers who resided within 2 miles of a CO monitoring station (n=125, 573) Ø For each child calculated last trimester average CO concentration using the ambient monitoring station within 2 miles

Summary of So. CAB Studies Ø Logistic regression used to evaluate association between 3 rd trimester CO and term LBW Ø Dichotomous outcome - <2, 500 g vs. 2, 500 g Ø Variables included in models Ø Ø Ø Ø Ø parity sex of the infant maternal age maternal race/ethnicity maternal educational attainment interval since previous live birth <12 months prenatal care gestational age transportation time to work (from census data)

Summary of So. CAB Studies Ø Other risk factors not available on birth certificates Øpre-pregnancy weight, weight gain, and height of mother Øsocial factors (marital status? , occupational exposures to toxins? ) Øbehavioral factors (e. g. smoking, caffeine use, alcohol consumption during pregnancy)
 for Term LBW 3 rd trimester ambient CO levels 1989")
Adjusted Odds Ratios (95%CI) for Term LBW 3 rd trimester ambient CO levels 1989 -1993, 18 monitoring stations in So. CAB All children Higher parity children Young Women case N=2, 809 case N=1, 454 case N=420 non-case N=122, 764 non-case N=73, 687 non-case N=15, 111 ___________________________________ CO level (ppm): <2. 2 1. 0 2. 2 - <5. 5 1. 04 1. 03 1. 02 (0. 96, 1. 13) (0. 92, 1. 15) (0. 83, 1. 26) 1. 22 1. 33 1. 54 (1. 03, 1. 44) (1. 07, 1. 65) (1. 07, 2. 22) 5. 5 1. 0 ___________________________
 for Term LBW 3 rd trimester ambient CO levels 1989")
Adjusted Odds Ratios (95%CI) for Term LBW 3 rd trimester ambient CO levels 1989 -1993, 6 monitoring stations in So. CAB w/ CO, NO 2, O 3, PM 10 All children Higher parity children Young Women case N=1, 100 case N=584 case N=146 non-case N=46, 921 non-case N=28, 313 non-case N=5, 918 ___________________________________ CO level (ppm): <2. 2 1. 0 2. 2 - <5. 5 1. 10 1. 24 1. 30 (0. 91, 1. 32) (0. 96, 1. 60) (0. 77, 2. 20) 1. 38 1. 92 5. 08 (0. 86, 2. 22) (1. 02, 3. 62) (1. 77, 14. 63) 5. 5 1. 0 ___________________________
 evaluated association between air")
Summary of So. CAB Studies Ø Ritz et al. (2000) evaluated association between air pollution and preterm birth ØInfants born 1989 -1993 to women living in So. CAB (n=97, 158) Ø Exposure assessment similar to Ritz and Yu (1999) ØFirst month of pregnancy and weeks prior to birth

Summary of So. CAB Studies Logistic regression with dichotomous outcome (<37 wks vs. 37 wks completed gestation) Ø Controlled for: Ø Ømaternal age, race, education; parity, interval since previous live birth, prenatal care, infant gender, previous LBW or preterm birth, smoking reported as “pregnancy complications”, season
 for Preterm Birth Per 50 ug/m 3 increase in")
Odds ratio (and 95% CI) for Preterm Birth Per 50 ug/m 3 increase in PM 10 and 3 ppm increase in CO 1989 -1993 Crude Two Exposure Other Risk Multipollutant OR Periods Factors+Season Model _____________________________________________ PM 10 – All stations: 6 wks 1. 20 1. 18 1. 15 1. 19 (1. 09 -1. 33) (1. 07 -1. 31) (1. 04 -1. 26) (1. 03 -1. 29) (1. 01 -1. 40) 1 st month 1. 16 (1. 06 -1. 26) 1. 13 (1. 04 -1. 24) 1. 09 (1. 00 -1. 19) 1. 09 (0. 99 -1. 20) 1. 12 (0. 97 -1. 29) CO – All stations: 6 wks 1. 12 (1. 08 -1. 17) 1. 13 (1. 08 -1. 17) 1. 06 (1. 02 -1. 10) 1. 04 (0. 99 -1. 10) 1. 05 (0. 97 -1. 12) 1. 05 (1. 01 -1. 09) 1. 01 (0. 97 -1. 04) 1. 04 (0. 99 -1. 09) 1. 03 (0. 96 -1. 10) 1 st month 1. 04 (1. 01 -1. 09) _____________________________________________
 evaluated association between")
Summary of So. CAB studies Ø Ø Ritz et al. (2002) evaluated association between air pollution and occurrence of birth defects Used California Birth Defect Monitoring Program data to evaluate neonates/fetuses delivered in So. CAB during 1987 -1993 Evaluated 6 different common heart defects Exposure based on SCAQMD monitoring station data during first 3 months of pregnancy for each infant
 Ventricle Septum Defects (multi-pollutant model)")
CO and (isolated) Ventricle Septum Defects (multi-pollutant model)
")
O 3 and Pulmonary artery and valve defects (multi-pollutant model)

Results on Birth Defects Ø Risk of certain cardiac heart defects was three times greater at high exposure levels Ø Ventricle septum birth defects (CO) Ø Aortic and pulmonary artery and valve defects (O 3) Ø Risks were observed in 2 nd month of pregnancy when heart formation occurs

Exposure Assessment Ø Based on concentrations measured at government air monitoring stations Ø May not account for differential exposure within neighborhoods due to proximity to sources Ø Women residing closer to freeways and major roadways may experience greater exposure Ø Pollutants released directly in motor vehicle exhaust Ø Pollutants formed adjacent to roadways

Exposure Assessment Ø Existing measurement data indicate concentrations of motor vehicle exhaust pollutants (CO, NO 2, primary particles) are: Ø Elevated near roadways and decline rapidly with distance Ø Correlated with traffic counts Ø Elevated inside and outside homes and schools located close to heavy traffic roadways

Source: Ott, 1977

Is CO a marker for traffic related pollution? Y. Zhu and W. Hinds, UCLA Particle center Epidemiologic studies ignore potential spatial heterogeneity of vehicle-related air pollution when using exposure data from government air monitoring stations

Traffic Density How can we estimate traffic-related contributions using existing data for large areas? Ø Self-reported traffic density on street of residence Ø Residential distance to major roads/freeways Ø Measured traffic density on main roads near homes Ø Average traffic density in census block groups, tracts or wards Ø Distance weighted traffic density (DWTD) Ø Air dispersion models (e. g. Caline 4)
 evaluated association between residential")
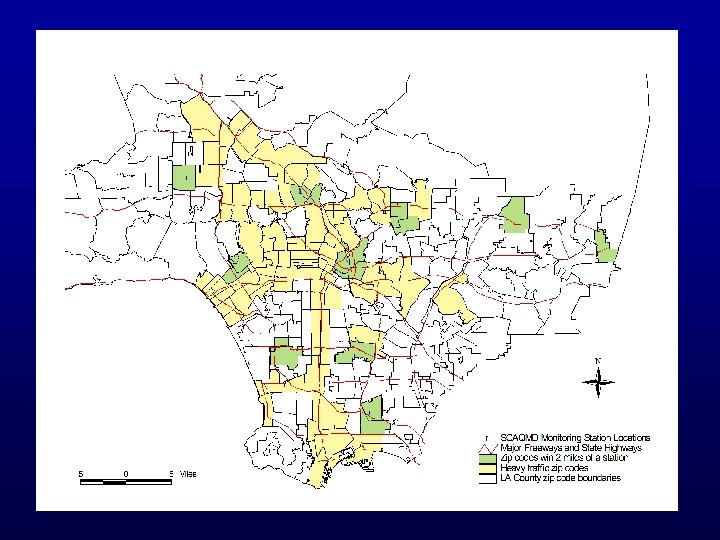
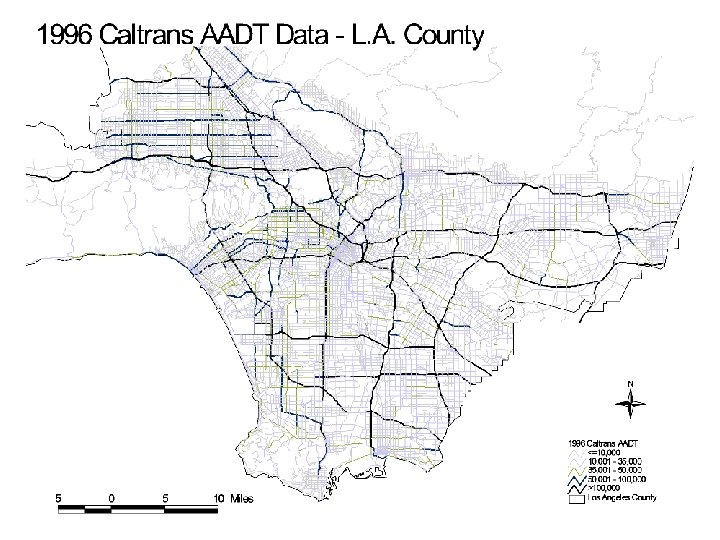
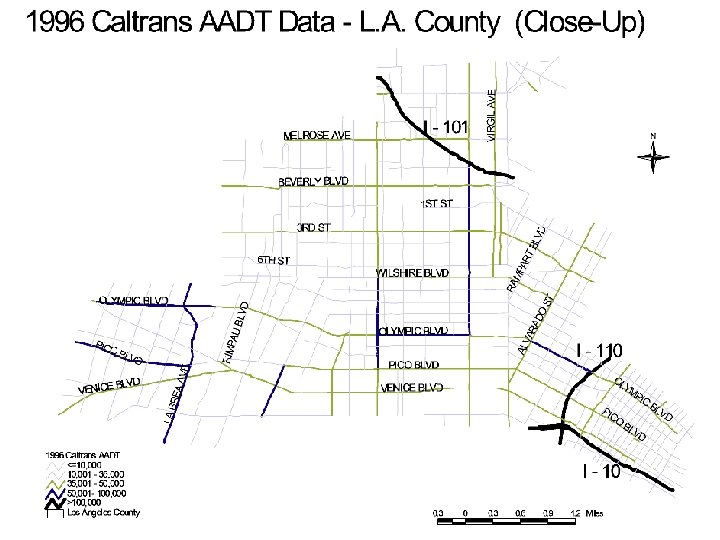
Summary of So. CAB Studies Ø Wilhelm and Ritz (2003) evaluated association between residential proximity to traffic and ABOs Ø For 1994 -96, in 112 LA zip codes, we identified all Ø Term low birth weight (LBW) and preterm infants (n=31, 653) and a random sample of controls (~same n) Ø Mapped residential birth addresses using GIS (ESRI Street. Map) Ø ~86% had electronic address data, of those ~91% could be mapped Ø Transferred Caltrans annual average daily traffic (AADT) count data for each year on to ESRI Street. Map
 DWTD value calculated for each subject Ø for all")
Distance Weighted Traffic Density (DWTD) DWTD value calculated for each subject Ø for all streets within 750 ft. (228. 6 m) radius of home Ø weighted traffic count on each street by distance from home to street (using a Gaussian distribution) Ø summed weighted counts for all streets within radius

Summary of So. CAB Studies Ø Evaluated change in estimates when adjusting for following risk factors (based on birth records) Ø Level of prenatal care, maternal age, maternal race/ethnicity, maternal education, infant sex, parity, interval since last live birth, previous LBW or preterm infant, gestational age (for LBW), season, year of birth Ø Also evaluated change in estimates when adjusting for: Ø Background air pollution concentrations (annual averages) Ø One or more freeways within buffer Ø Census block-group level indicators of SES Ø Household income, per capita income, fraction of children in poverty, age of structure, median home value, median gross rent
 between Residential DWTD and Risk of Preterm Birth")
Association (RR point estimate, 95% CI) between Residential DWTD and Risk of Preterm Birth for infants born between 1994 -1996 to mothers living in 112 zip codes located in LA County, CA Preterm cases=13, 464 controls=21, 124 DWTD Unadjusted DWTD Adjusted for covariates, background concentrations and one or more freeways w/in 750 ft. buffer Quintile of Distance-Weighted Traffic Density (DWTD) <20 th percentile 20 -<40 th percentile 40 th-<60 th percentile 60 th-<80 th percentile ≥ 80 th percentile 1. 00 (0. 94 -1. 07) 1. 05 (0. 98 -1. 11) 1. 10 (1. 04 -1. 17) 1. 11 (1. 04 -1. 18) 1. 0 0. 99 (0. 93 -1. 05) 1. 02 (0. 96 -1. 09) 1. 07 (1. 01 -1. 13) 1. 08 (1. 01 -1. 15) Fall/Winter Third Trimester (birth month Jan-June) <20 th percentile 20 -<40 th percentile 40 th-<60 th percentile 60 th-<80 th percentile ≥ 80 th percentile 1. 0 0. 99 (0. 91 -1. 09) 1. 05 (0. 97 -1. 15) 1. 11 (1. 02 -1. 21) 1. 18 (1. 08 -1. 28) 1. 0 0. 99 (0. 90 -1. 07) 1. 04 (0. 95 -1. 13) 1. 08 (1. 00 -1. 18) 1. 15 (1. 06 -1. 26) Spring/Summer Third Trimester (birth month July-Dec) <20 th percentile 20 -<40 th percentile 40 th-<60 th percentile 60 th-<80 th percentile ≥ 80 th percentile 1. 01 (0. 92 -1. 10) 1. 04 (0. 95 -1. 13) 1. 10 (1. 00 -1. 20) 1. 04 (0. 96 -1. 14) 1. 0 0. 99 (0. 91 -1. 08) 1. 01 (0. 92 -1. 10) 1. 05 (0. 97 -1. 15) 1. 01 (0. 92 -1. 10) DWTD percentile values are: <1, 537, 1, 537 -5, 338, 5, 339 -11, 722, 11, 723 -24, 711, ≥ 24, 712.

Low inversion layers trap pollutants in colder seasons
 between Residential DWTD and Risk of LBW and")
Association (OR point estimate, 95% CI) between Residential DWTD and Risk of LBW and Preterm Birth for infants born between 1994 -1996 to mothers living in 112 zip codes located in LA County, CA Preterm and LBW cases=3, 509 controls=21, 124 DWTD Unadjusted DWTD Adjusted for covariates, background concentrations and one or more freeways w/in 750 ft. buffer Quintile of Distance-Weighted Traffic Density (DWTD) <20 th percentile 20 -<40 th percentile 40 th-<60 th percentile 60 th-<80 th percentile ≥ 80 th percentile 1. 02 (0. 91 -1. 15) 1. 05 (0. 93 -1. 17) 1. 16 (1. 04 -1. 30) 1. 13 (1. 01 -1. 26) 1. 01 (0. 90 -1. 14) 1. 05 (0. 93 -1. 18) 1. 14 (1. 01 -1. 28) 1. 12 (0. 99 -1. 26) Fall/Winter Third Trimester (birth month Jan-June) <20 th percentile 20 -<40 th percentile 40 th-<60 th percentile 60 th-<80 th percentile ≥ 80 th percentile 1. 0 0. 96 (0. 82 -1. 14) 0. 99 (0. 84 -1. 17) 1. 14 (0. 97 -1. 34) 1. 24 (1. 06 -1. 45) 1. 0 0. 96 (0. 81 -1. 14) 0. 99 (0. 83 -1. 17) 1. 12 (0. 95 -1. 33) 1. 24 (1. 04 -1. 47) Spring/Summer Third Trimester (birth month July-Dec) <20 th percentile 20 -<40 th percentile 40 th-<60 th percentile 60 th-<80 th percentile ≥ 80 th percentile 1. 08 (0. 92 -1. 27) 1. 10 (0. 94 -1. 29) 1. 17 (1. 00 -1. 38) 1. 03 (0. 87 -1. 20) 1. 06 (0. 90 -1. 25) 1. 11 (0. 94 -1. 31) 1. 16 (0. 98 -1. 36) 1. 01 (0. 85 -1. 20) DWTD percentile values are: <1, 537, 1, 537 -5, 338, 5, 339 -11, 722, 11, 723 -24, 711, ≥ 24, 712.
 between Residential DWTD and Risk of Term LBW")
Association (OR point estimate, 95% CI) between Residential DWTD and Risk of Term LBW for infants born between 1994 -1996 to mothers living in 112 zip codes located in Los Angeles County, CA Term LBW cases=3, 771 controls=26, 351 DWTD Unadjusted DWTD Adjusted for covariates, background concentrations and one or more freeways w/in 750 ft. buffer Quintile of Distance-Weighted Traffic Density (DWTD) <20 th percentile 20 -<40 th percentile 40 th-<60 th percentile 60 th-<80 th percentile ≥ 80 th percentile 1. 0 1. 13 (1. 02 -1. 27) 1. 16 (1. 04 -1. 29) 1. 18 (1. 05 -1. 31) 1. 16 (1. 04 -1. 30) 1. 0 1. 11 (0. 99 - 1. 25) 1. 16 (1. 03 - 1. 30) 1. 15 (1. 02 - 1. 29) 1. 11 (0. 99 - 1. 26) Fall/Winter Third Trimester (birth month Jan-June) <20 th percentile 20 -<40 th percentile 40 th-<60 th percentile 60 th-<80 th percentile ≥ 80 th percentile 1. 0 1. 18 (1. 00 -1. 38) 1. 26 (1. 08 -1. 48) 1. 29 (1. 10 -1. 51) 1. 33 (1. 13 -1. 55) 1. 0 1. 20 (1. 01 - 1. 42) 1. 33 (1. 12 - 1. 58) 1. 33 (1. 12 - 1. 57) 1. 33 (1. 11 - 1. 58) Spring/Summer Third Trimester (birth month July-Dec) <20 th percentile 20 -<40 th percentile 40 th-<60 th percentile 60 th-<80 th percentile ≥ 80 th percentile 1. 0 1. 10 (0. 95 -1. 28) 1. 07 (0. 92 -1. 24) 1. 08 (0. 93 -1. 26) 1. 03 (0. 88 -1. 20) 1. 04 (0. 89 - 1. 22) 1. 02 (0. 87 - 1. 20) 1. 01 (0. 86 - 1. 18) 0. 96 (0. 81 - 1. 13) DWTD percentile values are: <1, 524, 1, 524 -5, 266, 5, 267 -11, 568, 11, 569 -24, 579, ≥ 24, 580.

DWTD Measure Ø Relatively crude exposure assessment approach ØDoes not take meteorology or motor vehicle emission rates into account Can be applied to large population using existing data Ø Experimental support for exponential decay from roadways Ø

EPOS Survey Ø Nested case-control study of LA County births Ø LBW/Preterm children and term normal weight controls (targeted n=1000 case and 1000 controls over 1 year - 2003) Ø Ø Ø Randomly selected from birth certificates in 111 LA zip codes Mothers interviewed by phone or completed a mail survey 3 -7 months after births Collected information on: Ø indoor air pollution sources Ø in-transit exposures Ø time-activity data Ø Individual level risk factors for LBW/preterm birth during pregnancy: Ø Smoking, alcohol, occupation, psychosocial stress

EPOS Response Rates # of Mail Surveys # of Telephone Surveys # of Home Visits Total # of surveys completed Response rates: All selected subjects Subjects w/available and correct telephone no’s and addresses 1020 1491 64 2575 39% ~75%

Data Linkages Ø Most studies based on existing data sources ØBirth and death certificate information, CBDMP data Ø Residential addresses and SSN’s now available from state for birth certificates ØAir pollution measurements from government monitors ØTraffic data from Caltrans

Major Questions Ø Adequacy of air pollution exposure assessment methods? Ø Reliance on existing monitoring networks Ø Potential intracommunity variation in pollutant concentrations Ø Time spent indoors and indoor sources Ø Reliance on birth certificate zip code or address Ø Residential and work mobility patterns for pregnant women Ø Which pollutants are important? Ø Associations reported for CO, NO 2, TSP, SO 2, PM 10, PM 2. 5, PAHs Ø Identifying pollutants of concern and biological mechanisms of action

Major Questions Ø Vulnerable pregnancy periods? Ø Associations reported most consistently for early or late pregnancy Ø Confounding due to unmeasured risk factors? Ø E. g. , smoking, alcohol, diet, pregnancy weight gain Ø Ø Susceptible subpopulations? Importance of early pregnancy losses (unreported)?

Discussion
 for Term LBW Ambient CO levels at South")
Adjusted Odds ratios (and 95% CI) for Term LBW Ambient CO levels at South Central LA station only, 1989 -1993 1 st Trim 2 -mile radius 2 nd Trim 2 -mile radius 3 rd Trim 5 -mile radius _____________________________________________________ CO level: <50 th 1. 0 50 -95 th >=95 th 1. 0 0. 87 (0. 73 -1. 03) 1. 02 (0. 85 -1. 20) 1. 06 (0. 89 -1. 26) 1. 07 (0. 99 -1. 16) 0. 82 (0. 54 -1. 24) 0. 97 (0. 65 -1. 44) 1. 24 (0. 87 -1. 77) 1. 24 (1. 06 -1. 45) ____________________________________________________ 2 mile radius: case N=572, non-case N=23, 533; 5 mile radius: case N=2, 805, non-case N=94, 160

u Adjusting for census block group level SES indicators changed association estimates minimally (maximum of 6% but mostly by 1 -2%) u Stratification on median values of SES indicators suggested greater associations in lower SES areas Outcome Association for women residing in census block groups where fraction of children in poverty <28% (median) Association for women residing in census block groups where fraction of children in poverty ≥ 28% Preterm birth 1. 03 (0. 95 -1. 11) 1. 15 (1. 03 -1. 27) Preterm and LBW birth 1. 07 (0. 90 -1. 27) 1. 18 (0. 97 -1. 43) Term LBW 1. 07 (0. 90 -1. 27) 1. 25 (1. 03 -1. 51) *Results for highest vs. lowest DWTD quintile, adjusting for covariates, background pollutant concentrations (continuous) and census block group indicators of SES (continuous).
87ad8208faffcd23fb3357fda37e3d1a.ppt