

b0a00f3f0050af57cb8592c96d2c96d1.ppt
- Количество слайдов: 68
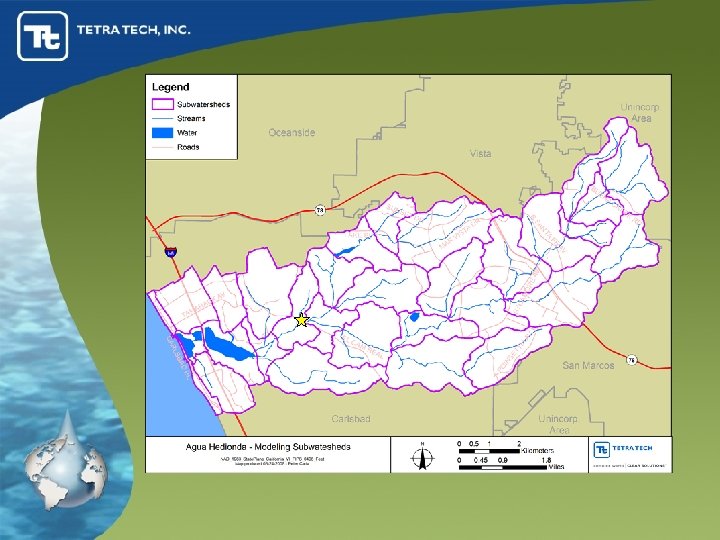
 Agua Hedionda Watershed Management Plan Watershed Planning Group Meeting March 27, 2008 Carlsbad, CA
 Agenda Preliminary Modeling Results LID Constraints and Conceptual Designs Evaluation Process for Identifying Acquisition, Restoration, and BMP Retrofit Opportunities Finalizing Goals and Objectives
 Preliminary Modeling Results
 Modeling Objectives § Represent watershed hydrology and pollutant loading § Assess hydromodification and water quality § Simulate various development scenarios
 § Predevelopment Condition") Model Scenarios § Existing Condition (based on 2007 SANDAG land use) § Predevelopment Condition (all development converted to open space) § Future Condition (based on 2030 SANDAG land use) § Representation of lawn irrigation and BMP treatment has been incorporated
Model Scenarios § Existing Condition (based on 2007 SANDAG land use) § Predevelopment Condition (all development converted to open space) § Future Condition (based on 2030 SANDAG land use) § Representation of lawn irrigation and BMP treatment has been incorporated
 LSPC Model § LSPC is the Loading Simulation Program in C++, developed by the U. S. Environmental Protection Agency (EPA) Region 4, with support of Tt § Watershed modeling system includes streamlined HSPF algorithms for simulating hydrology, sediment, and general water quality on land in stream § Used to represent the build up, wash off, and first order decay processes of pollutants and sediment processes (on land in channel)
 Hydrology § Hydrologic Components: ü Precipitation ü Interception ü Evapotranspira ü ü ü tion Overland flow Infiltration Interflow Subsurface storage Groundwater flow Groundwater loss Schematic of Stanford Watershed M
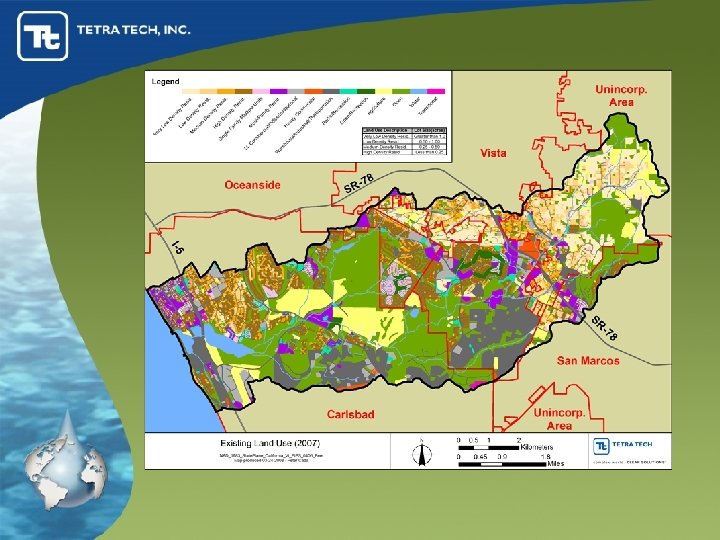
 Model Inputs § Land use data from SANDAG; modified using parcel data for finer resolution of residential categories; future land use modified based on feedback from municipalities § Precipitation from Oceanside Pumping Plant; PET from a variety of CIMIS stations § Model subwatersheds delineated from 10 m DEM; stream characteristics based on drainage area: width/depth relationships § Demand-based lawn irrigation

 Model Parameters § Initial basis for parameterization: ü Hydrology: San Diego Region TMDL Model and other So. Cal model applications ü Bacteria: San Diego Region TMDL Model (Bacti-II Draft) ü Nutrients: San Jacinto model ü Sediment: SCCWRP regional sediment approach ü Local watershed properties § Some parameters adjusted during calibration
 § Some") Model Calibration § Began with regionally calibrated model (to flow and bacteria) § Some additional but limited local calibration was possible § ~1 year of stream flow data (2005 -2006) § Wet weather water quality data at one station (El Camino Real Bridge): 1998 – 2006 (25 observations)
Model Calibration § Began with regionally calibrated model (to flow and bacteria) § Some additional but limited local calibration was possible § ~1 year of stream flow data (2005 -2006) § Wet weather water quality data at one station (El Camino Real Bridge): 1998 – 2006 (25 observations)
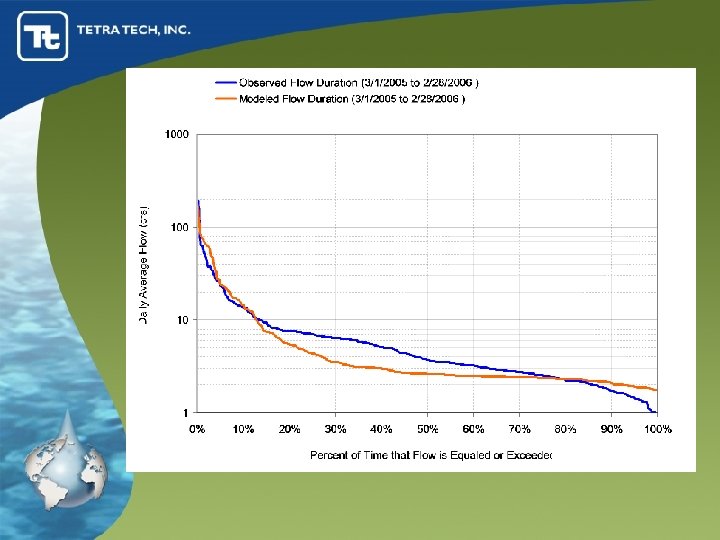
 Mean Daily Flow Model Outlet 1007 vs. Agua Hedionda Creek At El Camino Real Bridge
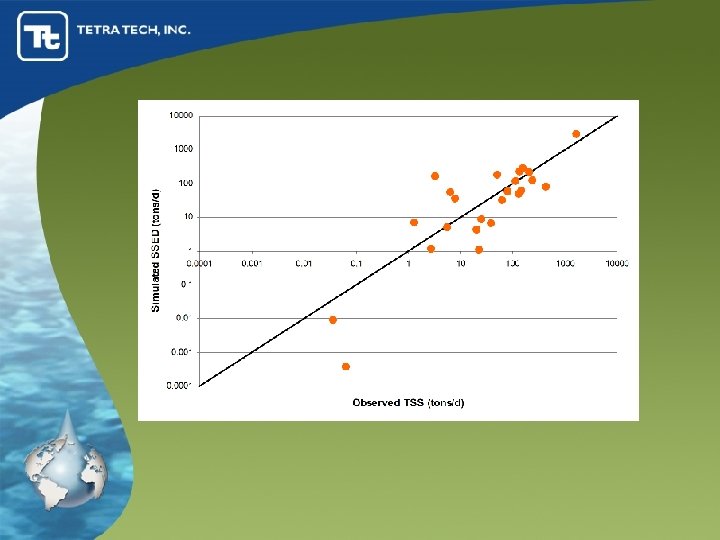
 Seasonal Regression and Temporal Aggregate Model Outlet 1007 vs. Agua Hedionda Creek At El Camino Real Bridge

 BMP Representation § Two general types of BMPs represented in the model ü Hydrologic Source Control (HSC) ü Storm Water Treatment (SWT) § HSC reduces runoff volumes and rates primarily through infiltration ü Examples may include vegetated swales*, biofilters, infiltration basins, permeable pavement, media filters § SWT removes pollutants after they have entered concentrated flow paths ü Examples may include extended dry detention*, constructed wetlands, wet ponds, hydrodynamic devices, catch basins * Most common in Agua Hedionda
 Interpretation of SW Requirements § Existing treatment was determined through a review SUSMP BMPs and from information provided by Carlsbad on older detention ponds § SDRWQB Order 2001 -01: requires water quality treatment for priority projects (either volume- or flow-based wq treatment) § Future priority projects must meet Order 2001 -01 plus the 2007 Order ü Peak flow control for continuous range of storms (channel protection-based requirement) ü LID practices (level of requirement unclear) § Assumed that Priority Projects receive treatment in all future development except for Very Low Density (>1 ac) and approximately half of Low Density (0. 5 -1. 0 ac)
 Existing Scenario Infiltration goes to nearby urban pervious baseflow Impervious 55% To. HSC 1 10% 5% To. SWT 2 To. SWT 1 30% To. Stream Untreated Overflow 40% Hydrologic Source Control 5% Untreated Bypass Stormwater Treatment 1 Untreated Bypass Stormwater Treatment 2 Effluent Conc. Drainage Area boxes represent a mix of land use. 55% Effluent Conc. Stream Segment
 Infiltration goes to nearby urban pervious baseflow Future Scenario Impervious Variable % To. HSC 1 To. SWT 3 100% Overflow Hydrologic Source Control + “Existing” Configuration Untreated Bypass Stormwater Treatment 3 Effluent Conc. Drainage Area boxes represent different land uses developed in the future. Stream Segment Moderate levels of LID application applied in the form of 4 -10% impervious reduction.
 Three Scenarios § § Predevelopment Existing Condition Future Conditions w/ BMPs Future Conditions w/o BMPs
 Storm Hydrograph 2/12/2001 - 2/14/2001
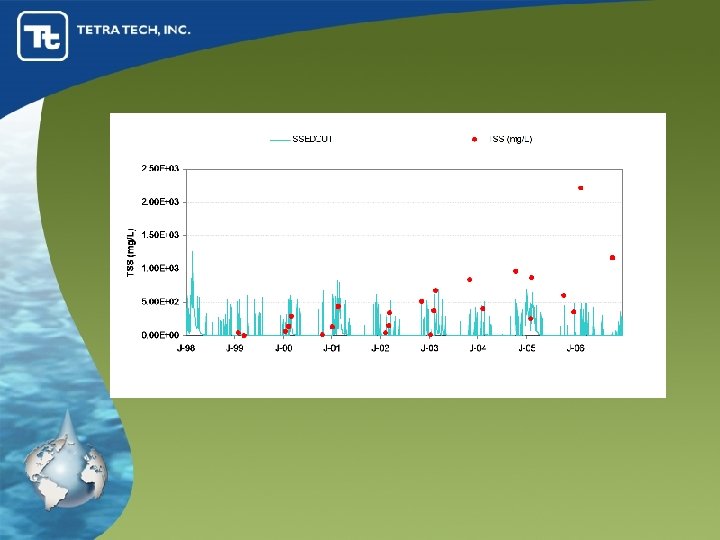
 Sediment Loading at Lagoon
 Next Steps § Integrate with geomorphic analysis § Final QA/QC, generate additional model output, and develop model report § Use model output to target and reprioritize management recommendations in the WMP (e. g. , priority subwatersheds, evaluate loading to lagoon, etc)
 LID Constraints and Conceptual Designs
 Future Development by Planned Land Use
 Constraints - Slope § As slopes increase, many LID techniques become more difficult to implement ü 0% to 15% - Low ü 15% to 25% - Medium ü>25% - High (hillslope development)
 Constraints - Slope § For the majority of developing areas, slope is a low to medium constraint § Many high slopes in areas planned for Very Low Density Residential.
 Constraints Slope Constraints -- Slope
 Constraints – Soil Erosion Hazard § Soil erosion hazard estimated to be mostly slight to moderate § Correlated to slope § Some localized hotspots
 Constraints – Soil Erosion Hazard
 Constraints – Soil Infiltration § In most of the developing area, infiltration rates are very low § In upper watershed, rates are better but still low
 Constraints – Soil Infiltration § Low and very low infiltration rates produce the biggest physical constraint to many important LID practices § Not feasible ü Dry wells/infiltration basins § More costly to implement (need underdrains) ü Bioretention ü Permeable asphalt/concrete
 Constraints – Soil Erosion Hazard Infiltration
") Other Constraints § Arid conditions/low rainfall üConstraint for BMPs with permanent pools (wet ponds) üNot a constraint for vegetation in BMPs, which can be maintained with irrigation/sprinklers
Other Constraints § Arid conditions/low rainfall üConstraint for BMPs with permanent pools (wet ponds) üNot a constraint for vegetation in BMPs, which can be maintained with irrigation/sprinklers
 Conceptual Designs § Very low density residential in high sloped areas üNot regulated as Priority Projects üBest practice: Cluster development avoiding high slopes and riparian areas üShared driveways and tucked-under parking üPermeable pavers for sidewalks/patios üCisterns used to supplement irrigation
 Conceptual Designs § Single Family Residential ü Avoid higher sloped/more erosive areas ü Riparian buffer setbacks ü Vegetated or rock-lined swales ü Extended Dry Detention Basins ü Shared driveways and tucked-under parking ü Permeable pavers for sidewalks/patios ü Cisterns used to supplement irrigation
 ü Vegetated or rock-lined swales ü") Conceptual Designs § High density mixed-use areas (commercial/multifamily) ü Vegetated or rock-lined swales ü Extended Dry Detention Basins ü Bioretention (with underdrains) ü Turf block fire lanes ü Roof drains diverted to large flat pervious areas ü Cisterns used to supplement irrigation (can be large and incorporated into building design)
Conceptual Designs § High density mixed-use areas (commercial/multifamily) ü Vegetated or rock-lined swales ü Extended Dry Detention Basins ü Bioretention (with underdrains) ü Turf block fire lanes ü Roof drains diverted to large flat pervious areas ü Cisterns used to supplement irrigation (can be large and incorporated into building design)
 Conceptual Designs § Warehouse/industrial üVegetated or rock-lined swales üExtended Dry Detention Basins üTurf block fire lanes üRoof drains diverted to large flat pervious areas üCisterns used to supplement irrigation (can be large and incorporated into building design)
 Evaluation Process for Identifying Acquisition, Restoration, and BMP Retrofit Opportunities
 Land Acquisition and Restoration § Identifying opportunities for ü Land Acquisition for Preservation ü Buffer Restoration ü Wetlands Restoration § Prioritizing opportunities based on Goal #2 § Considering Goal #3 in relation to water quality benefits
 Goal #2 and Objectives § Protect , restore and enhance habitat in the watershed. ü Protect and expand undeveloped natural areas to protect habitat. ü Protect, enhance, and restore terrestrial habitat, especially existing vegetation in riparian areas. ü Provide riparian habitat to improve and maintain wildlife habitat. ü Provide natural area connectivity to improve and maintain wildlife habitat. ü Maintain stable stream banks and riparian areas to protect instream aquatic habitat and priority tree species. ü Maintain and protect instream habitat to support native aquatic biology. ü Maintain and protect lagoon habitat.
 Goal #3 § Restore watershed functions, including hydrology, water quality, and habitat, using a balanced approach that minimizes negative impacts.
 Approach § Identify subwatersheds with highest quality natural areas and wildlife habitat “Priority Subwatersheds” § Prioritize preservation and restoration opportunities by ü Priority Subwatersheds ü Screening criteria that measure likelihood of achieving Goal #2 and providing water quality benefits
 Priority Subwatershed Screening Criteria § Natural Areas – naturally vegetated areas § Terrestrial Habitat – natural areas and § § § undeveloped, disturbed land that provide wildlife habitat (e. g. , agriculture) Riparian Habitat – land that supports riparian vegetation CRAM – Ratings of wetland function. Aquatic Habitat Rating – Qualitative ratings from field reconnaissance. MSCP/MHCP Priority Species Observations Lagoon/Coastal Subwatersheds – Used to further prioritize lagoon and coastal habitat. Soil Erosion Hazard – Rated by NRCS index as having severe or very severe erosion hazard
 Comparison to MHCP and MSCP § Multiple Habitat and Species Conservation Plans (MHCP and MSCP) § Checked that connectivity provided between: üMHCP/MSCP planning, core, and linkage areas üAH priority subwatersheds
 Land Acquisition Screening Criteria § Location within a Priority Subwatershed § Unprotected Natural Areas – naturally vegetated § § areas that may be developed in the future. Riparian Habitat – land that supports riparian vegetation. Location Relative to a Stream Restoration Opportunity Location relative to invasive species treatment areas Soil Erosion Hazard – land rated by NRCS index as having severe or very severe erosion hazard. Used to prioritize parcels for preservation
 Buffer Restoration Screening Criteria § Location within Priority and Linkage Subwatersheds – Priority subwatersheds that provide opportunities to restore habitat connectivity. § Buffer Restoration Opportunity – undeveloped land that is likely to support riparian vegetation and is not within the existing natural areas. § Location Relative to a Stream Restoration Opportunity § Location Relative to Priority Tree Species – considered Coast Live Oak, Sycamore, and Cottonwood dominated riparian communities.
 § Road and Bridge Constraints– Prioritized opportunities with") Buffer Restoration Screening Criteria (Cont. ) § Road and Bridge Constraints– Prioritized opportunities with fewer constraints § Sewer Line Constraints – Same as above Used to prioritize parcels for buffer restoration
Buffer Restoration Screening Criteria (Cont. ) § Road and Bridge Constraints– Prioritized opportunities with fewer constraints § Sewer Line Constraints – Same as above Used to prioritize parcels for buffer restoration
 Wetland Restoration Screening Criteria § Location within Priority and Linkage § § Subwatersheds – Subwatersheds that provide opportunities to restore habitat connectivity. Wetland Restoration Opportunity – undeveloped land that where wetlands may have been disturbed or destroyed. CRAM Code – Ratings of wetland function. Location relative to stakeholder recommended opportunities Location within coastal subwatersheds Used to prioritize parcels for wetlands restoration
 Scoring Methods § Developed metrics from screening criteria § Developed scoring thresholds § Scored subwatershed or parcel üfrom 1 to 10 points § Calculated composite score over all metrics for: üSubwatershed Priority üLand Acquisition üBuffer Restoration üWetland Restoration
 Preliminary Land Acquisition Opportunities § Total Opportunity Area: 2, 700 acres of unprotected natural area § Parcels with >10 ac unprotected natural area: nearly 1400 acres § Top Ranking Parcels: 123 acres of unprotected natural area with 57 acres of riparian habitat
![Buffer Restoration Priorities Preliminary Buffer Restoration Priorities § [Insert Map]](https://present5.com/presentation/b0a00f3f0050af57cb8592c96d2c96d1/image-56.jpg "Buffer Restoration Priorities Preliminary Buffer Restoration Priorities § [Insert Map]") Buffer Restoration Priorities Preliminary Buffer Restoration Priorities § [Insert Map]
Buffer Restoration Priorities Preliminary Buffer Restoration Priorities § [Insert Map]
![Wetland Restoration Priorities § [Insert Map]](https://present5.com/presentation/b0a00f3f0050af57cb8592c96d2c96d1/image-57.jpg "Wetland Restoration Priorities § [Insert Map]") Wetland Restoration Priorities § [Insert Map]
Wetland Restoration Priorities § [Insert Map]
 Verification and Cost Estimation § For top-ranking sites, verifying land cover with 2005 Aerial Photographs § Verifying that scoring system identifies appropriate opportunities § Estimating planning-level acquisition and restoration costs
 End Products § Database of all opportunities with ownership information, metrics, and scores § Detailed location maps § List of stakeholder recommended opportunities
 Stream Restoration and BMP Retrofit Screening Criteria § Effectiveness – in addressing existing or potential § § water quality, geomorphology, or habitat problems. Feasibility ü Stream reach length ü Current land cover ü Minimal landowners ü Site access ü Minimal utility or flood control constraints ü Upland sources of degradation that would prevent long-term success Meets multiple goals/objectives Relative cost Stakeholder support. Including TAC and WPG
 Finalizing Goals and Objectives
 Goal #4 • Support compliance with regional, state, and federal regulatory requirements applicable to the watershed
 Goal 4 Draft Objectives § Assist in meeting regional water quality objectives. § Leverage efforts in helping meet local requirements. § Support information sharing so stakeholders are knowledgeable.
 Goal 4 Draft Objectives, cont. § Maintain an open process regarding regulatory requirements and compliance. § Achieve compliance with local and regional water quality objectives. § Provide feedback and reporting mechanisms.
 Goal #5 • Increase awareness and stewardship within the watershed, including encouraging policy makers to develop policies that support a healthy watershed.
 Goal 5 Draft Objectives § Disseminate information to stakeholders to support scientifically based, sound decision-making. § Develop a consistent and coherent message about the watershed based on sound science. § Support citizen stewardship though public education and outreach.
 Goal 5 Draft Objectives, cont. § Support adoption and implementation of a Watershed Management Plan by local jurisdictions, agencies, and environmental organizations. § Sustain long-term watershed management through a collaborative Agua Hedionda Watershed Council.
 Next Steps