 Aggregate Demand and Aggregate Supply 29 McGraw-Hill/Irwin Copyright © 2012 by The McGraw-Hill Companies, Inc. All rights reserved.
 Aggregate Demand Real GDP desired at each price level Inverse relationship Real balances effect Interest effect Foreign purchases effect LO1 29-2
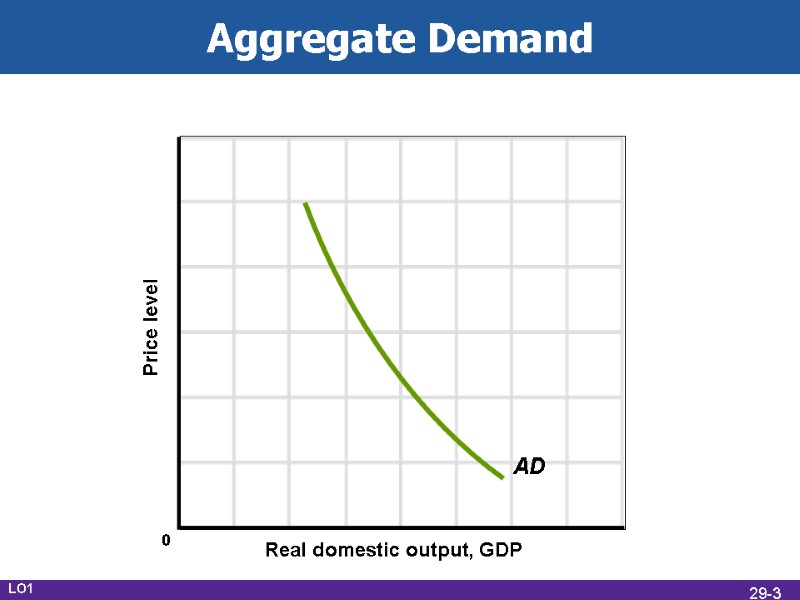 Aggregate Demand Real domestic output, GDP Price level AD LO1 0 29-3
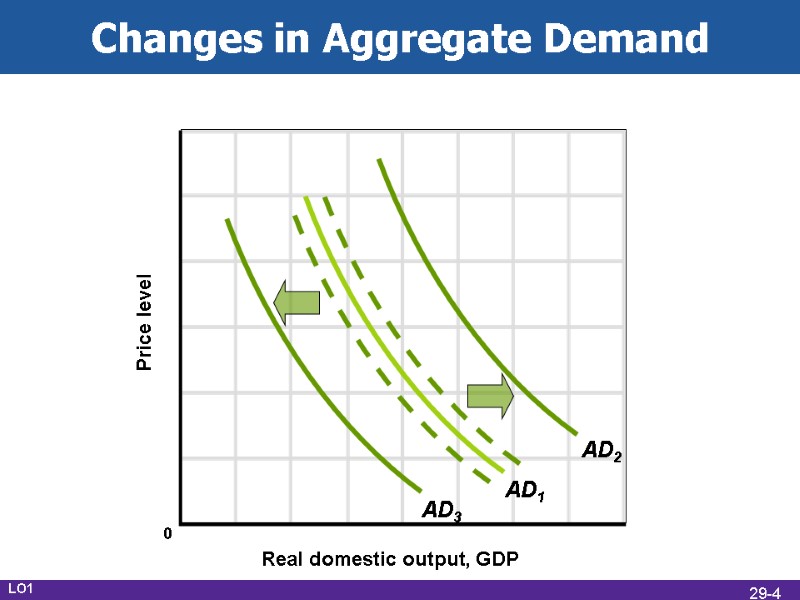 Changes in Aggregate Demand Real domestic output, GDP Price level AD1 AD3 AD2 LO1 0 29-4
 Consumer Spending Consumer wealth Household borrowing Consumer expectations Personal taxes LO1 29-5
 Investment Spending Real interest rates Expected returns Expectations about future business conditions Technology Degree of excess capacity Business taxes LO1 29-6
 Government Spending Government spending increases Aggregate demand increases (as long as interest rates and tax rates do not change) More transportation projects Government spending decreases Aggregate demand decreases Less military spending LO1 29-7
 Net Export Spending National income abroad Exchange rates Dollar depreciation Dollar appreciation LO1 29-8
 Aggregate Supply Total real output produced at each price level Relationship depends on time horizon Immediate short run Short run Long run LO2 29-9
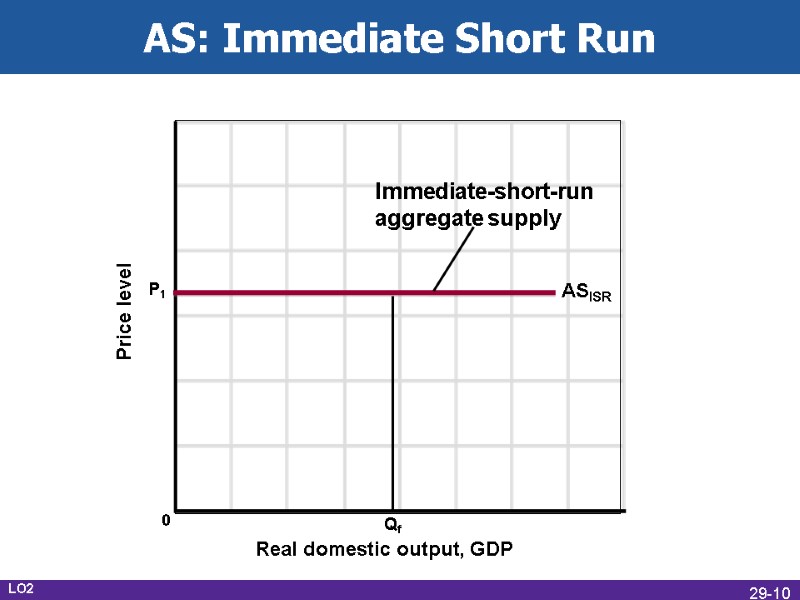 AS: Immediate Short Run Real domestic output, GDP Price level ASISR Qf Immediate-short-run aggregate supply P1 0 LO2 29-10
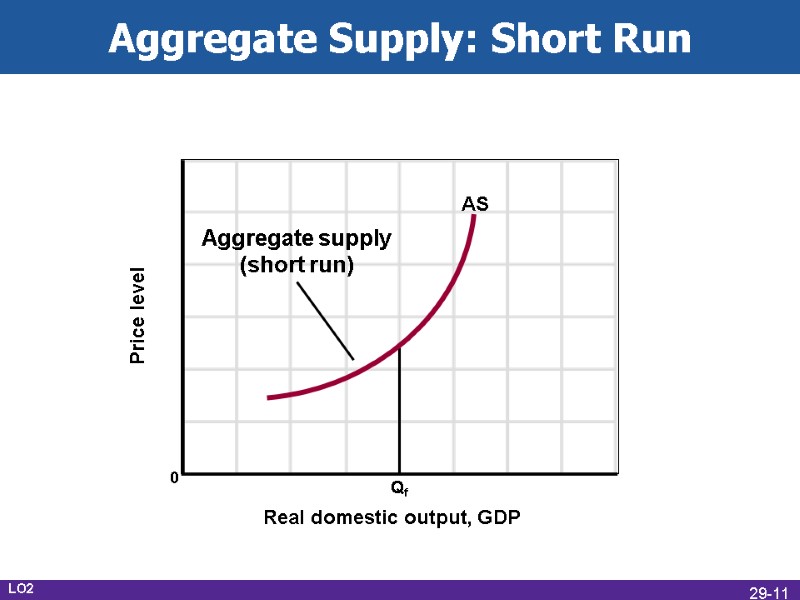 Aggregate Supply: Short Run Real domestic output, GDP Price level 0 Qf AS Aggregate supply (short run) LO2 29-11
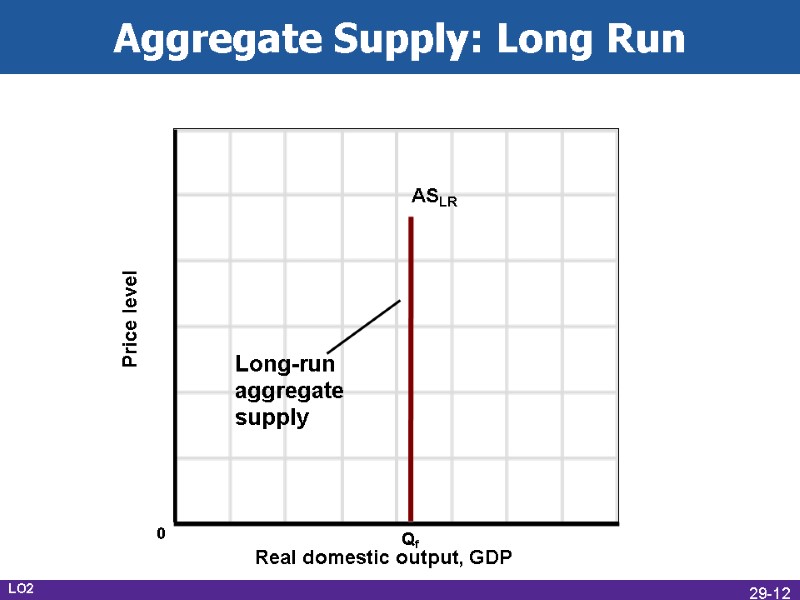 Aggregate Supply: Long Run Real domestic output, GDP Price level ASLR Qf 0 Long-run aggregate supply LO2 29-12
 Changes in Aggregate Supply Determinants of aggregate supply Shift factors Collectively position the AS curve Changes raise or lower per-unit production costs LO2 29-13
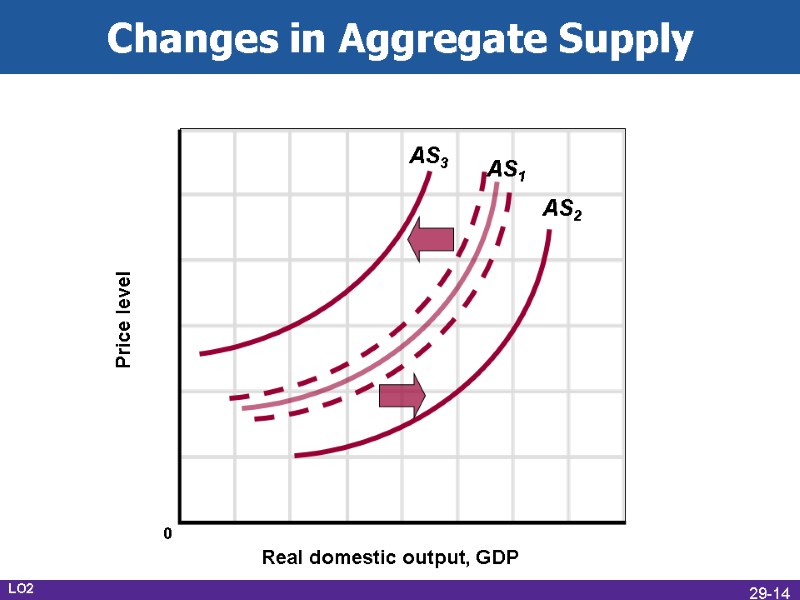 Changes in Aggregate Supply Real domestic output, GDP Price level AS1 AS3 AS2 0 LO2 29-14
 Input Prices Domestic resource prices Labor Capital Land Prices of imported resources Imported oil Exchange rates LO2 29-15
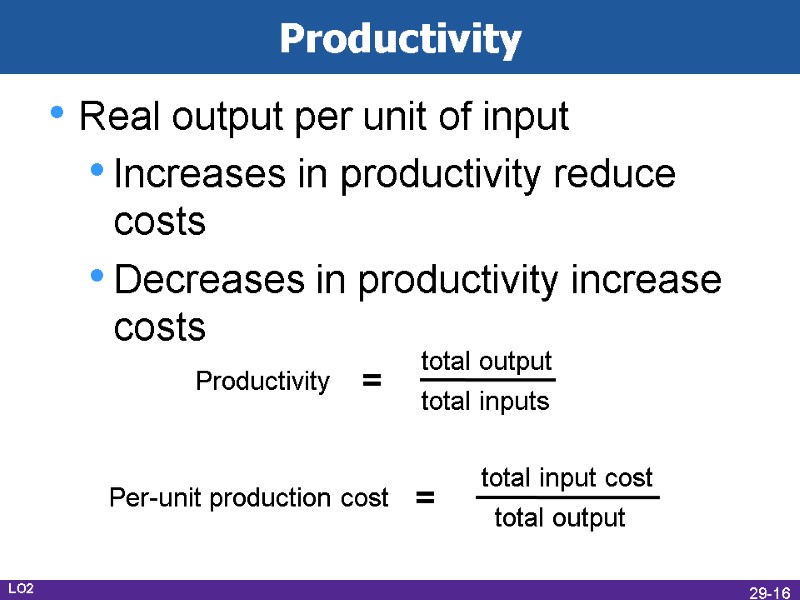 Productivity Real output per unit of input Increases in productivity reduce costs Decreases in productivity increase costs LO2 29-16
 Legal-Institutional Environment Legal changes alter per-unit costs of output Taxes and subsidies Extent of government regulation LO2 29-17
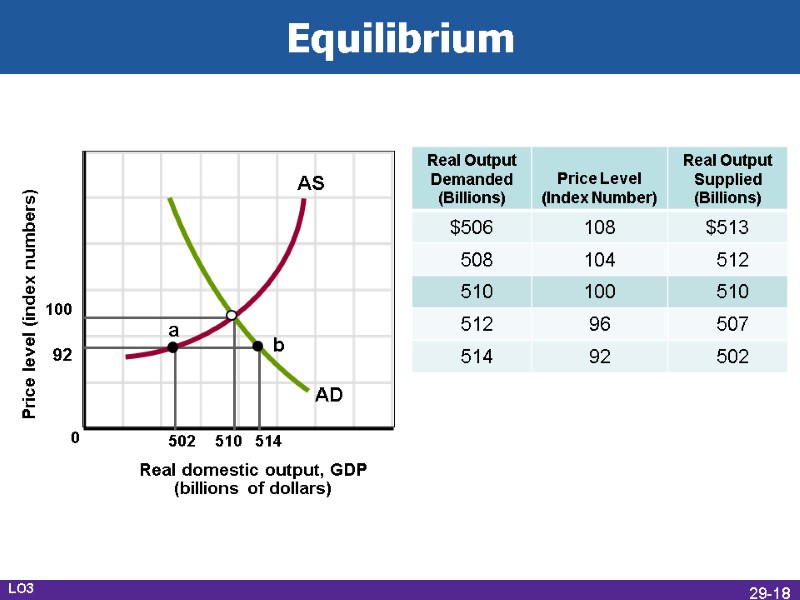 Equilibrium 100 92 502 510 514 a b AD AS 0 LO3 29-18
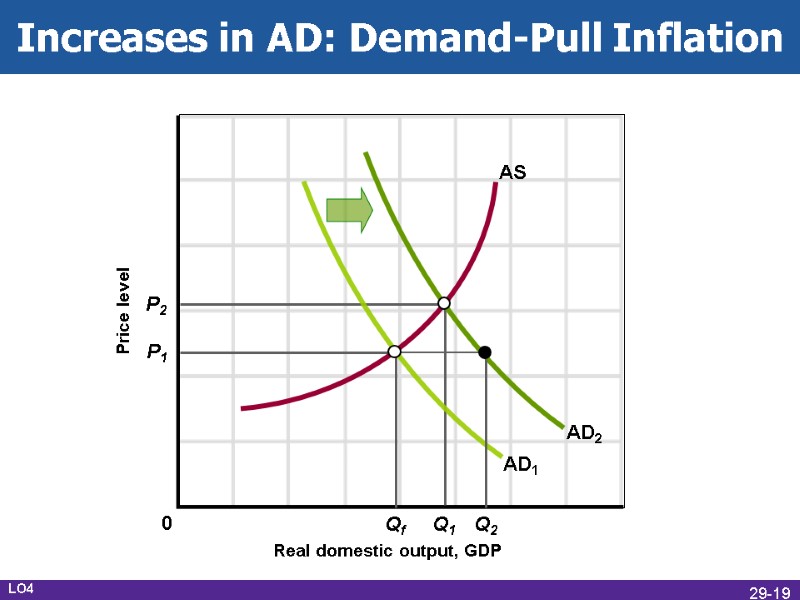 Increases in AD: Demand-Pull Inflation Real domestic output, GDP Price level AD1 AS P1 P2 Q2 Q1 Qf AD2 0 LO4 29-19
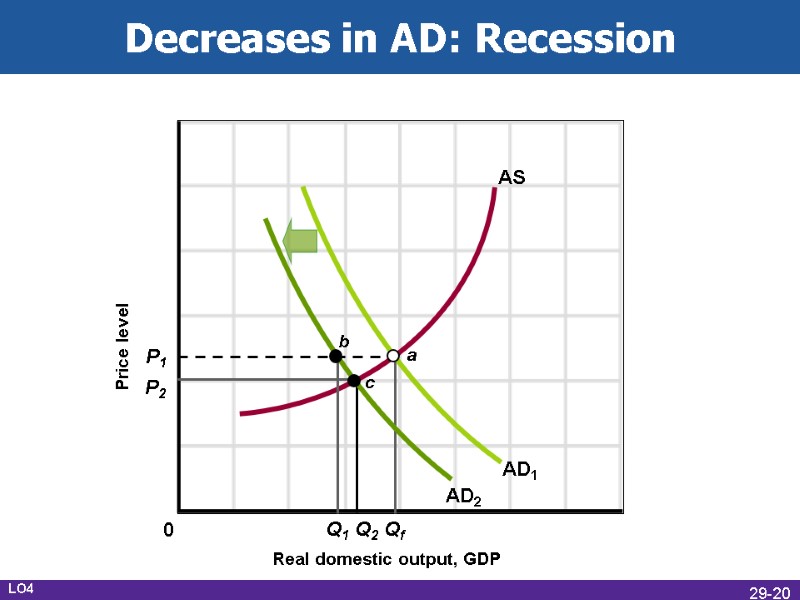 Decreases in AD: Recession Real domestic output, GDP Price level AD1 AS P1 P2 Q1 Q2 Qf AD2 c a b 0 LO4 29-20
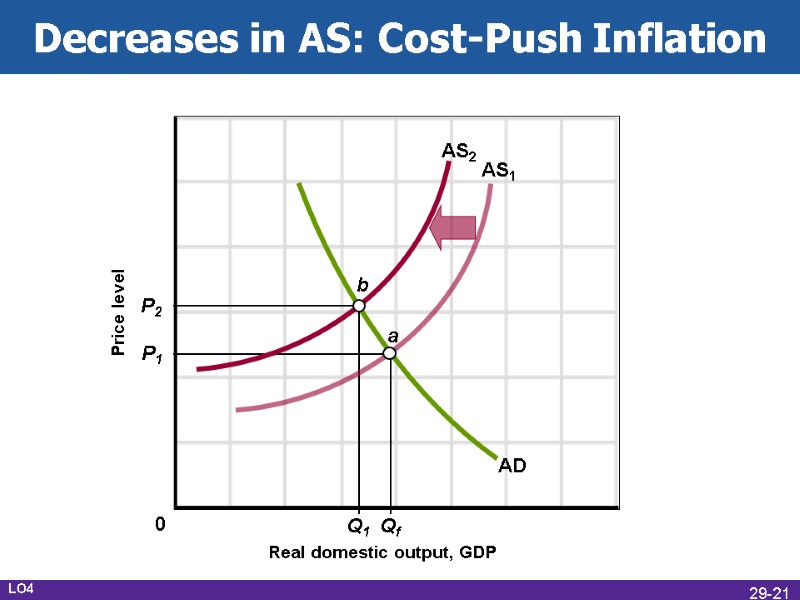 Decreases in AS: Cost-Push Inflation Real domestic output, GDP Price level AD AS1 P1 P2 Q1 Qf AS2 a b 0 LO4 29-21
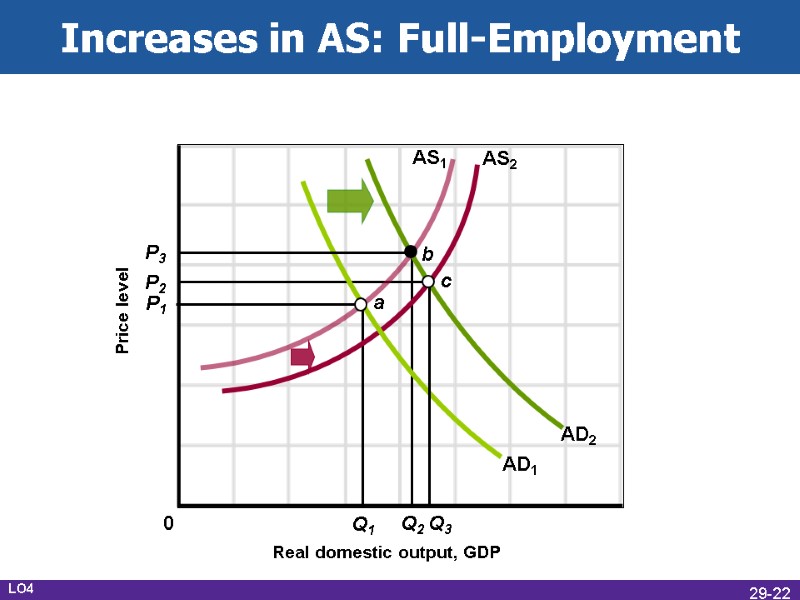 Increases in AS: Full-Employment Real domestic output, GDP Price level AD1 AS2 P1 P2 Q2 Q1 AS1 b AD2 c P3 Q3 a 0 LO4 29-22


