
Aggregate Demand Aggregate Supply 29 Mc. Graw-Hill/Irwin


aggregate_demand_and_aggregate_supply.ppt
- Размер: 795.5 Кб
- Количество слайдов: 22
Описание презентации Aggregate Demand Aggregate Supply 29 Mc. Graw-Hill/Irwin по слайдам
Aggregate Demand Aggregate Supply 29 Mc. Graw-Hill/Irwin Copyright © 2012 by The Mc. Graw-Hill Companies, Inc. All rights reserved.
Aggregate Demand • Real GDP desired at each price level • Inverse relationship • Real balances effect • Interest effect • Foreign purchases effect LO 1 29 —
Aggregate Demand Real domestic output, GDPP rice le ve l AD LO 1 0 29 —
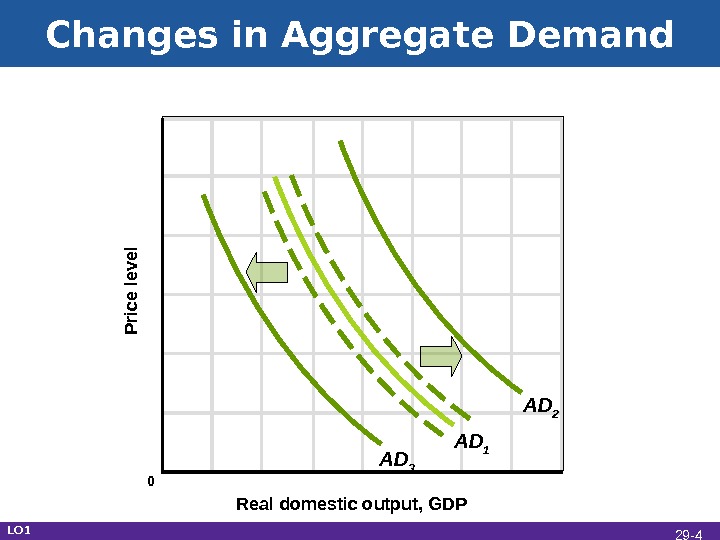
Changes in Aggregate Demand Real domestic output, GDPP rice le ve l AD 1 AD 3 AD 2 LO 1 0 29 —
Consumer Spending • Consumer wealth • Household borrowing • Consumer expectations • Personal taxes LO 1 29 —
Investment Spending • Real interest rates • Expected returns • Expectations about future business conditions • Technology • Degree of excess capacity • Business taxes LO 1 29 —
Government Spending • Government spending increases • Aggregate demand increases (as long as interest rates and tax rates do not change) • More transportation projects • Government spending decreases • Aggregate demand decreases • Less military spending LO 1 29 —
Net Export Spending • National income abroad • Exchange rates • Dollar depreciation • Dollar appreciation LO 1 29 —
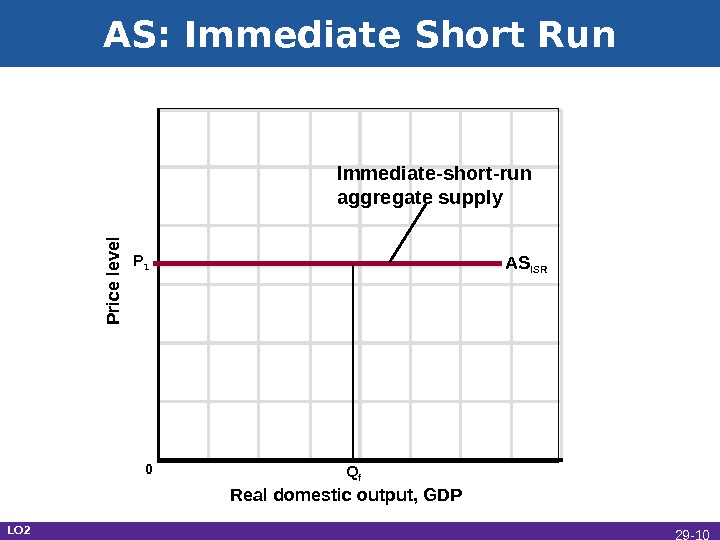
Aggregate Supply • Total real output produced at each price level • Relationship depends on time horizon • Immediate short run • Short run • Long run LO 2 29 —
AS: Immediate Short Run Real domestic output, GDPP rice le ve l AS ISR Q f. Immediate-short-run aggregate supply P 1 0 LO 2 29 —
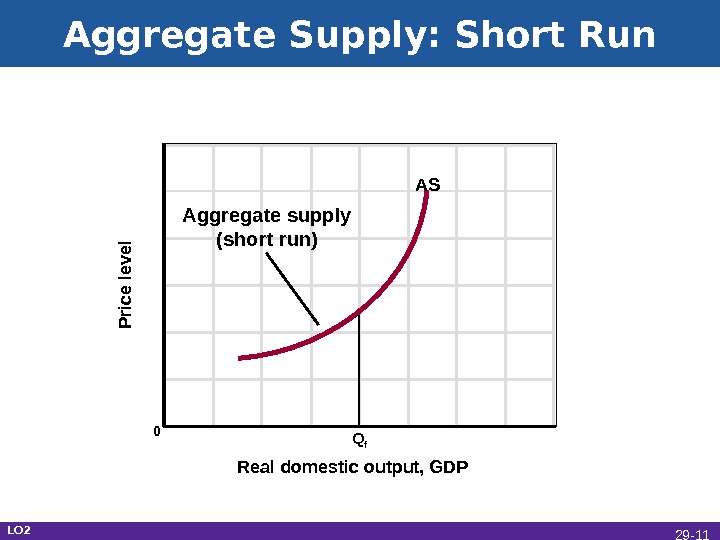
Aggregate Supply: Short Run Real domestic output, GDPP rice le ve l 0 Q f AS Aggregate supply (short run) LO 2 29 —
Aggregate Supply: Long Run Real domestic output, GDPP rice le ve l AS LR Q f 0 Long-run aggregate supply LO 2 29 —
Changes in Aggregate Supply • Determinants of aggregate supply • Shift factors • Collectively position the AS curve • Changes raise or lower per-unit production costs LO 2 29 —
Changes in Aggregate Supply Real domestic output, GDPP rice le ve l AS 1 AS 3 AS 2 0 LO 2 29 —
Input Prices • Domestic resource prices • Labor • Capital • Land • Prices of imported resources • Imported oil • Exchange rates LO 2 29 —
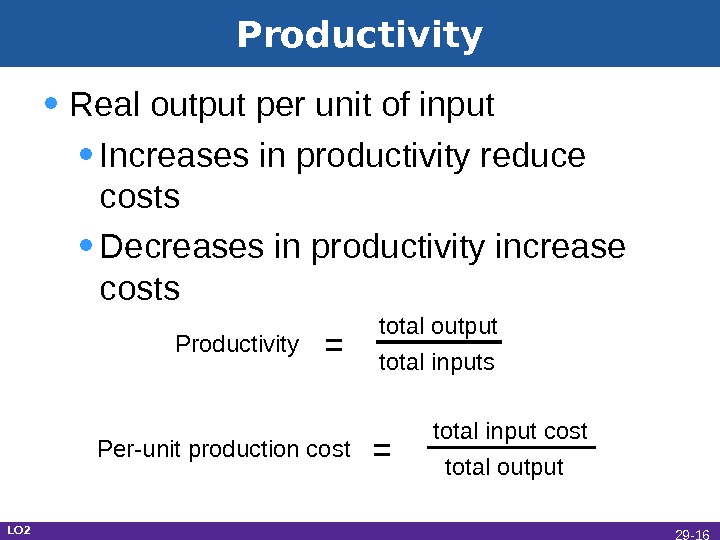
Productivity • Real output per unit of input • Increases in productivity reduce costs • Decreases in productivity increase costs LO 2 Per-unit production cost = total input cost total output. Productivity = total output total inputs 29 —
Legal-Institutional Environment • Legal changes alter per-unit costs of output • Taxes and subsidies • Extent of government regulation LO 2 29 —
Equilibrium Real domestic output, GDP (billions of dollars)P rice level (index num bers)100 92 502 510 514 a b ADAS Real Output Demanded (Billions) Price Level (Index Number) Real Output Supplied (Billions) $506 108 $513 508 104 512 510 100 512 96 507 514 92 502 0 LO 3 29 —
Increases in AD: Demand-Pull Inflation Real domestic output, GDPP rice level AD 1 AS P 1 P 2 Q 2 Q 1 Q f AD 2 0 LO 4 29 —
Decreases in AD: Recession Real domestic output, GDPP rice level AD 1 AS P 1 P 2 Q 1 Q 2 Q f AD 2 c ab 0 LO 4 29 —
Decreases in AS: Cost-Push Inflation Real domestic output, GDPP rice level ADAS 1 P 1 P 2 Q 1 Q f AS 2 ab 0 LO 4 29 —
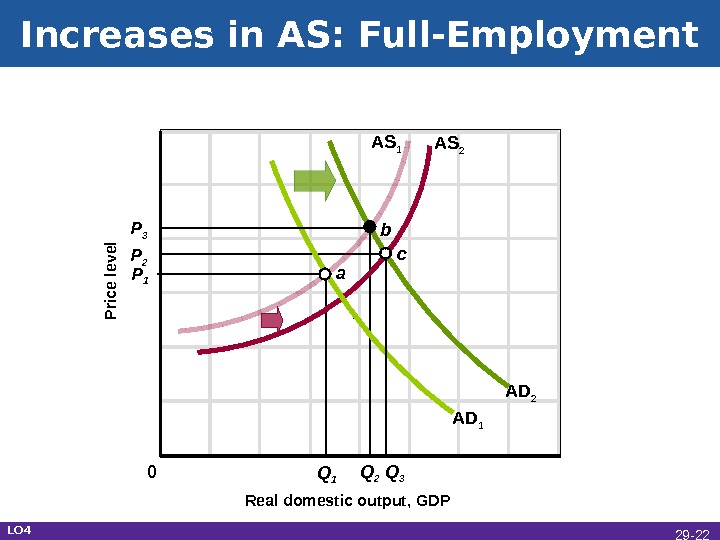
Increases in AS: Full-Employment Real domestic output, GDPP rice level AD 1 AS 2 P 1 P 2 Q 2 Q 1 AS 1 b AD 2 c. P 3 Q 3 a 0 LO 4 29 —