

b0902d15ebfa0958c4a3192fa58dd507.ppt
- Количество слайдов: 65
 Agenda • • • Overview Why Trans. CAD Challenges/tips Initiatives Applications
 Overview
 Role of Statewide Planning • Transportation planning and policy guidance • 3 C process • Planning tools • Travel demand modeling • Project level forecasts
 Organizational Structure
 Model Research and Development Team • Technical service center for the branch • Provide expertise, research, and training in travel modeling • Advance travel modeling and analysis for the State of North Carolina • 6 positions for advanced modeling
 Planning Groups • MPO/RPO planning – 17 MPOs – 20 RPOs – Modeling for communities greater than 10, 000 population • 40 positions for planning/modeling
 Trans. CAD Modeling Status • 3 regional models under development – Covering 9 MPOs • 6 Trans. CAD MPO models currently in use – Developed ground up/converted • 6 Trans. CAD MPO models in progress – Upgrades/new starts • 10 non-MPO models
 NCDOT Modeling Improvement Goals • Develop “best modeling practices. ” • Investigation of model improvements • New procedures to better address land use feedback • Tools to improve efficiency and reliability
 Why Trans. CAD?
 Why NCDOT Decided to Switch Platforms? • Older platform no longer supported • Limited capabilities – Graphics, network size, TAZs • More GIS integration – Movement towards GIS based analysis – Compatible with Arc. GIS – Ability to do spatial analysis
 Why Trans. CAD? Diverse Users • • Advanced developers Developers Advanced end users Basic end users
 Why Trans. CAD? General • Windows based • Scenario manager for easy file management • Visualization • Data and database • GISDK
 Why Trans. CAD? GIS Capabilities • Integration of GIS tools and technologies • Improved linkage between land use, transportation, and air quality • Development of database structures • Application batch files, GIS tools, and Graphical Users Interface
 Why Trans. CAD? Modeling Process • Data – Interface with Arc. GIS – GIS database – Existing data sources (census, others) – Visualization
 Why Trans. CAD? Modeling Process • Networks – GIS database with unlimited attribute capabilities – GIS distances and shapes – Database linkages to other data sets
 Why Trans. CAD? Modeling Process • Trip generation – – Robust cross classification model GISDK programming for custom applications Unlimited trip purposes Multiple variables can be stored in TAZ land use data base or linked via parcel data base
 Why Trans. CAD? Modeling Process • Trip distribution – Geocode survey data to determine trip lengths – Visualize desire lines between zones or districts – Utilize curve functions for friction factors in place of lookup table
 Why Trans. CAD? Modeling Process • Mode choice – Built in procedures for streamlined transit analysis – Use GISDK to customize nested LOGIT model
 Why Trans. CAD? Modeling Process • Traffic assignment – Easy time of day analysis – User defined link volume-delay equation – Multiple assignment algorithms – Comparison tools for evaluating different assignments
 Why Trans. CAD? Modeling Process • Performance measures – Use database fields to easily query link types for evaluation – GISDK allows for consistent checking and reporting of model results – Visualization of results – Screenline analysis – User log available
 Challenges/tips
 Challenges/tips Conversion Process • TIP: recommended for immediate use of Trans. CAD on existing models • TRIP: converted base is NOT ready to go • TIP: use performance measures to build confidence in converted model - will need to adjust for differences • TRIP: Trans. CAD recognizes real numbers will account for differences
 Challenges/tips • • • Think about things differently File management Dataview save MAP save Powerful computer
 Initiatives
 Initiatives • • Training Standards Users group Applications
 Applications
 GISDK Tools for Travel Demand Modeling Model Research & Development Unit NCDOT Statewide Planning Branch
 provides you with a tool kit that") The Geographic Information System Developer’s Kit (GISDK) provides you with a tool kit that you can use to get outside the box and customize Trans. CAD in any way you desire.
The Geographic Information System Developer’s Kit (GISDK) provides you with a tool kit that you can use to get outside the box and customize Trans. CAD in any way you desire.
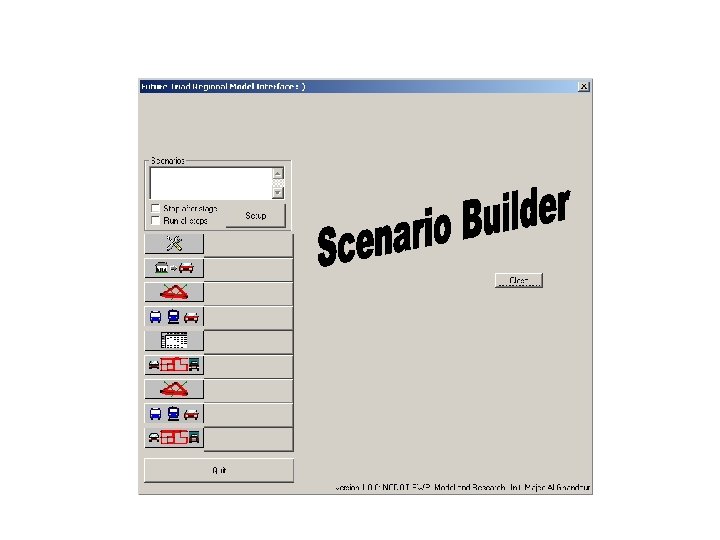
 Model Team Goal: Process Improvement Through the development of applications tools for streamlining the model development process 30
 Meeting the Process Improvement Goal • • Data management tool Trip generation tool Performance management tool Miscellaneous tools 31
 Data Management
 Old Way of Managing Model Data • Create separate fields for attribute data: – Travel time, capacity, ADT, facility type, functional classification, etc. • Enter data using Trans. CAD interface • Create multiple geographic files for different alternatives 33
 Disadvantages of the Old Way • Manual recalculation of travel times and other attribute data • Current data entry approach is time consuming and prone to errors • Maintaining multiple geographic files is cumbersome and requires more disk space • Maintaining multiple geographic files increases the chance of introducing errors in the files 34
 Model Data Management Tools 35
 Model Data Management Tools • Trans. CAD GISDK script • Select data values automatically calculated – Travel time, 1 -way attributes, facility type, etc • Easy user interface for entering data • Provides a data management system for multiple model alternatives • Alternatives managed from master file 36
 Benefits of Using Data Management Tools • • • Reduced errors Increased efficiency Eliminates duplicated data Requires less disk space Maintains the consistency of the model data Standardizes model data management 37
 Calculate Travel Time Tool Calculates travel time, 1 way capacity, 1 -way ADT, facility code and functional classification code automatically every time data is changed 38
 to enter or modify") Enter Base Data Tool Provides a GUI (graphic user interface) to enter or modify base model data for single or multiple links 39
Enter Base Data Tool Provides a GUI (graphic user interface) to enter or modify base model data for single or multiple links 39
 Build Base Network Tool Builds the base network from the master line layer 40
 Identify New Link Tool Identifies the future links that are not in the base network 41
 Enter Alternative Data Tool Provides a GUI to enter or modify alternative network data for single or multiple links 42
 Build Network Alternative Tool Builds the network alternative from the master line layer 43
 Trip Generation
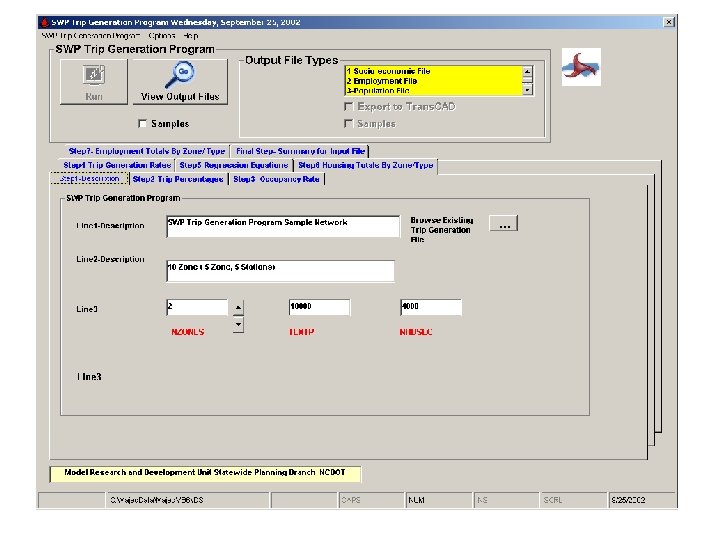
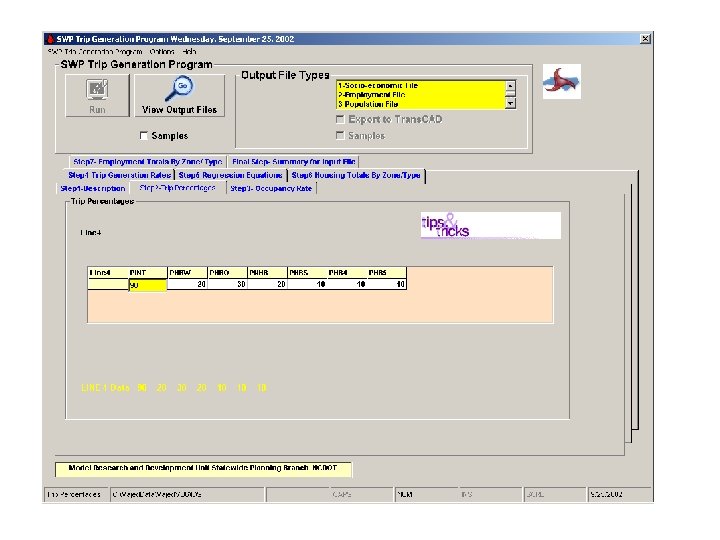
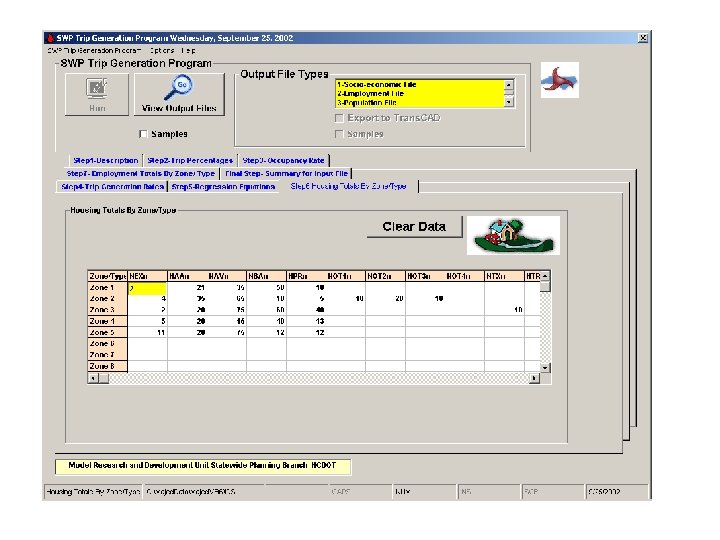
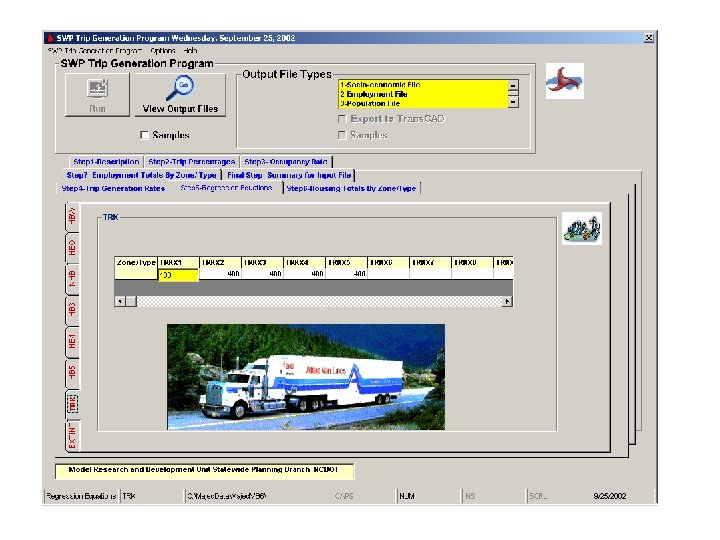
 NCDOT Trip Generation Procedure • Average trip rate per household • Percentage applied to total trips to determine trips by trip purpose • Accounts for CV trips and non-home based trips by non-residents • Data input in ASCII format and executed in C+ program 45
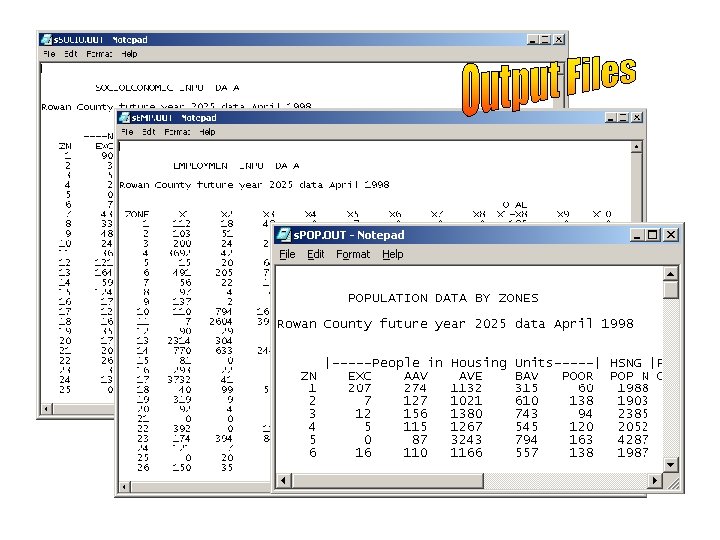
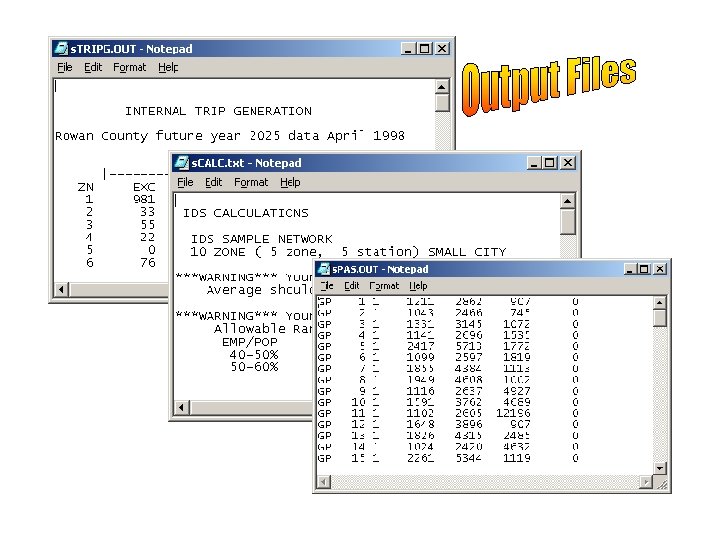
 Disadvantages of the Old Way • Data input methodology is cumbersome and prone to data entry error • No ability to visualize data • User cannot easily interpret the data 46
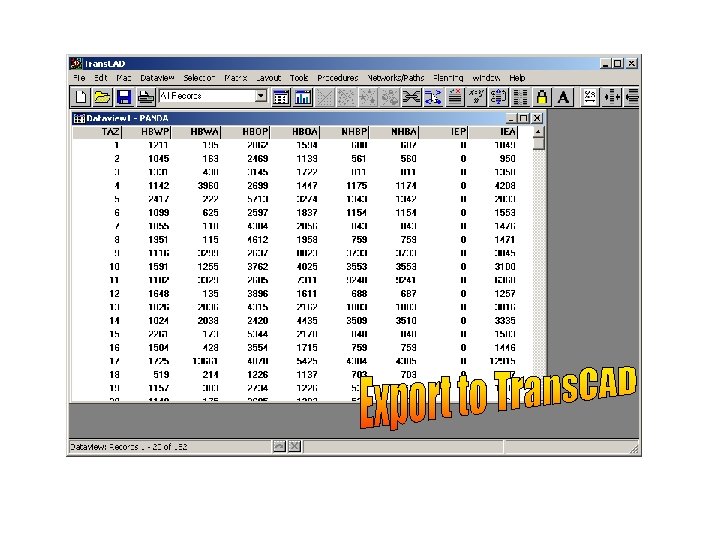
 Benefits of Using Trip Generation Tool • • Reduced errors Increased efficiency Eliminates duplicated data Trans. CAD data file facilitates visualization of data 47

 Performance Management
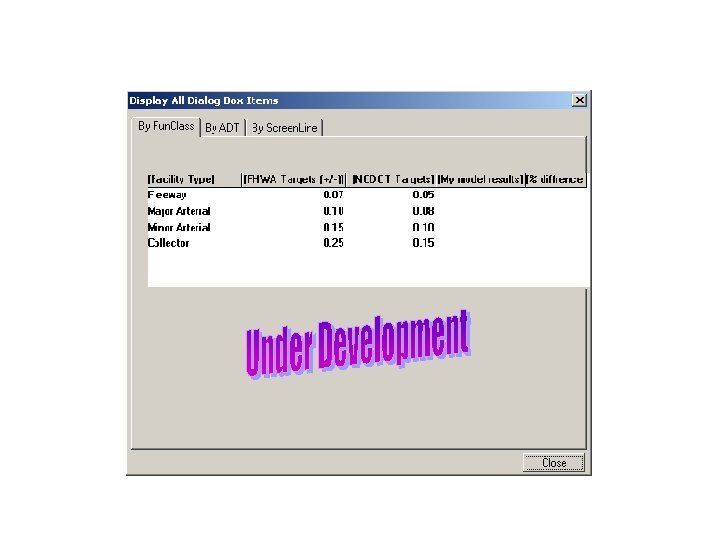
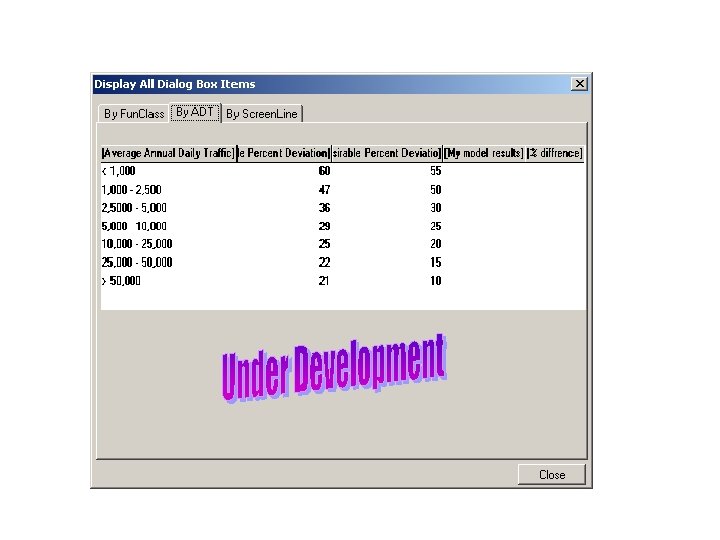
 Model Calibration and Validation • Iterative process • Based on observed data and reasonableness checking • GOAL: model performing within acceptable standards • Resources – Http: //tmip. Fhwa. Dot. Gov/clearinghouse/docs/mvrcm – Http: //ntl. Bts. Gov/docs/377 cas. Html 58
 Benefits of Using Performance Management Tool • • • Standardization Increased efficiency Process is automated Reduced user error Great reporting tool 59
 Miscellaneous Tools
 For the things we have to learn before we can do them, we learn by doing them. -Aristotle