7be9e1d25566880aac5df8dfb079d9df.ppt
- Количество слайдов: 44
Advanced Kernel Debugging Andre Vachon Software Development Lead Windows Product Feedback Microsoft Corporation
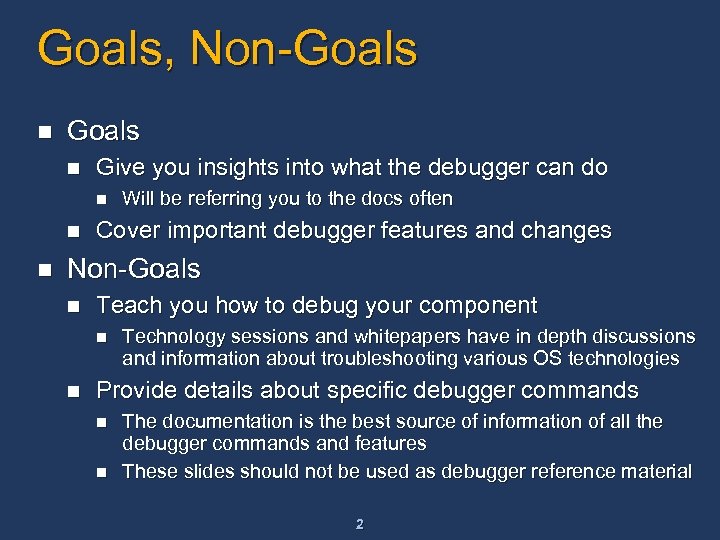
Goals, Non-Goals n Give you insights into what the debugger can do n n n Will be referring you to the docs often Cover important debugger features and changes Non-Goals n Teach you how to debug your component n n Technology sessions and whitepapers have in depth discussions and information about troubleshooting various OS technologies Provide details about specific debugger commands n n The documentation is the best source of information of all the debugger commands and features These slides should not be used as debugger reference material 2
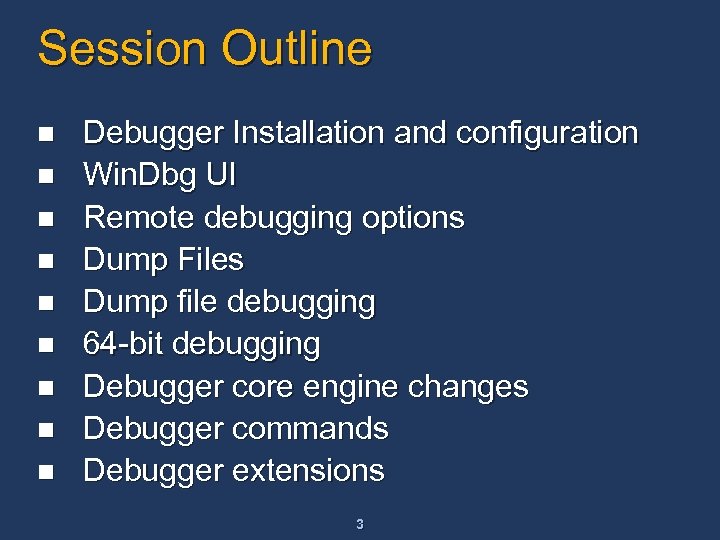
Session Outline n n n n n Debugger Installation and configuration Win. Dbg UI Remote debugging options Dump Files Dump file debugging 64 -bit debugging Debugger core engine changes Debugger commands Debugger extensions 3
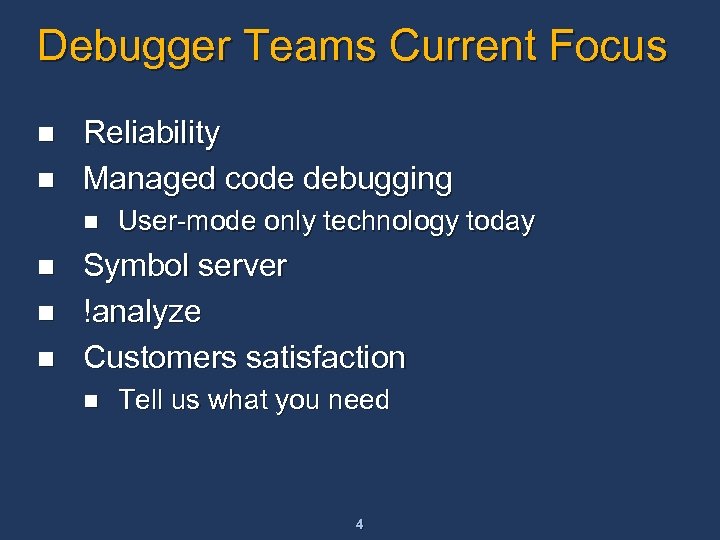
Debugger Teams Current Focus n n Reliability Managed code debugging n n User-mode only technology today Symbol server !analyze Customers satisfaction n Tell us what you need 4
Debugger Install n Always get the latest release n n n We support all target OS versions back to Windows NT 4. 0 SP 3 We support all host OS versions back to Windows NT 4. 0 SP 3 n n n Latest releases are the most reliable, with most fixes http: //www. microsoft. com/whdc/ddk/debugging The debugger in the DDK and SDK are out-of-date, only there for convenience Both user mode and kernel mode debugging Windows 9 x kernel debugging is not supported The package contains n Docs – debugger. chm – this is your friend! n n Information about all debugger commands, extensions and tools All the debuggers (Win. Dbg, CDB, NTSD, KD) and supporting DLLs Extensions for all OS versions - right versions are loaded automatically Variety of other debugger related tools n ADPlus, GFlags, KDbg. Ctrl, Logger, etc. 5
Common Issues n Local variables are wrong n n Breakpoint issues n n n Disable 1394 host controller on the target COM port debugging won’t connect n n Report it! We don’t release until all known bugs are fixed 1394 debugging won’t connect n n Bp sets a breakpoint on an address; Bu sets a breakpoint on a symbol Use the “bu” command if you want to save breakpoints in the workspace, or want them to work across module loadunloadload “I found a debugger problem” n n Turn off compiler optimizations Disable legacy USB support in the BIOS USB 2. 0 debugging n Initial trial implementation is now available - requires a special USB cable 6
Win. Dbg Docked Windows n Win. Dbg windows can be floating or docked n n Win. Dbg supports multiple docks n n Individual Win. Dbg windows can be part of any dock Can be moved to any dock at any time New windows We recommend all windows be docked n n Docked windows shrink and grow with the Win. Dbg frame they belong to Docked window positions and sizes stay relative to each other as the frame changes Undocked (a. k. a. , floating) windows are always on top of the Win. Dbg window Use multiple docks on a multimon system Ctrl-Tab iterates through all windows in all docks 7
Win. Dbg Tabbed Windows n n Win. Dbg windows that are part of a dock can be tabbed Tabbed windows are overlaid They are resized as a group when an edge is dragged When a tabbed window is dragged to another location, it is moved individually 8
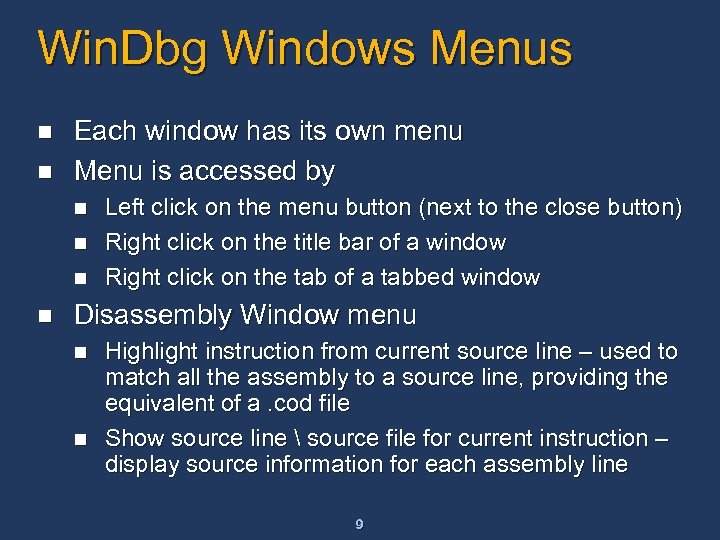
Win. Dbg Windows Menus n n Each window has its own menu Menu is accessed by n n Left click on the menu button (next to the close button) Right click on the title bar of a window Right click on the tab of a tabbed window Disassembly Window menu n n Highlight instruction from current source line – used to match all the assembly to a source line, providing the equivalent of a. cod file Show source line source file for current instruction – display source information for each assembly line 9
Win. Dbg Demo n n Docked windows Multiple docks Tabbed source windows Highlight assembly instructions for current source line 10
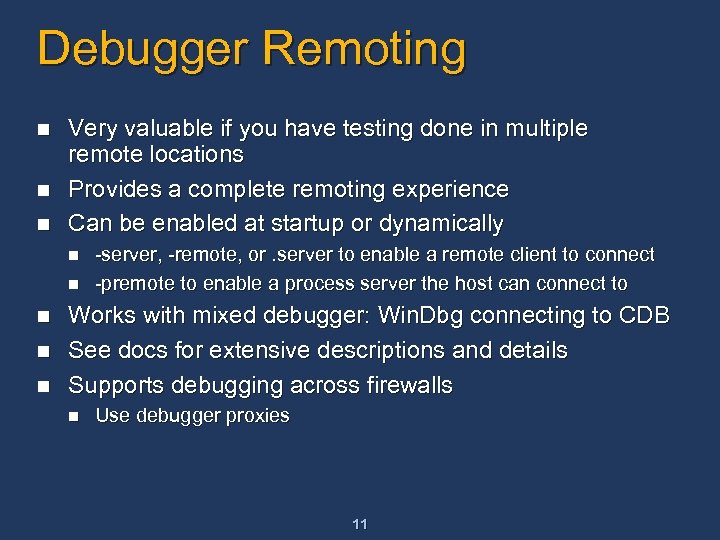
Debugger Remoting n n n Very valuable if you have testing done in multiple remote locations Provides a complete remoting experience Can be enabled at startup or dynamically n n n -server, -remote, or. server to enable a remote client to connect -premote to enable a process server the host can connect to Works with mixed debugger: Win. Dbg connecting to CDB See docs for extensive descriptions and details Supports debugging across firewalls n Use debugger proxies 11
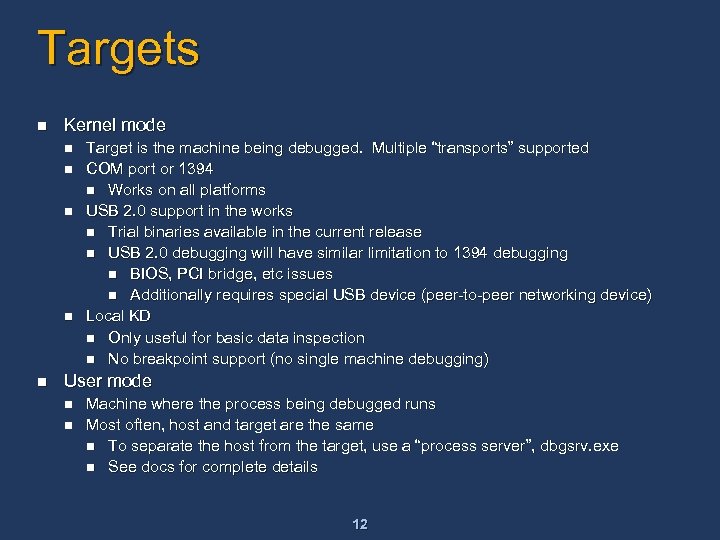
Targets n Kernel mode n n n Target is the machine being debugged. Multiple “transports” supported COM port or 1394 n Works on all platforms USB 2. 0 support in the works n Trial binaries available in the current release n USB 2. 0 debugging will have similar limitation to 1394 debugging n BIOS, PCI bridge, etc issues n Additionally requires special USB device (peer-to-peer networking device) Local KD n Only useful for basic data inspection n No breakpoint support (no single machine debugging) User mode n n Machine where the process being debugged runs Most often, host and target are the same n To separate the host from the target, use a “process server”, dbgsrv. exe n See docs for complete details 12
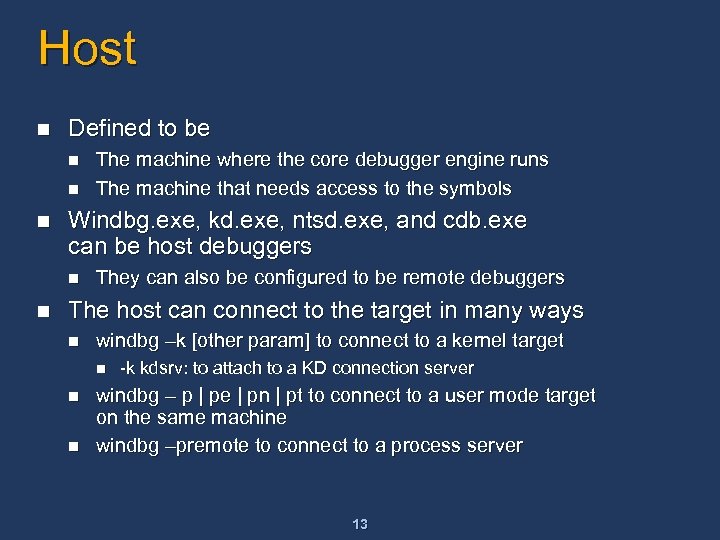
Host n Defined to be n n n Windbg. exe, kd. exe, ntsd. exe, and cdb. exe can be host debuggers n n The machine where the core debugger engine runs The machine that needs access to the symbols They can also be configured to be remote debuggers The host can connect to the target in many ways n windbg –k [other param] to connect to a kernel target n n n -k kdsrv: to attach to a KD connection server windbg – p | pe | pn | pt to connect to a user mode target on the same machine windbg –premote to connect to a process server 13
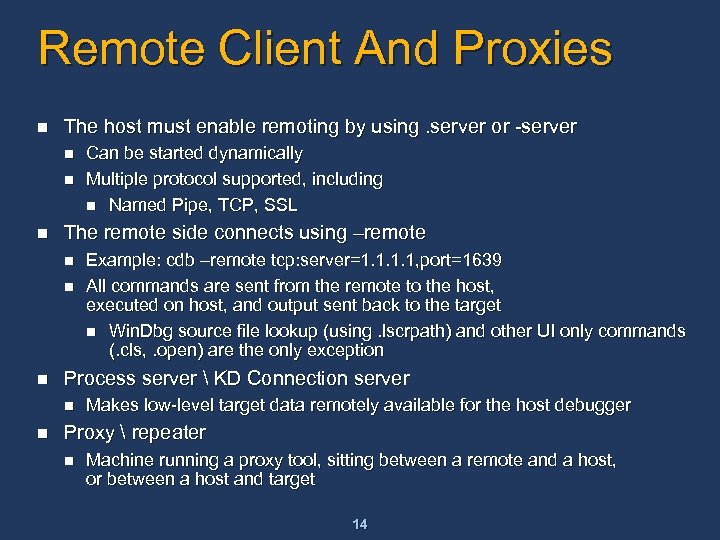
Remote Client And Proxies n The host must enable remoting by using. server or -server n n n The remote side connects using –remote n n n Example: cdb –remote tcp: server=1. 1, port=1639 All commands are sent from the remote to the host, executed on host, and output sent back to the target n Win. Dbg source file lookup (using. lscrpath) and other UI only commands (. cls, . open) are the only exception Process server KD Connection server n n Can be started dynamically Multiple protocol supported, including n Named Pipe, TCP, SSL Makes low-level target data remotely available for the host debugger Proxy repeater n Machine running a proxy tool, sitting between a remote and a host, or between a host and target 14
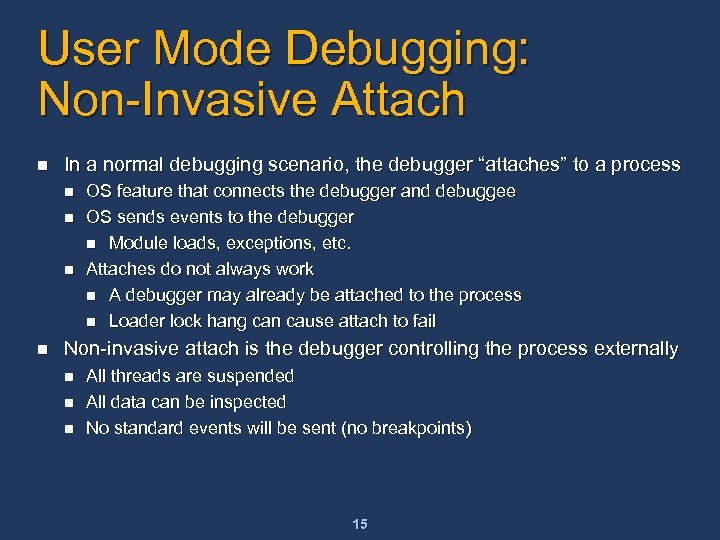
User Mode Debugging: Non-Invasive Attach n In a normal debugging scenario, the debugger “attaches” to a process n n OS feature that connects the debugger and debuggee OS sends events to the debugger n Module loads, exceptions, etc. Attaches do not always work n A debugger may already be attached to the process n Loader lock hang can cause attach to fail Non-invasive attach is the debugger controlling the process externally n n n All threads are suspended All data can be inspected No standard events will be sent (no breakpoints) 15
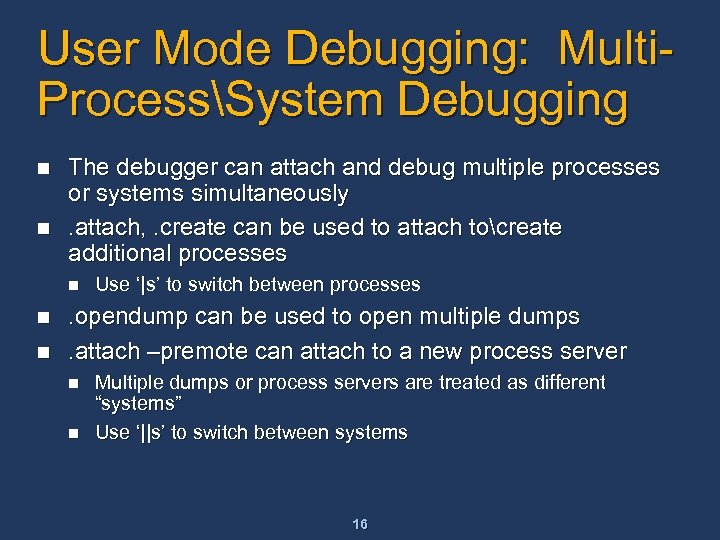
User Mode Debugging: Multi. ProcessSystem Debugging n n The debugger can attach and debug multiple processes or systems simultaneously. attach, . create can be used to attach tocreate additional processes n n n Use ‘|s’ to switch between processes . opendump can be used to open multiple dumps. attach –premote can attach to a new process server n n Multiple dumps or process servers are treated as different “systems” Use ‘||s’ to switch between systems 16
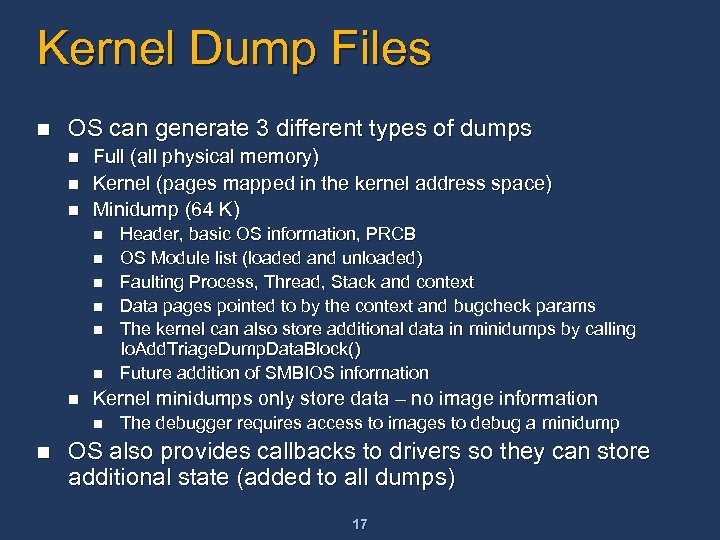
Kernel Dump Files n OS can generate 3 different types of dumps n n n Full (all physical memory) Kernel (pages mapped in the kernel address space) Minidump (64 K) n n n n Kernel minidumps only store data – no image information n n Header, basic OS information, PRCB OS Module list (loaded and unloaded) Faulting Process, Thread, Stack and context Data pages pointed to by the context and bugcheck params The kernel can also store additional data in minidumps by calling Io. Add. Triage. Dump. Data. Block() Future addition of SMBIOS information The debugger requires access to images to debug a minidump OS also provides callbacks to drivers so they can store additional state (added to all dumps) 17
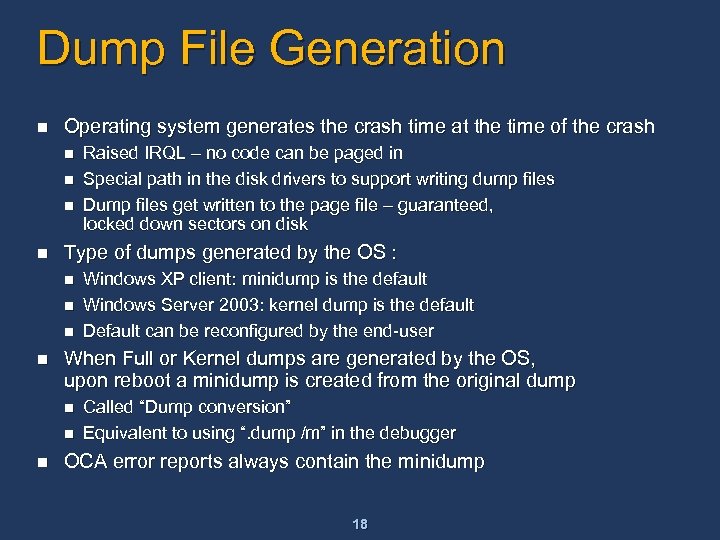
Dump File Generation n Operating system generates the crash time at the time of the crash n n Type of dumps generated by the OS : n n Windows XP client: minidump is the default Windows Server 2003: kernel dump is the default Default can be reconfigured by the end-user When Full or Kernel dumps are generated by the OS, upon reboot a minidump is created from the original dump n n n Raised IRQL – no code can be paged in Special path in the disk drivers to support writing dump files Dump files get written to the page file – guaranteed, locked down sectors on disk Called “Dump conversion” Equivalent to using “. dump /m” in the debugger OCA error reports always contain the minidump 18
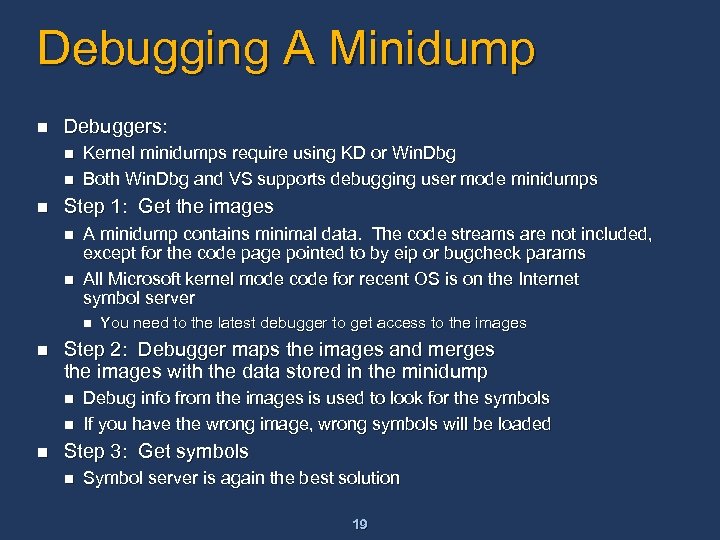
Debugging A Minidump n Debuggers: n n n Kernel minidumps require using KD or Win. Dbg Both Win. Dbg and VS supports debugging user mode minidumps Step 1: Get the images n n A minidump contains minimal data. The code streams are not included, except for the code page pointed to by eip or bugcheck params All Microsoft kernel mode code for recent OS is on the Internet symbol server n n Step 2: Debugger maps the images and merges the images with the data stored in the minidump n n n You need to the latest debugger to get access to the images Debug info from the images is used to look for the symbols If you have the wrong image, wrong symbols will be loaded Step 3: Get symbols n Symbol server is again the best solution 19
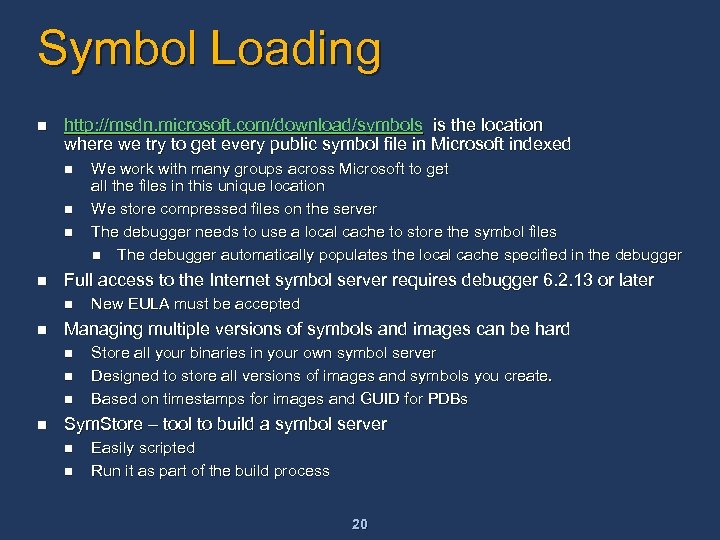
Symbol Loading n http: //msdn. microsoft. com/download/symbols is the location where we try to get every public symbol file in Microsoft indexed n n Full access to the Internet symbol server requires debugger 6. 2. 13 or later n n New EULA must be accepted Managing multiple versions of symbols and images can be hard n n We work with many groups across Microsoft to get all the files in this unique location We store compressed files on the server The debugger needs to use a local cache to store the symbol files n The debugger automatically populates the local cache specified in the debugger Store all your binaries in your own symbol server Designed to store all versions of images and symbols you create. Based on timestamps for images and GUID for PDBs Sym. Store – tool to build a symbol server n n Easily scripted Run it as part of the build process 20
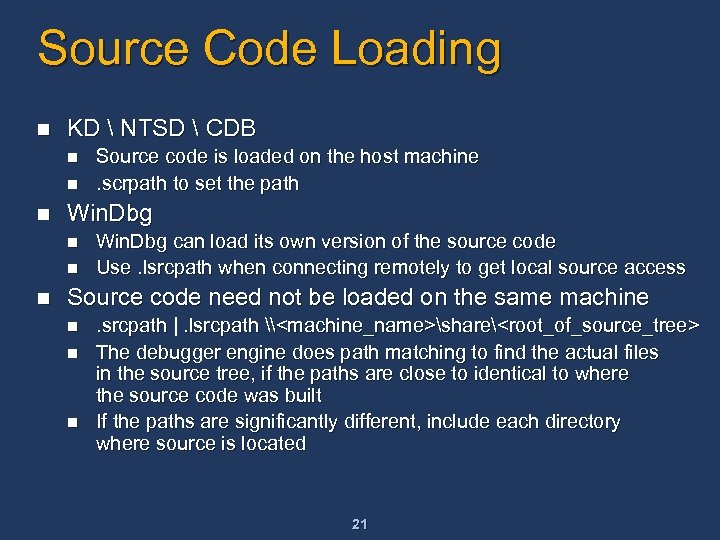
Source Code Loading n KD NTSD CDB n n n Win. Dbg n n n Source code is loaded on the host machine. scrpath to set the path Win. Dbg can load its own version of the source code Use. lsrcpath when connecting remotely to get local source access Source code need not be loaded on the same machine n n n . srcpath |. lsrcpath \<machine_name>share<root_of_source_tree> The debugger engine does path matching to find the actual files in the source tree, if the paths are close to identical to where the source code was built If the paths are significantly different, include each directory where source is located 21
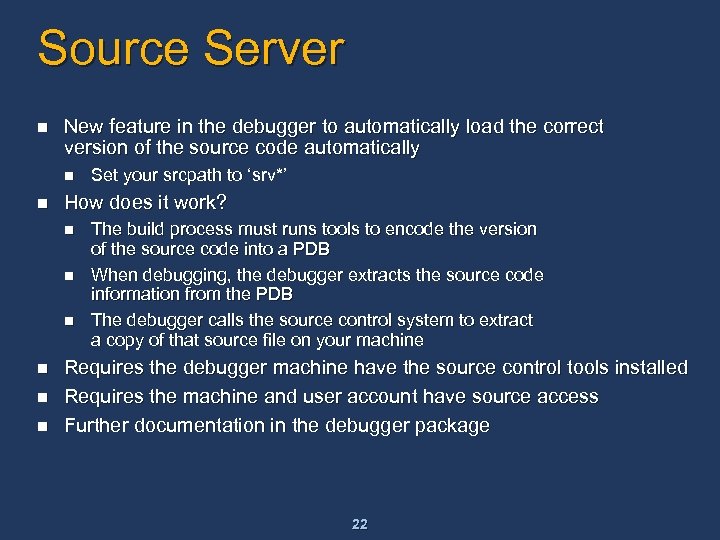
Source Server n New feature in the debugger to automatically load the correct version of the source code automatically n n How does it work? n n n Set your srcpath to ‘srv*’ The build process must runs tools to encode the version of the source code into a PDB When debugging, the debugger extracts the source code information from the PDB The debugger calls the source control system to extract a copy of that source file on your machine Requires the debugger machine have the source control tools installed Requires the machine and user account have source access Further documentation in the debugger package 22
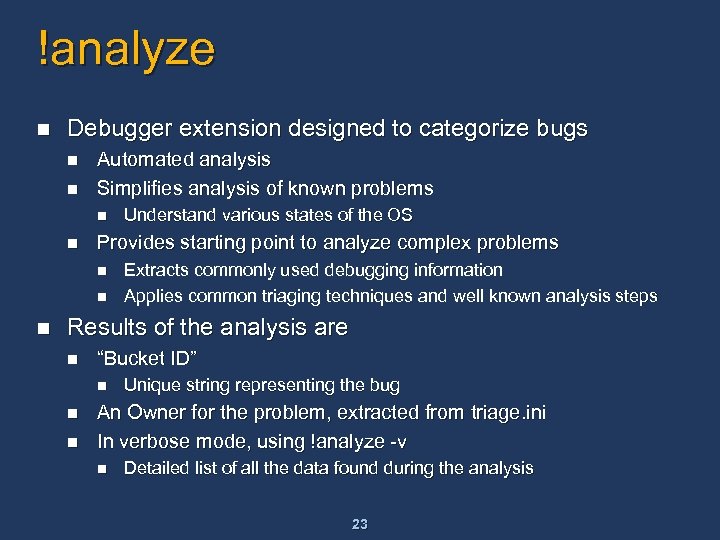
!analyze n Debugger extension designed to categorize bugs n n Automated analysis Simplifies analysis of known problems n n Provides starting point to analyze complex problems n n n Understand various states of the OS Extracts commonly used debugging information Applies common triaging techniques and well known analysis steps Results of the analysis are n “Bucket ID” n n n Unique string representing the bug An Owner for the problem, extracted from triage. ini In verbose mode, using !analyze -v n Detailed list of all the data found during the analysis 23
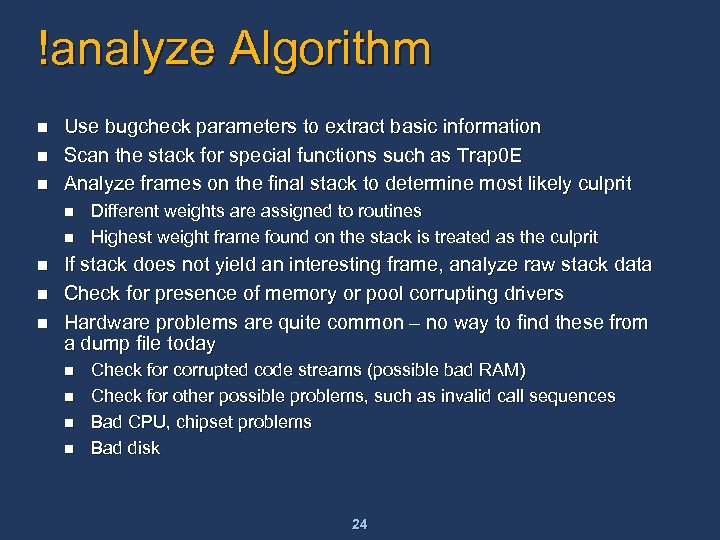
!analyze Algorithm n n n Use bugcheck parameters to extract basic information Scan the stack for special functions such as Trap 0 E Analyze frames on the final stack to determine most likely culprit n n n Different weights are assigned to routines Highest weight frame found on the stack is treated as the culprit If stack does not yield an interesting frame, analyze raw stack data Check for presence of memory or pool corrupting drivers Hardware problems are quite common – no way to find these from a dump file today n n Check for corrupted code streams (possible bad RAM) Check for other possible problems, such as invalid call sequences Bad CPU, chipset problems Bad disk 24
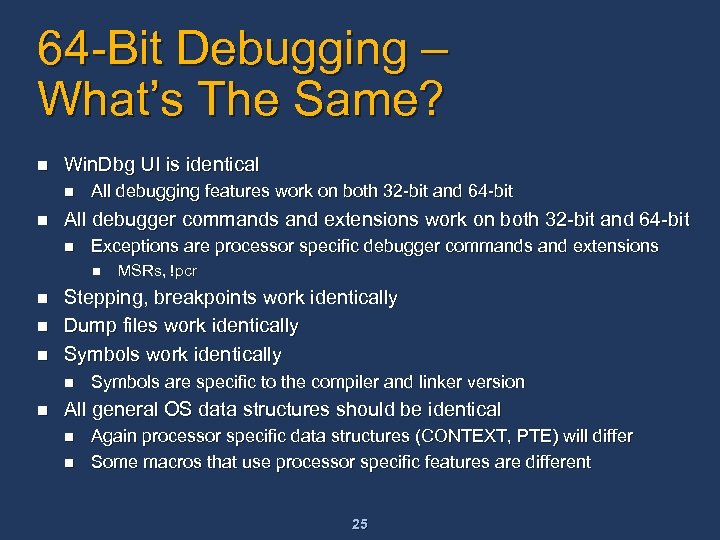
64 -Bit Debugging – What’s The Same? n Win. Dbg UI is identical n n All debugging features work on both 32 -bit and 64 -bit All debugger commands and extensions work on both 32 -bit and 64 -bit n Exceptions are processor specific debugger commands and extensions n n Stepping, breakpoints work identically Dump files work identically Symbols work identically n n MSRs, !pcr Symbols are specific to the compiler and linker version All general OS data structures should be identical n n Again processor specific data structures (CONTEXT, PTE) will differ Some macros that use processor specific features are different 25
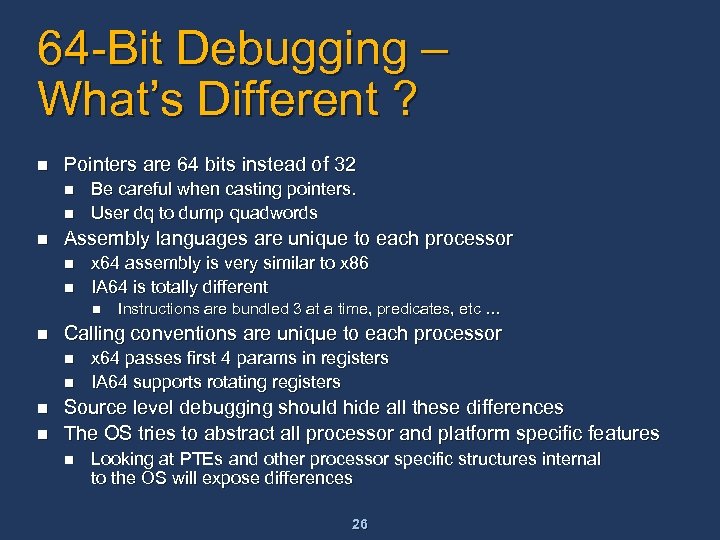
64 -Bit Debugging – What’s Different ? n Pointers are 64 bits instead of 32 n n n Be careful when casting pointers. User dq to dump quadwords Assembly languages are unique to each processor n n x 64 assembly is very similar to x 86 IA 64 is totally different n n Calling conventions are unique to each processor n n Instructions are bundled 3 at a time, predicates, etc … x 64 passes first 4 params in registers IA 64 supports rotating registers Source level debugging should hide all these differences The OS tries to abstract all processor and platform specific features n Looking at PTEs and other processor specific structures internal to the OS will expose differences 26
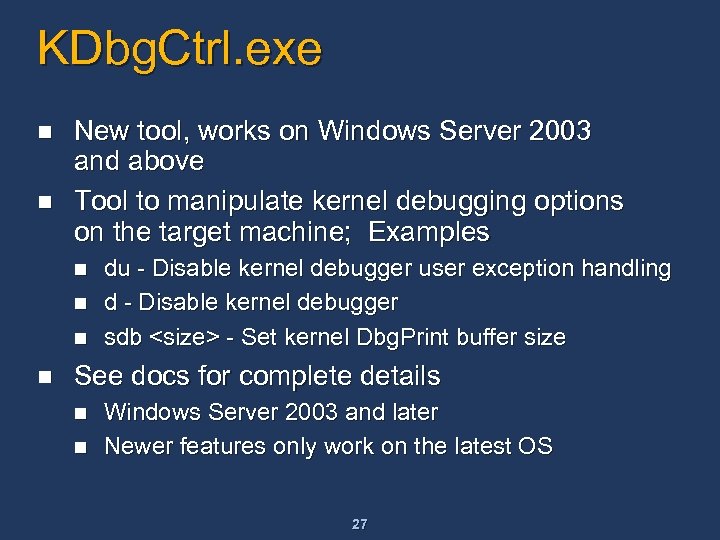
KDbg. Ctrl. exe n n New tool, works on Windows Server 2003 and above Tool to manipulate kernel debugging options on the target machine; Examples n n du - Disable kernel debugger user exception handling d - Disable kernel debugger sdb <size> - Set kernel Dbg. Print buffer size See docs for complete details n n Windows Server 2003 and later Newer features only work on the latest OS 27
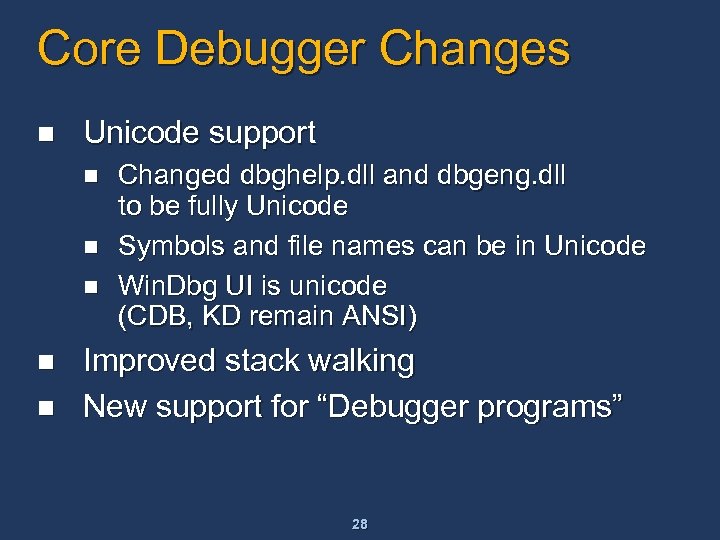
Core Debugger Changes n Unicode support n n n Changed dbghelp. dll and dbgeng. dll to be fully Unicode Symbols and file names can be in Unicode Win. Dbg UI is unicode (CDB, KD remain ANSI) Improved stack walking New support for “Debugger programs” 28
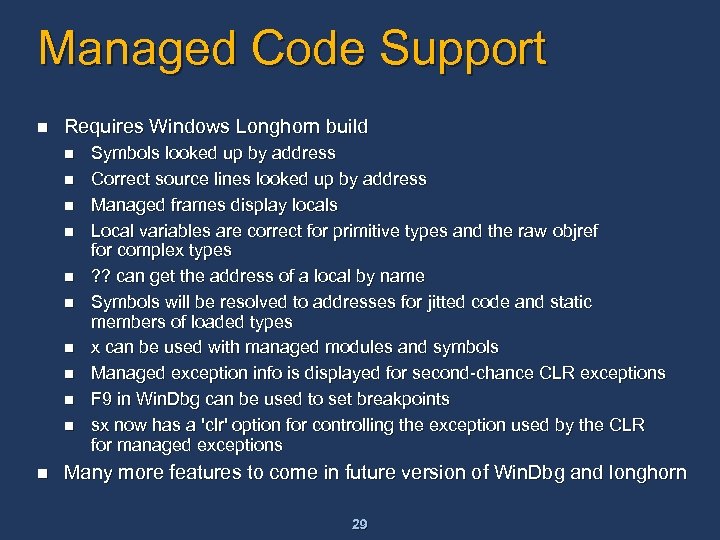
Managed Code Support n Requires Windows Longhorn build n n n Symbols looked up by address Correct source lines looked up by address Managed frames display locals Local variables are correct for primitive types and the raw objref for complex types ? ? can get the address of a local by name Symbols will be resolved to addresses for jitted code and static members of loaded types x can be used with managed modules and symbols Managed exception info is displayed for second-chance CLR exceptions F 9 in Win. Dbg can be used to set breakpoints sx now has a 'clr' option for controlling the exception used by the CLR for managed exceptions Many more features to come in future version of Win. Dbg and longhorn 29
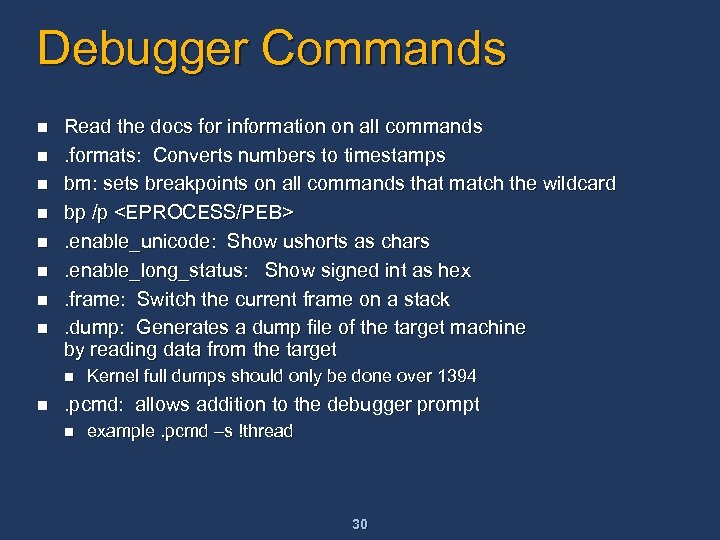
Debugger Commands n n n n Read the docs for information on all commands. formats: Converts numbers to timestamps bm: sets breakpoints on all commands that match the wildcard bp /p <EPROCESS/PEB>. enable_unicode: Show ushorts as chars. enable_long_status: Show signed int as hex. frame: Switch the current frame on a stack. dump: Generates a dump file of the target machine by reading data from the target n n Kernel full dumps should only be done over 1394 . pcmd: allows addition to the debugger prompt n example. pcmd –s !thread 30
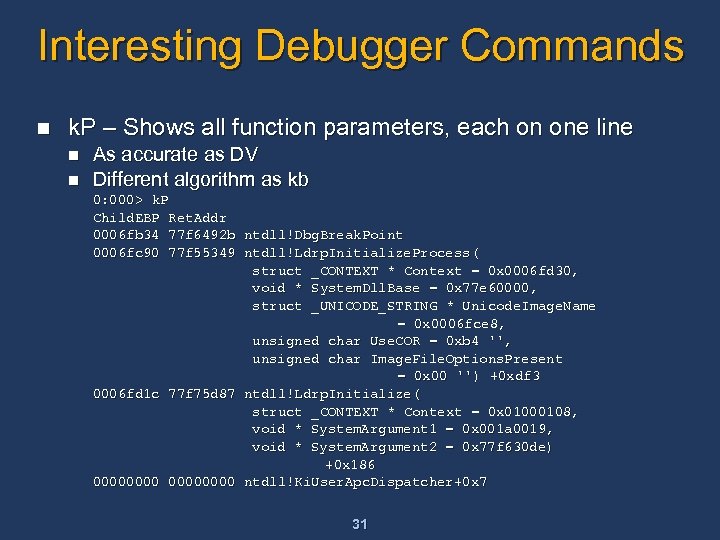
Interesting Debugger Commands n k. P – Shows all function parameters, each on one line n n As accurate as DV Different algorithm as kb 0: 000> k. P Child. EBP Ret. Addr 0006 fb 34 77 f 6492 b ntdll!Dbg. Break. Point 0006 fc 90 77 f 55349 ntdll!Ldrp. Initialize. Process( struct _CONTEXT * Context = 0 x 0006 fd 30, void * System. Dll. Base = 0 x 77 e 60000, struct _UNICODE_STRING * Unicode. Image. Name = 0 x 0006 fce 8, unsigned char Use. COR = 0 xb 4 '', unsigned char Image. File. Options. Present = 0 x 00 '') +0 xdf 3 0006 fd 1 c 77 f 75 d 87 ntdll!Ldrp. Initialize( struct _CONTEXT * Context = 0 x 01000108, void * System. Argument 1 = 0 x 001 a 0019, void * System. Argument 2 = 0 x 77 f 630 de) +0 x 186 00000000 ntdll!Ki. User. Apc. Dispatcher+0 x 7 31
![Interesting Commands n lm [options]: detailed information about a module (replaces !drivers) kd> lmv Interesting Commands n lm [options]: detailed information about a module (replaces !drivers) kd> lmv](https://present5.com/presentation/7be9e1d25566880aac5df8dfb079d9df/image-32.jpg)
Interesting Commands n lm [options]: detailed information about a module (replaces !drivers) kd> lmv mntos* kd> mntos* start end module name 00400000 00618080 ntoskrnl (private pdb symbols) c: localsymntoskrnl. pdbDD 3 B 00 F 5 D 69 B 4 D 1 D 8 DADA 85166188 F 862ntoskrnl. pdb Loaded symbol image file: ntoskrnl. exe Mapped memory image file: c: localsymntoskrnl. exe404 D 5566218080ntoskrnl. exe Image path: \winbuildsreleaseXPSP 22094usax 86 frebinntoskrnl. exe Timestamp: Mon Mar 08 21: 25: 58 2004 (404 D 5566) Checksum: 0021 AF 90 Image. Size: 00218080 Image. Size: File version: 5. 1. 2600. 2094 Product version: 5. 1. 2600. 2094 File flags: 0 (Mask 3 F) File OS: 40004 NT Win 32 File type: 1. 0 App File date: 0000 Translations: 0409. 04 b 0 Company. Name: : Microsoft Corporation Company. Name Product. Name: Microsoft « Windows « Operating System Product. Name: Internal. Name: ntoskrnl. exe Internal. Name: Original. Filename : ntoskrnl. exe Product. Version: 5. 1. 2600. 2094 Product. Version: File. Version: : 5. 1. 2600. 2094 (xpsp_sp 2_rc 1. 040308 -1920) File. Version File. Description : NT Kernel & System Legal. Copyright: Microsoft Corporation. All rights reserved. Legal. Copyright: 32
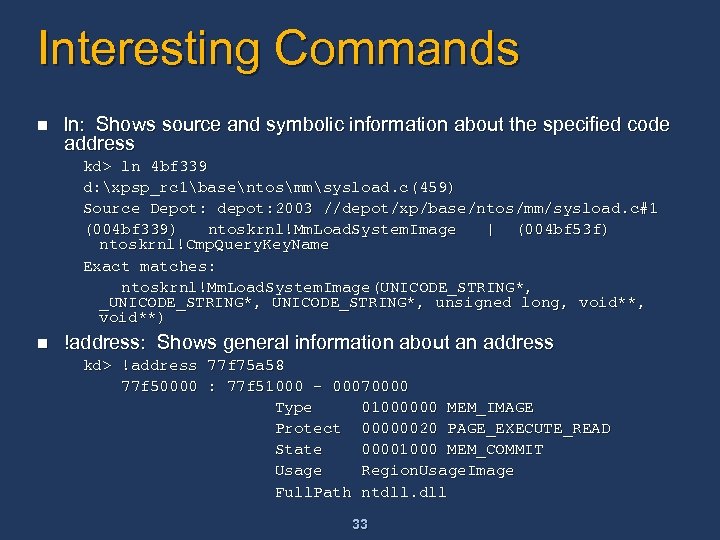
Interesting Commands n ln: Shows source and symbolic information about the specified code address kd> ln 4 bf 339 d: xpsp_rc 1basentosmmsysload. c(459) Source Depot: depot: 2003 //depot/xp/base/ntos/mm/sysload. c#1 (004 bf 339) ntoskrnl!Mm. Load. System. Image | (004 bf 53 f) ntoskrnl!Cmp. Query. Key. Name Exact matches: ntoskrnl!Mm. Load. System. Image(UNICODE_STRING*, _UNICODE_STRING*, unsigned long, void**) n !address: Shows general information about an address kd> !address 77 f 75 a 58 77 f 50000 : 77 f 51000 - 00070000 Type 01000000 MEM_IMAGE Protect 00000020 PAGE_EXECUTE_READ State 00001000 MEM_COMMIT Usage Region. Usage. Image Full. Path ntdll. dll 33
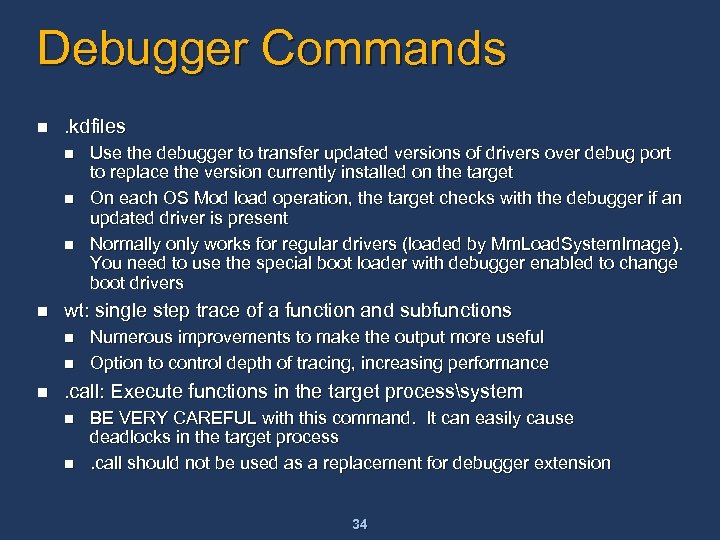
Debugger Commands n . kdfiles n n wt: single step trace of a function and subfunctions n n n Use the debugger to transfer updated versions of drivers over debug port to replace the version currently installed on the target On each OS Mod load operation, the target checks with the debugger if an updated driver is present Normally only works for regular drivers (loaded by Mm. Load. System. Image). You need to use the special boot loader with debugger enabled to change boot drivers Numerous improvements to make the output more useful Option to control depth of tracing, increasing performance . call: Execute functions in the target processsystem n n BE VERY CAREFUL with this command. It can easily cause deadlocks in the target process. call should not be used as a replacement for debugger extension 34
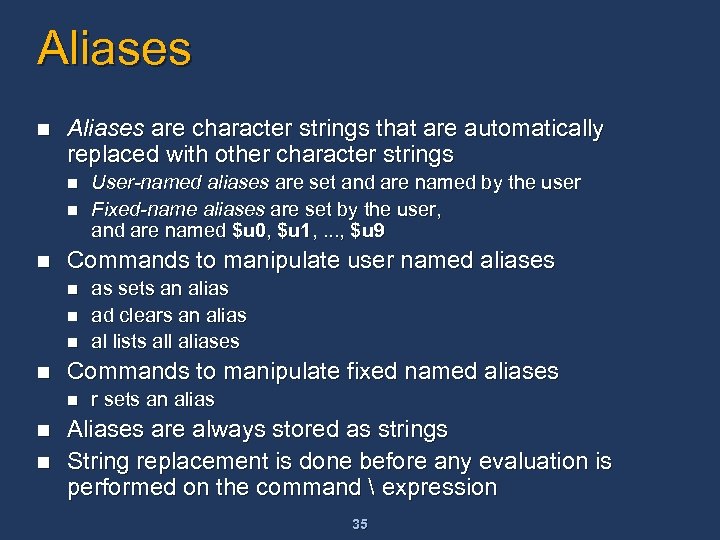
Aliases n Aliases are character strings that are automatically replaced with other character strings n n n Commands to manipulate user named aliases n n n as sets an alias ad clears an alias al lists all aliases Commands to manipulate fixed named aliases n n User-named aliases are set and are named by the user Fixed-name aliases are set by the user, and are named $u 0, $u 1, . . . , $u 9 r sets an alias Aliases are always stored as strings String replacement is done before any evaluation is performed on the command expression 35
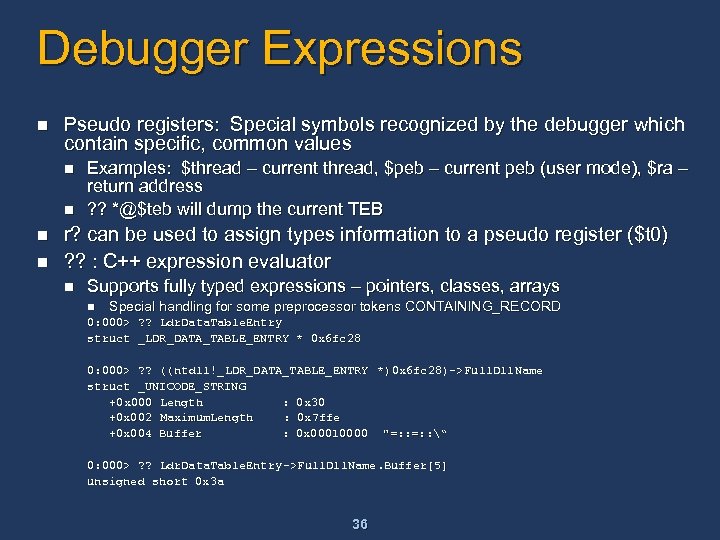
Debugger Expressions n Pseudo registers: Special symbols recognized by the debugger which contain specific, common values n n Examples: $thread – current thread, $peb – current peb (user mode), $ra – return address ? ? *@$teb will dump the current TEB r? can be used to assign types information to a pseudo register ($t 0) ? ? : C++ expression evaluator n Supports fully typed expressions – pointers, classes, arrays n Special handling for some preprocessor tokens CONTAINING_RECORD 0: 000> ? ? Ldr. Data. Table. Entry struct _LDR_DATA_TABLE_ENTRY * 0 x 6 fc 28 0: 000> ? ? ((ntdll!_LDR_DATA_TABLE_ENTRY *)0 x 6 fc 28)->Full. Dll. Name struct _UNICODE_STRING +0 x 000 Length : 0 x 30 +0 x 002 Maximum. Length : 0 x 7 ffe +0 x 004 Buffer : 0 x 00010000 "=: : “ 0: 000> ? ? Ldr. Data. Table. Entry ->Full. Dll. Name. Buffer[5] unsigned short 0 x 3 a 36
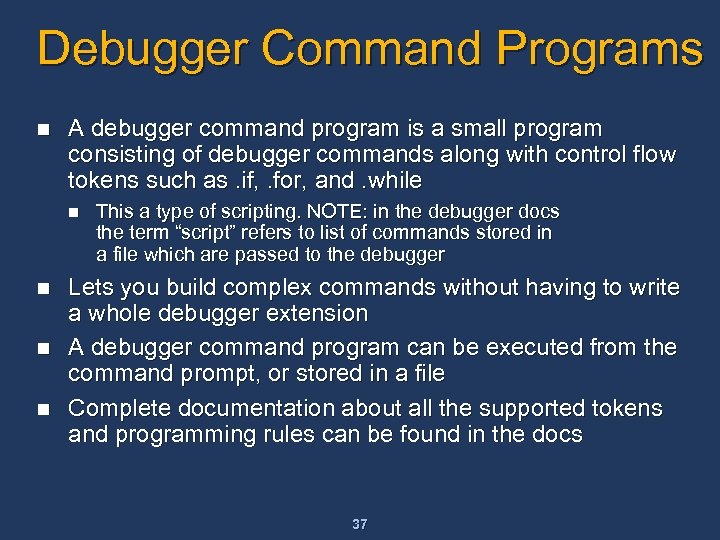
Debugger Command Programs n A debugger command program is a small program consisting of debugger commands along with control flow tokens such as. if, . for, and. while n n This a type of scripting. NOTE: in the debugger docs the term “script” refers to list of commands stored in a file which are passed to the debugger Lets you build complex commands without having to write a whole debugger extension A debugger command program can be executed from the command prompt, or stored in a file Complete documentation about all the supported tokens and programming rules can be found in the docs 37
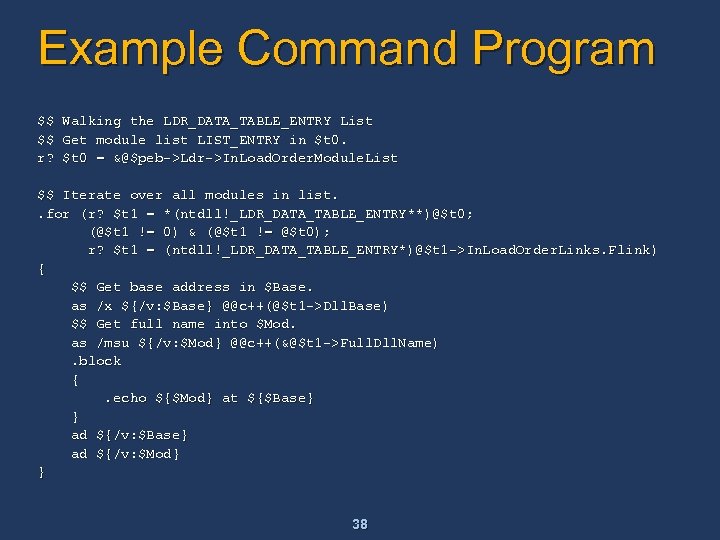
Example Command Program $$ $$ r? Walking the LDR_DATA_TABLE_ENTRY List Get module list LIST_ENTRY in $t 0 = &@$peb->Ldr->In. Load. Order. Module. List $$ Iterate over all modules in list. . for (r? $t 1 = *(ntdll!_LDR_DATA_TABLE_ENTRY**)@$t 0; (@$t 1 != 0) & (@$t 1 != @$t 0); r? $t 1 = (ntdll!_LDR_DATA_TABLE_ENTRY*)@$t 1 ->In. Load. Order. Links. Flink) { $$ Get base address in $Base. as /x ${/v: $Base} @@c++(@$t 1 ->Dll. Base) $$ Get full name into $Mod. as /msu ${/v: $Mod} @@c++(&@$t 1 ->Full. Dll. Name). block {. echo ${$Mod} at ${$Base} } ad ${/v: $Base} ad ${/v: $Mod} } 38
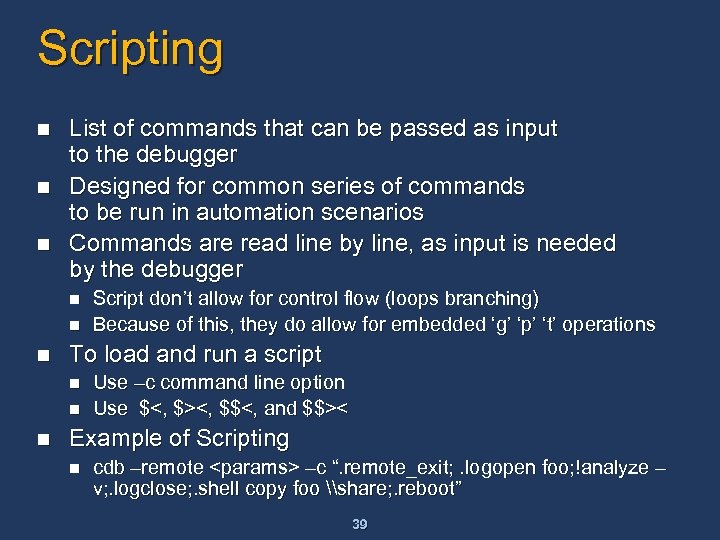
Scripting n n n List of commands that can be passed as input to the debugger Designed for common series of commands to be run in automation scenarios Commands are read line by line, as input is needed by the debugger n n n To load and run a script n n n Script don’t allow for control flow (loops branching) Because of this, they do allow for embedded ‘g’ ‘p’ ‘t’ operations Use –c command line option Use $<, $><, $$<, and $$>< Example of Scripting n cdb –remote <params> –c “. remote_exit; . logopen foo; !analyze – v; . logclose; . shell copy foo \share; . reboot” 39
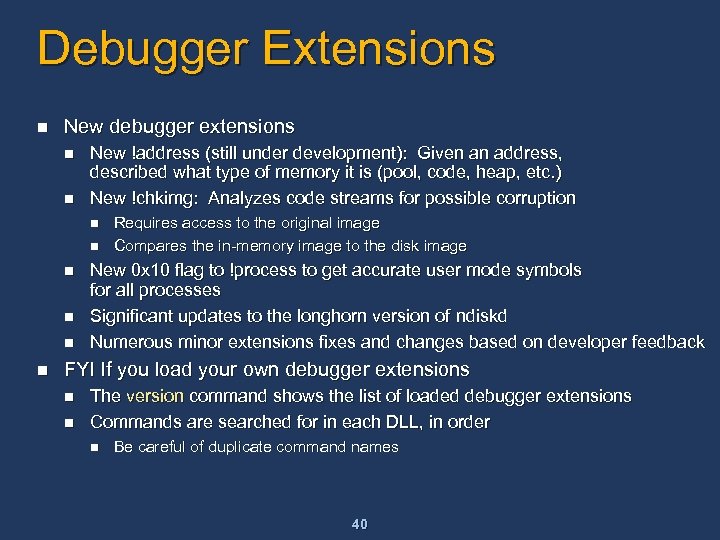
Debugger Extensions n New debugger extensions n n New !address (still under development): Given an address, described what type of memory it is (pool, code, heap, etc. ) New !chkimg: Analyzes code streams for possible corruption n n n Requires access to the original image Compares the in-memory image to the disk image New 0 x 10 flag to !process to get accurate user mode symbols for all processes Significant updates to the longhorn version of ndiskd Numerous minor extensions fixes and changes based on developer feedback FYI If you load your own debugger extensions n n The version command shows the list of loaded debugger extensions Commands are searched for in each DLL, in order n Be careful of duplicate command names 40
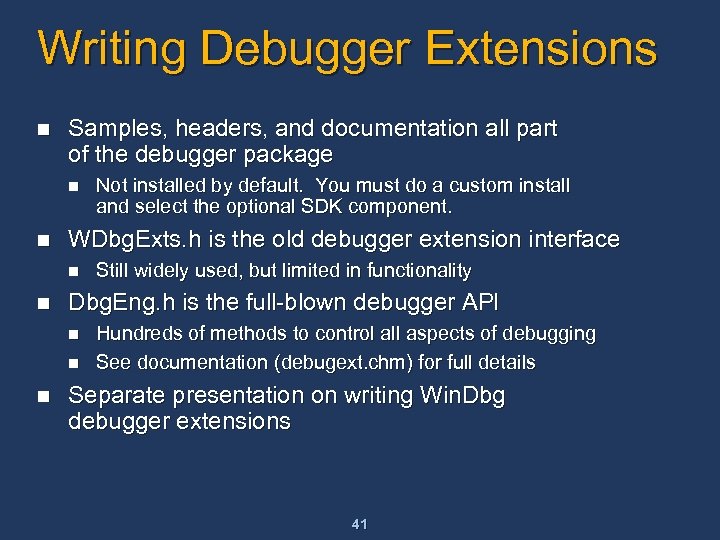
Writing Debugger Extensions n Samples, headers, and documentation all part of the debugger package n n WDbg. Exts. h is the old debugger extension interface n n Still widely used, but limited in functionality Dbg. Eng. h is the full-blown debugger API n n n Not installed by default. You must do a custom install and select the optional SDK component. Hundreds of methods to control all aspects of debugging See documentation (debugext. chm) for full details Separate presentation on writing Win. Dbg debugger extensions 41
Call To Action n Read the debugger docs! Send us feedback – about the tool or the docs Look at your OCA failures n n Fix your pool corruption problems n n n These are REAL customer problems Tell us about the bugs you fix, so we can update !analyze and point customers to your driver updates Attend the OCA Crash Analysis session, following this session Attend the Win. Dbg Ask the Experts sessions 42
Resources n Debugger URL and download site n n Debugger e-mail – for debugger bug reports and feature requests n n http: //www. microsoft. com/whdc/ddk/debugging Windbgfb @ microsoft. com We try to fix all the bugs people report We do not provide general debugging support on this alias Debugger newsgroup n n Microsoft. public. windbg Good place for general debugging issues 43

7be9e1d25566880aac5df8dfb079d9df.ppt