7a964483e54ff5a18a686425340367a0.ppt
- Количество слайдов: 51
 ADM 390 Microsoft® Windows® Crash Dump Analysis Mark Russinovich Winternals Software David Solomon Expert Seminars

 About The Speakers Authors of: Inside Windows 2000, 3 rd Edition (Microsoft Press) Inside Windows 2000/XP/2003 Interactive Internals Video Tutorial Used by Microsoft for worldwide internal training David Solomon: Teaches Windows internals classes (www. solsem. com) Writes books and articles on Windows internals Mark Russinovich: Author of tools on www. sysinternals. com Co-founder and Chief Software Architect for Winternals Software (www. winternals. com) Teaches Windows internals classes Writes books and articles on Windows internals
 Outline What causes crashes? Crash dump options Analysis with Win. Dbg/Kd Debugging hung systems Microsoft On-line Crash Analysis Using Driver Verifier Live kernel debugging Getting past a crash
 Introduction Many systems administrators ignore Windows NT/Windows 2000’s crash dump options “I don’t know what to do with one” “Its too hard” “It won’t tell me anything anyway” Basic crash dump analysis is actually pretty straightforward Even if only 1 out of 5 or 10 dumps tells you what’s wrong, isn’t it worth spending a few minutes?
 Why Analyze Dumps? The debuggers and Microsoft Online Crash Analysis (OCA) often solve crashes Sometimes, however, they do not, so your analysis might tell you: What driver to disable, update, or replace with different hardware What OEM to send the dump to
 What Causes Crashes? System crashes when a fatal error prevents further execution Any kernel-mode component can crash the system Drivers and the OS share the same memory space Therefore, any driver or OS component can, due to a bug, corrupt system memory Note: This is for performance reasons and is the same on Linux, most Unix’s, VMS, etc…
 What Are The Root Causes? Anecdotal evidence suggests: Buggy drivers Bugs in the OS Hardware failure/error Cosmic rays
 At The Crash A component calls Ke. Bug. Check. Ex, which takes five arguments: Stop code 4 stop-code defined parameters Ke. Bug. Check. Ex: Turns off interrupts Tells other CPUs to stop Paints the blue screen Notifies registered drivers of the crash If a dump is configured: Verifies checksums Calls dump I/O functions
 Common Stop Codes There about 150 defined stop codes Shared by many components and drivers Common ones include: IRQL_NOT_LESS_OR_EQUAL (0 x 0 A) Usually an invalid memory access INVALID_KERNEL_MODE_TRAP (0 x 7 F) and KMODE_EXCEPTION_NOT_HANDLED (0 x 1 E) Generated by executing garbage instructions Usually caused when a stack is trashed Documented in Debugger Tools help file Often, multiple articles in Knowledge Base
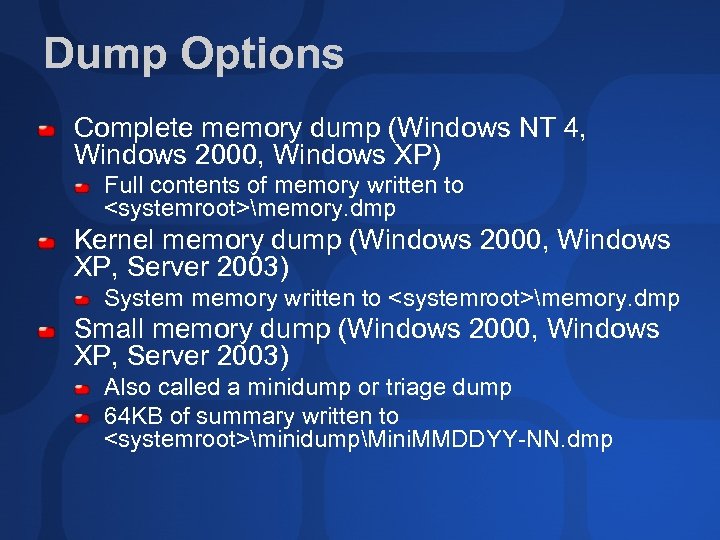 Dump Options Complete memory dump (Windows NT 4, Windows 2000, Windows XP) Full contents of memory written to
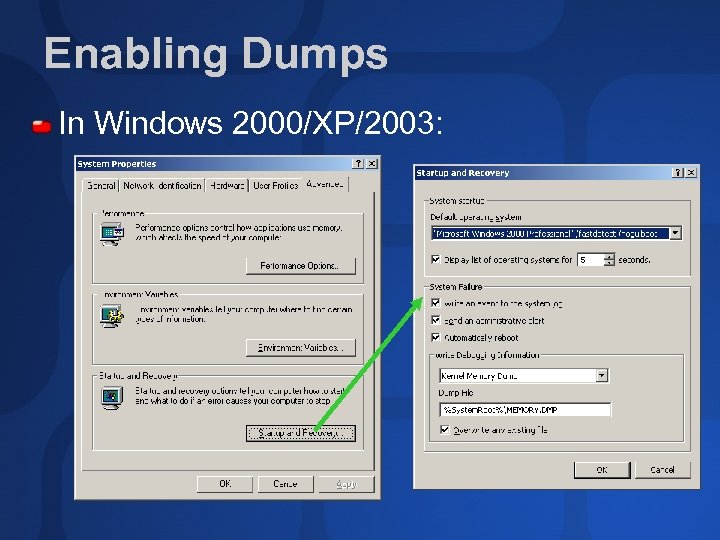 Enabling Dumps In Windows 2000/XP/2003:
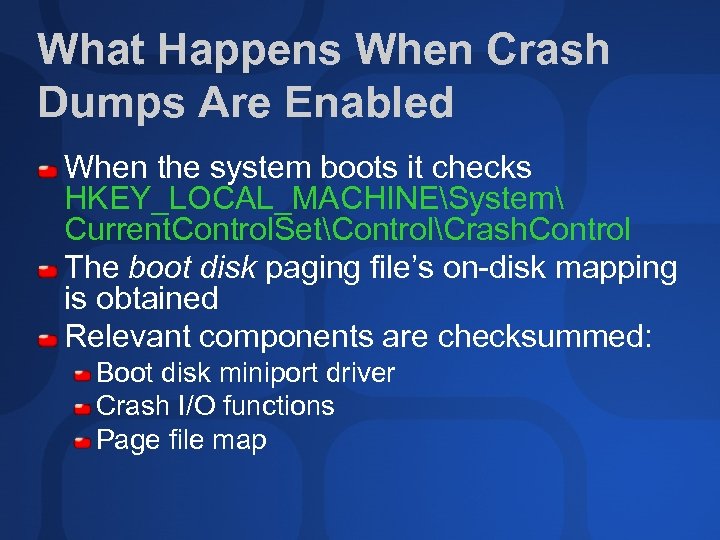 What Happens When Crash Dumps Are Enabled When the system boots it checks HKEY_LOCAL_MACHINESystem Current. Control. SetControlCrash. Control The boot disk paging file’s on-disk mapping is obtained Relevant components are checksummed: Boot disk miniport driver Crash I/O functions Page file map
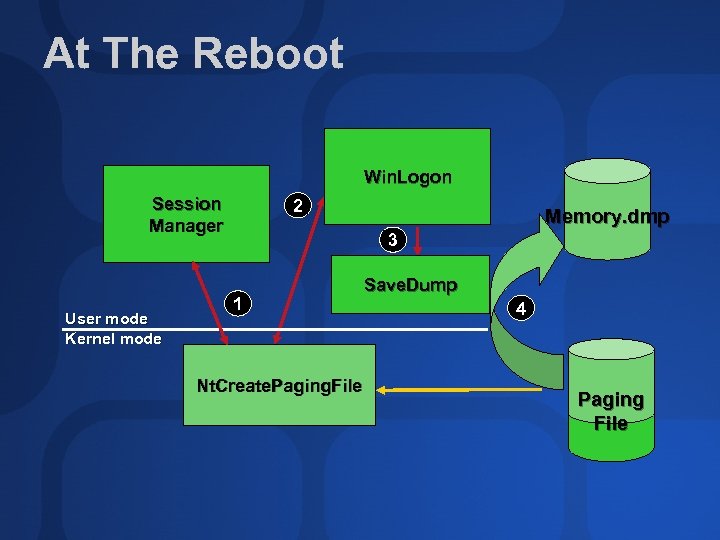 At The Reboot Win. Logon Session Manager User mode Kernel mode 2 Memory. dmp 3 1 Nt. Create. Paging. File Save. Dump 4 Paging File
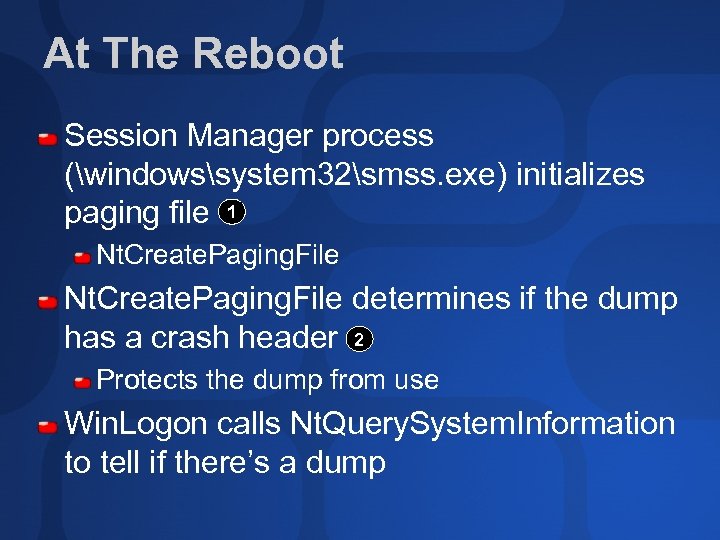 At The Reboot Session Manager process (windowssystem 32smss. exe) initializes paging file 1 Nt. Create. Paging. File determines if the dump has a crash header 2 Protects the dump from use Win. Logon calls Nt. Query. System. Information to tell if there’s a dump
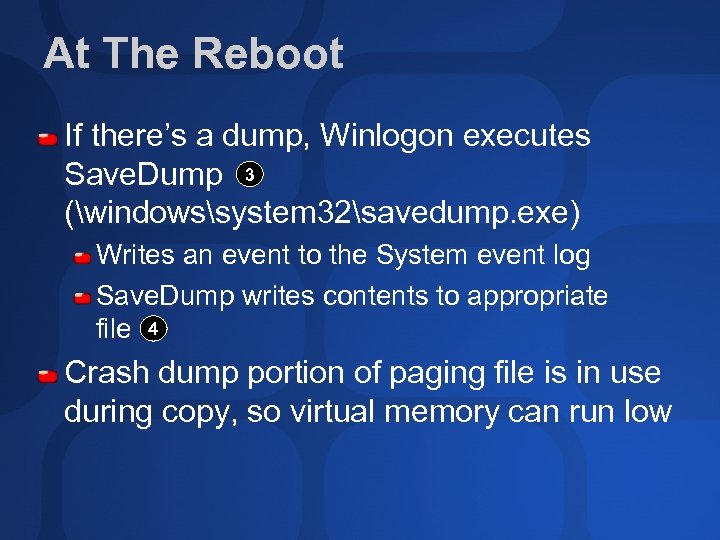 At The Reboot If there’s a dump, Winlogon executes Save. Dump 3 (windowssystem 32savedump. exe) Writes an event to the System event log Save. Dump writes contents to appropriate file 4 Crash dump portion of paging file is in use during copy, so virtual memory can run low
 Why Crash Dumps Fail Most common reasons: Paging file on boot volume is too small Not enough free space for extracted dump Less common: The crash corrupted components involved in the dump process Miniport driver doesn’t implement dump I/O functions Windows storage drivers must implement dump I/O to get a Microsoft® digital signature
 Microsoft On-line Crash Analysis (OCA) By Default, after a reboot XP/Server 2003 prompts you to send information to http: //oca. microsoft. com Can be configured with Computer Properties->Advanced->Error Reporting Can be customized with Group Policies
 What Does OCA Do? Server farm uses !analyze, but uses Microsoft’s Triage. ini file and database that includes information about known problems Several ways to get OCA results: Via e-mail At the OCA site Sometimes OCA will point you at KB articles that describe the problem KB articles may tell you to use Windows Update to get newer drivers, a hotfix, or install a Service Pack
 Analyzing a Crash Dump If OCA doesn’t help you, or you have an NT 4 or Windows 2000 dump, then you need to open it with one of the kernel debuggers: Win. Dbg –Windows program Kd – command-line program Both provide same kernel debugger analysis commands Part of the Debugging Tools for Windows Free download from http: //www. microsoft. com/whdc/ddk/debugging/default. m spx Supports Windows NT 4, Windows 2000, Windows XP, Server 2003 Check for updates frequently Don’t use older version on install media
 Symbol Files Before you can use any crash analysis tool you need symbol files Symbol files contain global function and variable names Symbols are service pack-specific and have an installer (default directory is windowssymbols) Windows NT 4: *. dbg Windows 2000: *. dbg, *. pdb Windows XP/2003: *. pdb Note: Service Pack symbols only include updates
 Microsoft Symbol Server Win. Dbg and Kd can download symbols automatically from Microsoft Pick a directory to install symbols and add the following to the debugger’s symbol path: SRV*directory*http: //msdl. microsoft. com/download/symbols The debugger automatically detects the OS version of a dump and downloads the symbols on-demand
 Automated Analysis When you open a crash dump with Windbg or Kd you get a basic crash analysis: Stop code and parameters A guess at offending driver The analysis is the result of the automated execution of the !analyze debugger command
 Automated Analysis Always execute !analyze with the –v option to get more information Text description of stop code Meaning (if any) of parameters Stack dump !Analyze uses heuristics to walk up the stack and determine what driver is the likely cause of the crash “Followup” is taken from optional triage. ini file
 Manual Analysis Sometimes automated analysis isn’t enough !analyze doesn’t tell you anything useful You want to know what else was happening at the time of the crash Useful commands: Examine current thread: !thread tid May or may not be related to the crash List all processes: !process 0 0 Make sure you understand what was running on the system Examine a specific process: !process
 Driver Verifier If you find a driver in a crash dump that looks like it might be the cause of the crash, turn on verification for it If the Verifier detects a violation it crashes the system and identifies the driver Use “Last Known Good” if the verifier detects a bug during the boot If a bug is detected in a third-party product check for updates and/or contact the vendor’s support
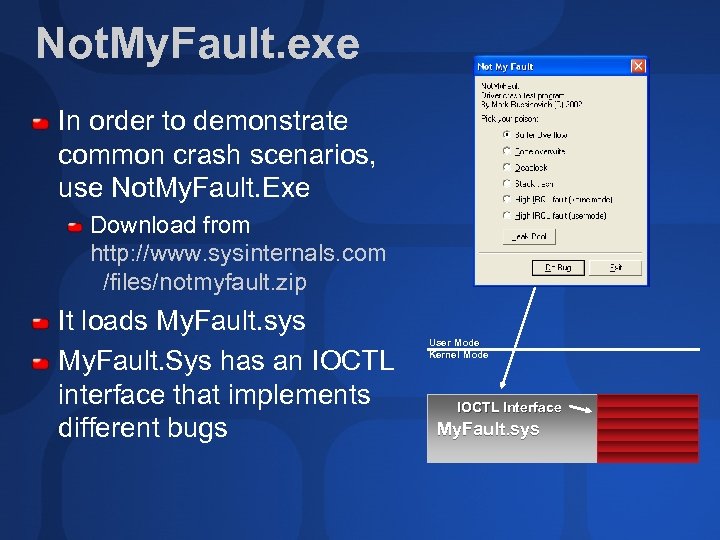 Not. My. Fault. exe In order to demonstrate common crash scenarios, use Not. My. Fault. Exe Download from http: //www. sysinternals. com /files/notmyfault. zip It loads My. Fault. sys My. Fault. Sys has an IOCTL interface that implements different bugs User Mode Kernel Mode IOCTL Interface My. Fault. sys
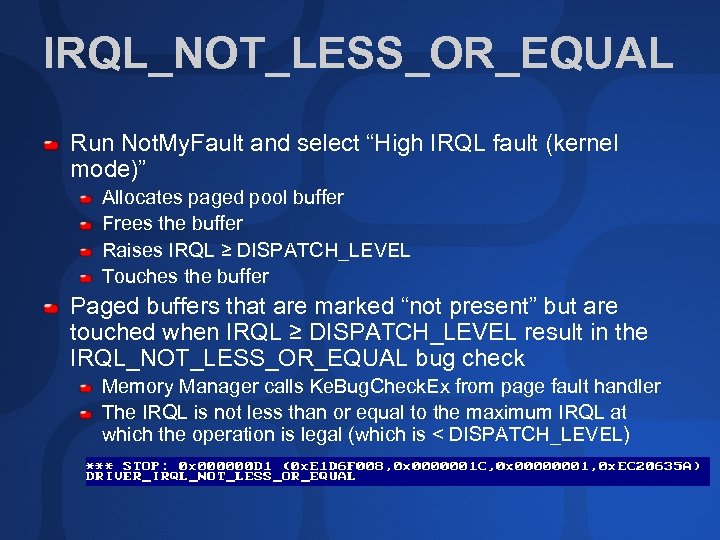 IRQL_NOT_LESS_OR_EQUAL Run Not. My. Fault and select “High IRQL fault (kernel mode)” Allocates paged pool buffer Frees the buffer Raises IRQL ≥ DISPATCH_LEVEL Touches the buffer Paged buffers that are marked “not present” but are touched when IRQL ≥ DISPATCH_LEVEL result in the IRQL_NOT_LESS_OR_EQUAL bug check Memory Manager calls Ke. Bug. Check. Ex from page fault handler The IRQL is not less than or equal to the maximum IRQL at which the operation is legal (which is < DISPATCH_LEVEL)
 Using the Stack in Analysis !analyze easily identifies My. Fault. sys by looking at the Ke. Bug. Check. Ex parameters The Memory Manager looked at the stack and determined the address that caused the page fault !analyze often looks at the stack to determine the cause of a crash
 Stacks Each thread has a user-mode and kernel-mode stack The user-mode stack is usually 1 MB on x 86 The kernel-mode stack is typically 12 KB on x 86 systems Stacks allow for nested function invocation Parameters can be passed on the stack Stores return address Serves as storage for local variables
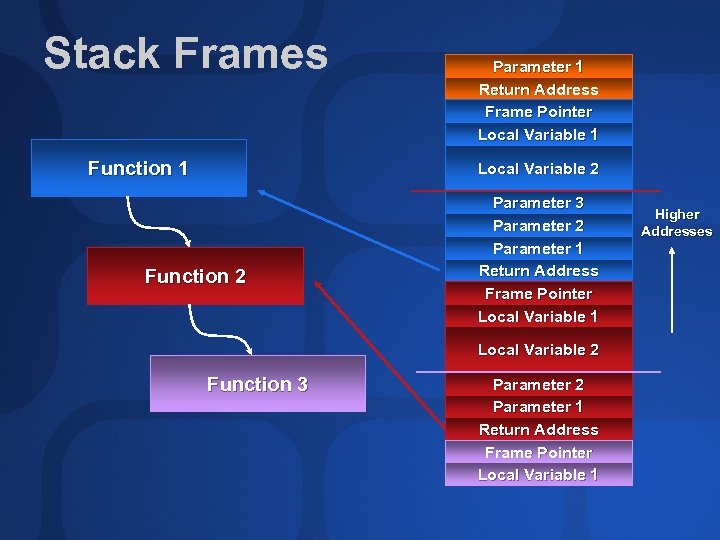 Stack Frames Function 1 Parameter 1 Return Address Frame Pointer Local Variable 1 Local Variable 2 Function 2 Parameter 3 Parameter 2 Parameter 1 Return Address Frame Pointer Local Variable 1 Local Variable 2 Function 3 Parameter 2 Parameter 1 Return Address Frame Pointer Local Variable 1 Higher Addresses
 Stacks Other calling conventions make the stack hard to figure out No frame pointer Register arguments (fast calls) Debugger requires symbol information to parse The stack is the #1 analysis resource It requires that a driver get “caught in the act” Sometimes that’s not possible without the Driver Verifier’s help
 Stack Trashing Stack trashes have several possible causes: A driver pushing things on the stack causes the stack to overflow A driver overruns a stack-allocated buffer Usually results in garbage code being executed (KMODE_EXCEPTION_NOT_HANDLED) Driver Verifier can’t determine cause Since the stack is corrupted, analysis is especially hard
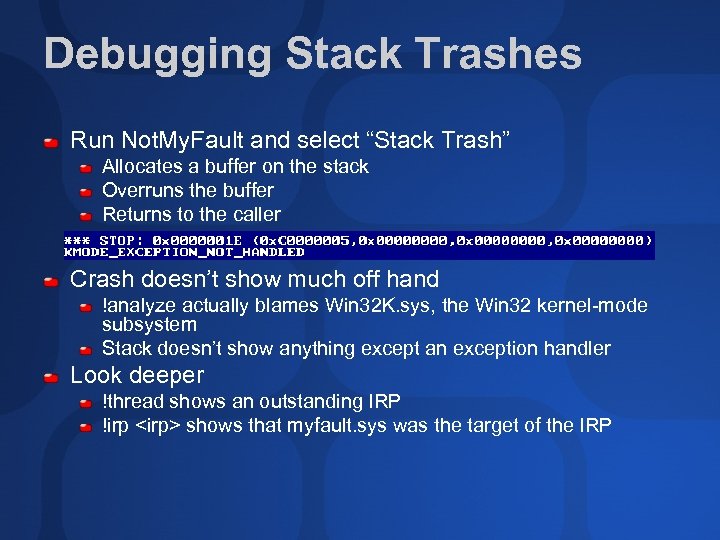 Debugging Stack Trashes Run Not. My. Fault and select “Stack Trash” Allocates a buffer on the stack Overruns the buffer Returns to the caller Crash doesn’t show much off hand !analyze actually blames Win 32 K. sys, the Win 32 kernel-mode subsystem Stack doesn’t show anything except an exception handler Look deeper !thread shows an outstanding IRP !irp
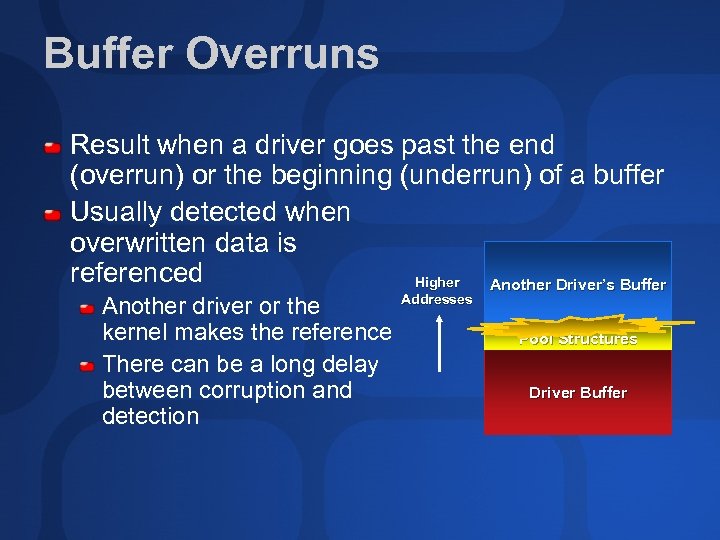 Buffer Overruns Result when a driver goes past the end (overrun) or the beginning (underrun) of a buffer Usually detected when overwritten data is referenced Higher Another Driver’s Buffer Another driver or the kernel makes the reference There can be a long delay between corruption and detection Addresses Pool Structures Driver Buffer
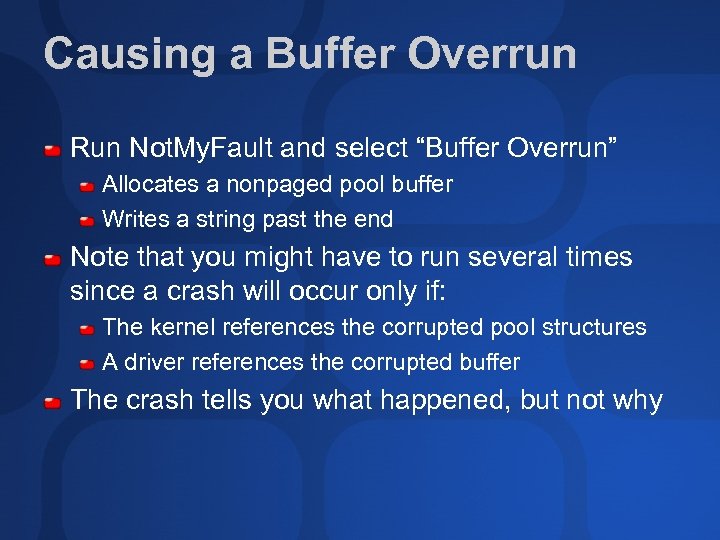 Causing a Buffer Overrun Run Not. My. Fault and select “Buffer Overrun” Allocates a nonpaged pool buffer Writes a string past the end Note that you might have to run several times since a crash will occur only if: The kernel references the corrupted pool structures A driver references the corrupted buffer The crash tells you what happened, but not why
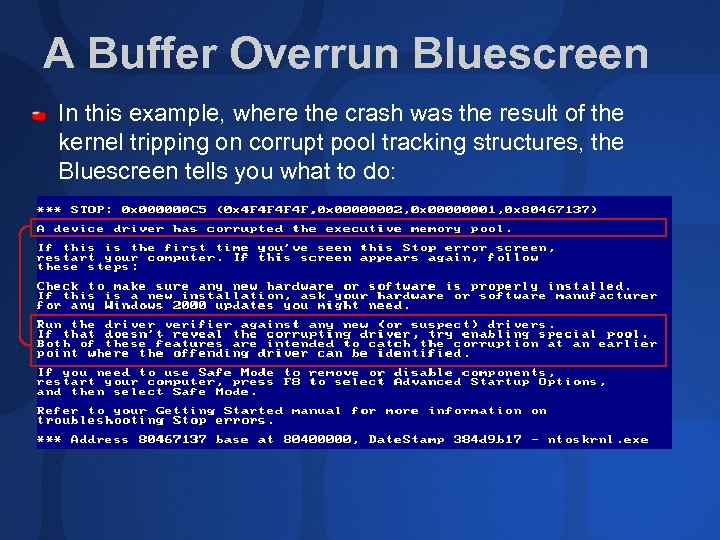 A Buffer Overrun Bluescreen In this example, where the crash was the result of the kernel tripping on corrupt pool tracking structures, the Bluescreen tells you what to do:
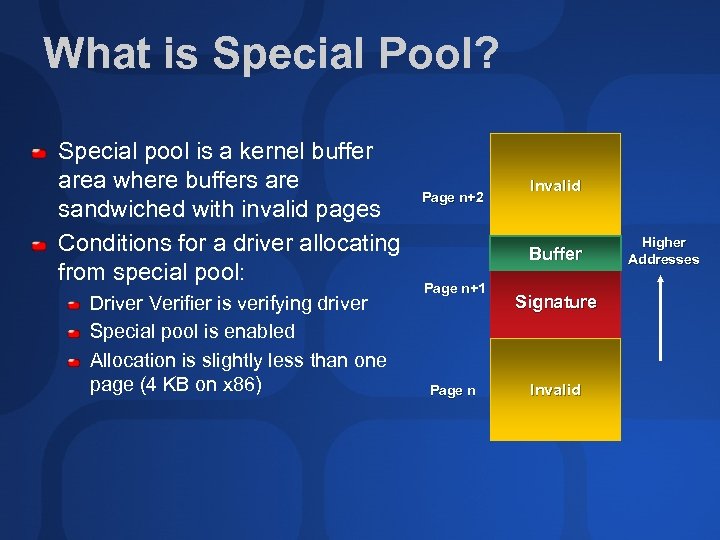 What is Special Pool? Special pool is a kernel buffer area where buffers are sandwiched with invalid pages Conditions for a driver allocating from special pool: Driver Verifier is verifying driver Special pool is enabled Allocation is slightly less than one page (4 KB on x 86) Page n+2 Invalid Buffer Page n+1 Page n Signature Invalid Higher Addresses
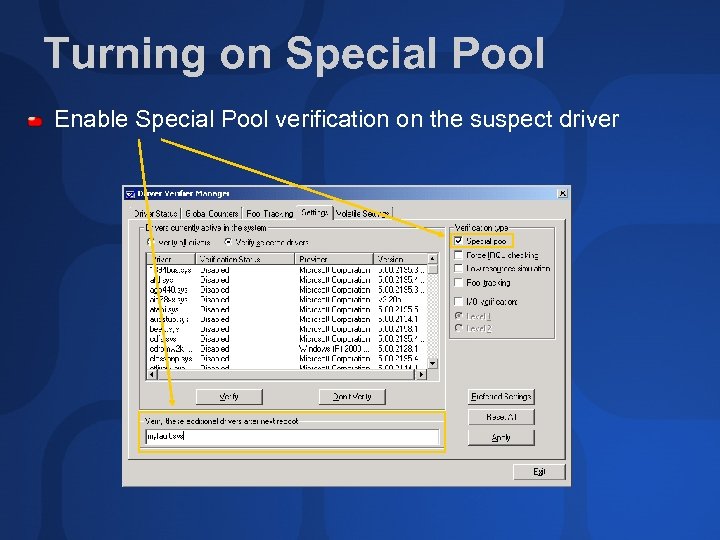 Turning on Special Pool Enable Special Pool verification on the suspect driver
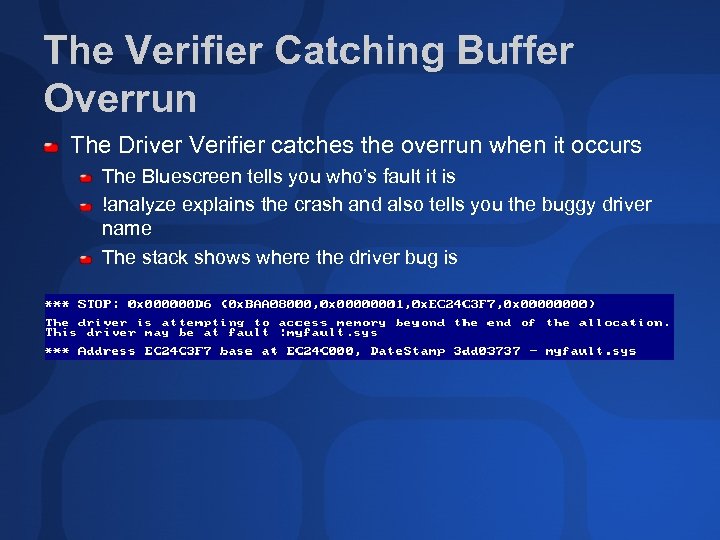 The Verifier Catching Buffer Overrun The Driver Verifier catches the overrun when it occurs The Bluescreen tells you who’s fault it is !analyze explains the crash and also tells you the buggy driver name The stack shows where the driver bug is
 Code Overwrites Caused when a bug results in a wild pointer A wild pointer that points at invalid memory is easily detected A wild pointer that points at data is similar to buffer overrun Might not cause a problem for a long time Crash makes it look like its something else’s fault Driver Verifier doesn’t catch code overwrite System code write protection catches code overwrite, but it’s not on if: It’s a Windows 2000 system with > 127 MB memory It’s a Windows XP or. NET Server system with > 255 MB Something has disabled it
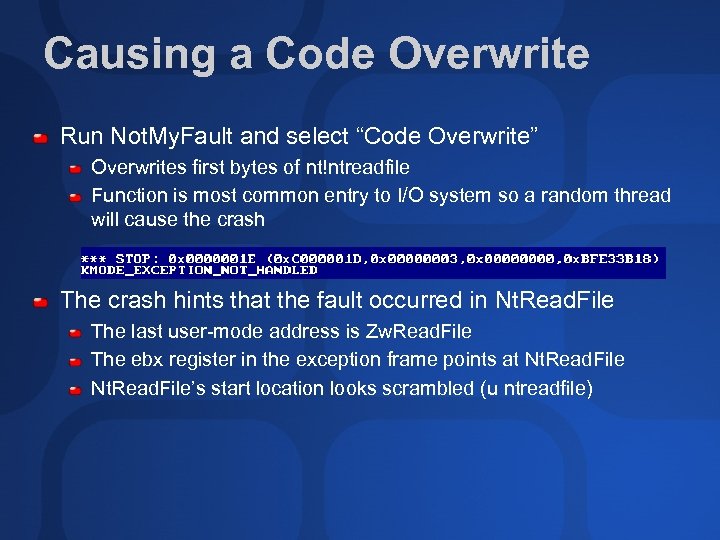 Causing a Code Overwrite Run Not. My. Fault and select “Code Overwrite” Overwrites first bytes of nt!ntreadfile Function is most common entry to I/O system so a random thread will cause the crash The crash hints that the fault occurred in Nt. Read. File The last user-mode address is Zw. Read. File The ebx register in the exception frame points at Nt. Read. File’s start location looks scrambled (u ntreadfile)
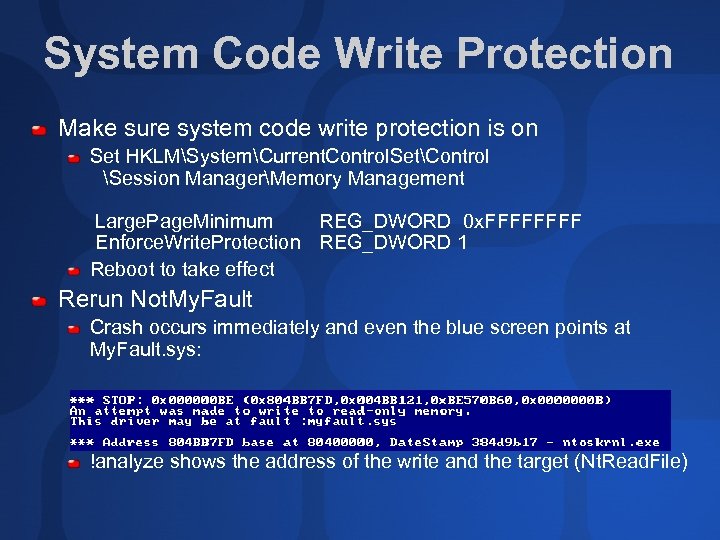 System Code Write Protection Make sure system code write protection is on Set HKLMSystemCurrent. Control. SetControl Session ManagerMemory Management Large. Page. Minimum REG_DWORD 0 x. FFFF Enforce. Write. Protection REG_DWORD 1 Reboot to take effect Rerun Not. My. Fault Crash occurs immediately and even the blue screen points at My. Fault. sys: !analyze shows the address of the write and the target (Nt. Read. File)
 Hung Systems You can tackle a hung system, but only if you’ve prepared: Boot in debug mode, or Set the keystroke-crash Registry value For debug mode you need a second system (the debugger host) connected to the target via serial cable Run Windbg/Kd on the host Edit the target’s boot. ini file: /debugport=com. X /baudrate=XXX When the system hangs, connect with the debugger and hit Ctrl-C
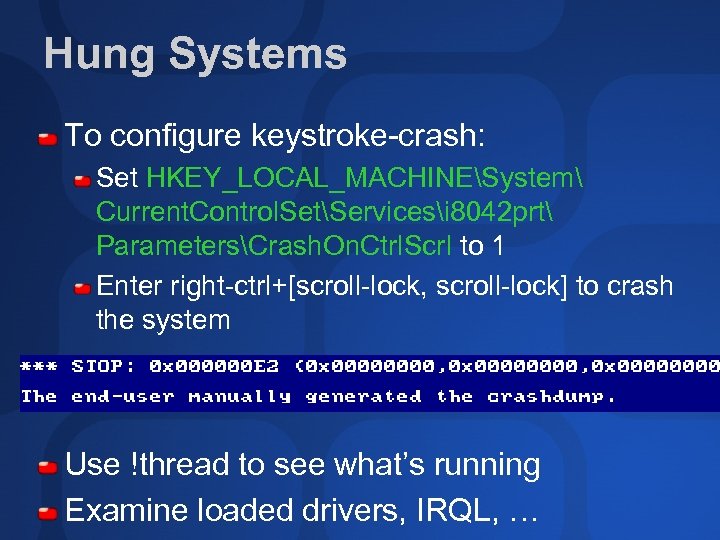 Hung Systems To configure keystroke-crash: Set HKEY_LOCAL_MACHINESystem Current. Control. SetServicesi 8042 prt ParametersCrash. On. Ctrl. Scrl to 1 Enter right-ctrl+[scroll-lock, scroll-lock] to crash the system Use !thread to see what’s running Examine loaded drivers, IRQL, …
 Getting Past a Crash Last-Known Good Boots with driver/kernel configuration last used during a successful boot Safe Mode Boots the system with core set of drivers and services Network and non-network Recovery Console Manually disable offending service, replace corrupt images, update files ERD Commander 2003 Registry Editor, Explorer, Driver/Service Manager, password changer, Event Log viewer, Notepad
 The Bluescreen Saver Scare your enemies and fool your friends with the Sysinternals Bluescreen Saver Be careful, your job may be on the line!
 More Information Inside Windows 2000, 3 rd edition Section on System Crashes in chapter 4 Debugging Tools help file Knowledge Base Articles http: //www. microsoft. com/whdc/ddk/debugging/ DBG-KB. mspx Usenet newsgroup microsoft. public. windbg for discussion of debugger issues The debugger team wants your feedback and bug reports - mail suggestions or bug reports to windbgfb@microsoft. com
 Community Resources http: //www. microsoft. com/communities/default. mspx Most Valuable Professional (MVP) http: //www. mvp. support. microsoft. com/ Newsgroups Converse online with Microsoft Newsgroups, including Worldwide http: //www. microsoft. com/communities/newsgroups/default. mspx User Groups Meet and learn with your peers http: //www. microsoft. com/communities/usergroups/default. mspx
 evaluations
 © 2003 Microsoft Corporation. All rights reserved. This presentation is for informational purposes only. MICROSOFT MAKES NO WARRANTIES, EXPRESS OR IMPLIED, IN THIS SUMMARY.


