2086f3fefd65866664ad7c720f5e828c.ppt
- Количество слайдов: 26


Action-Oriented Benchmarking Using CEUS Data to Identify and Prioritize Efficiency Opportunities in California Commercial Buildings Paul A. Mathew, Ph. D. Lawrence Berkeley National Laboratory Berkeley California

Content § Introduction to action-oriented benchmarking § Using the CEUS database for AOB § AOB Vignettes – schools and offices § Limits of AOB § Outlook

Many Applications for Energy Benchmarking high Property Valuation Rigor Recognition programs Set building/portfolio targets CCx, RCx Identify efficiency opportunities Set system targets Identify “outliers” low Campus Building System Granularity Component

Action Oriented Benchmarking Overall potential for building-wide energy efficiency Site BTU/sf-yr Ventilation k. Wh/sf-yr Potential for energy efficiency in ventilation system Peak cfm/sf Potential to reduce energy use through operational practices e. g. by optimizing ventilation rates Peak W/cfm Potential to reduce energy use through ventilation system efficiency improvements Fan efficiency Potential to improve fan efficiency Pressure drop Potential to reduce system pressure drop Fume hood density Avg/Peak cfm ratio Cooling BTU/sf-yr Impact of fume hoods on ventilation energy use Effectiveness of VAV fume hood sash management

Action-oriented Benchmarking Complements Other Assessment Tools Investment-Grade Energy Audit Whole Building Energy Benchmarking Action-oriented Energy Benchmarking Screen facilities for overall potential Identifies and prioritizes specific opportunities Estimates savings and cost for specific opportunities 0. 5 -2 day FTE 2 -10 day FTE 10 -20 day FTE Minimal data requirements (utility bills, building features) Requires sub-metered enduse data ; may require additional data logging Requires detailed data collection, cost estimation, financial analysis Highly applicable for RCx and CCx Necessary for retrofits with capital investments

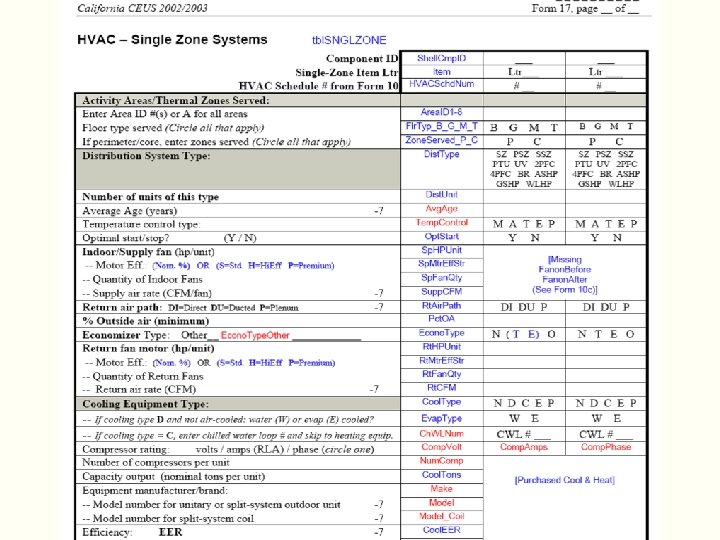
CEUS Database § Commercial End Use Survey – Territories: PG&E, SCE, SDG&E, SMUD § Survey of 2800 premises – Stratified random sampling based on utility region, climate zone, building type, size (consumption) – On-site survey of building characteristics, features – Monthly utility bill data – Short term data logging and/or interval metering at some sites

CEUS Calibrated Simulations § Energy intensities derived from calibrated simulations – Simulation models generated from survey data – Calibrated with utility data, data logging, interval metering

CEUS End Uses § HVAC – Space Heating – Space Cooling – Ventilation § Lighting – Interior Lighting – Exterior Lighting § Other – – – – Water Heating Office Equipment Cooking Miscellaneous Equipment Refrigeration Air Compressors Motors (non-HVAC) Process Equipment

Using CEUS to Infer Actions End-Use Benchmarking – End-Use Intensity – End-Use Breakout Building Features Identify and Prioritize Systems Identify Potential Actions – Presence/absence – Component efficiency Correlate Energy Intensities & Building Features Estimate Potential Savings

Whole Building Energy Intensity Overall Efficiency Potential

Whole Building Energy Intensity Overall Efficiency Potential

Whole Building Energy Intensity Overall Efficiency Potential by Vintage

Whole Building Energy Intensity Overall Efficiency Potential by Climate

End-Use Energy Intensity System Efficiency Potential

End-Use Breakout System Efficiency Potential and Prioritization

End-Use Breakout System Efficiency Potential and Prioritization

Building Features Benchmarking Identify Potential Actions by Presence/Absence

Building Features Benchmarking Identify Potential Actions by Presence/Absence

Building Features Benchmarking Identify Potential Actions by Presence/Absence

Building Features Benchmarking Identify Potential Actions by System Efficiency
")
Correlating Building Features and Energy Intensity Estimate Potential Savings (sort of)

Limits of AOB § NOT “audit in a box” – Only identifies potential actions from predefined list – Only crude savings estimates (range) § Effectiveness is driven by database density – Many gaps in CEUS survey data § Ability to identify actions proportional to user ability to input data AOB helps identify potential actions and prioritize areas for more detailed analysis and audits

Outlook § Continued analysis of CEUS – Opportunities and limits for AOB § Development of action inference methodology – Mapping list of actions to benchmarking metrics § Prototype tool currently under development – Extensive user surveys to determine features – Expected April 2008

About | How to use | My IQ Help Center | Privacy Export | Import Sign in/out Energy IQ Action-oriented energy benchmarking for non-residential buildings Benchmark Actions V Building type q All q Small Office ü Large Office q Restaurant q Retail q Food Store q Warehouse q School q College q Healthcare q Lodging q Public Assembly q Laboratory q Cleanroom q Datacenter q Mixed Use Ø More choices. . . Energy, or. . . Characteristics & Operations, or Combinations Indicators ü Total energy q Lighting ü Quantity q Summary q Electricity q Envelope q Cost q End Uses q Peak power q Air Handling q Emissions ü Distribution q Fuel q Chillers q Thermal q Boilers q Hot Water q Plug/Process Results: Typical large office buildings use 191 k. BTU/ft 2 -year. Enter your own building information at the left to see how yours compares. > Location > Vintage Or, enter all information in Project Profile To Compare Your Building, Enter: Conditioned floor area (sf): 100, 000 Total energy use 1000 ØElectricity (MWh): 100 ØFuel (MBTU): ØOther (MBTU): 0 Views This View: California > large office > total energy > all end uses > quintiles Project Profile: Large Office, California, 100 ksf, Electric+Fuel

Questions? Paul Mathew MS 90 -3111 Lawrence Berkeley National Laboratory 1 Cyclotron Road, Berkeley CA 94720 (510) 486 -5116 pamathew@lbl. gov
2086f3fefd65866664ad7c720f5e828c.ppt