96a52371ae8c77078666a1bd85d0fb81.ppt
- Количество слайдов: 39
 Accelerating Dynamic Software Analyses Joseph L. Greathouse Ph. D. Candidate Advanced Computer Architecture Laboratory University of Michigan December 2, 2011
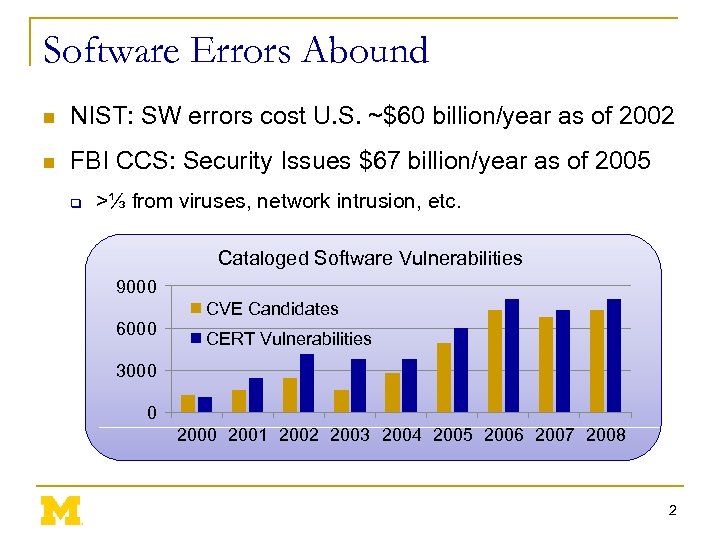 Software Errors Abound n NIST: SW errors cost U. S. ~$60 billion/year as of 2002 n FBI CCS: Security Issues $67 billion/year as of 2005 q >⅓ from viruses, network intrusion, etc. Cataloged Software Vulnerabilities 9000 6000 CVE Candidates CERT Vulnerabilities 3000 0 2001 2002 2003 2004 2005 2006 2007 2008 2
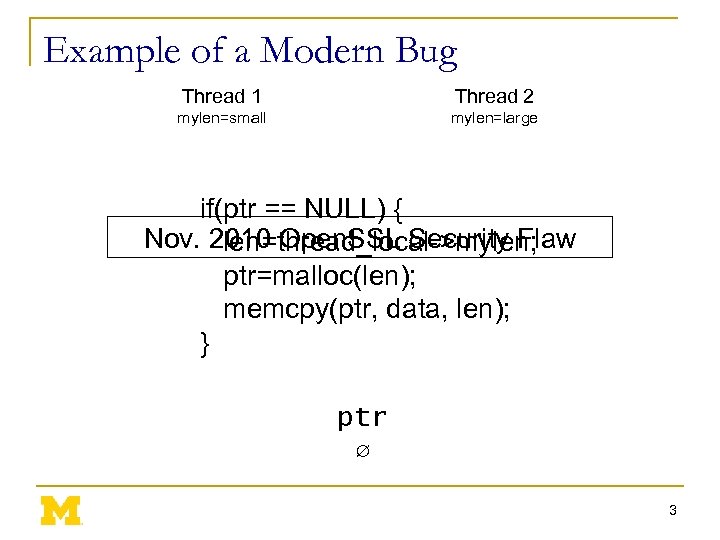 Example of a Modern Bug Thread 1 Thread 2 mylen=small mylen=large if(ptr == NULL) { Nov. 2010 Open. SSL Security Flaw len=thread_local->mylen; ptr=malloc(len); memcpy(ptr, data, len); } ptr ∅ 3
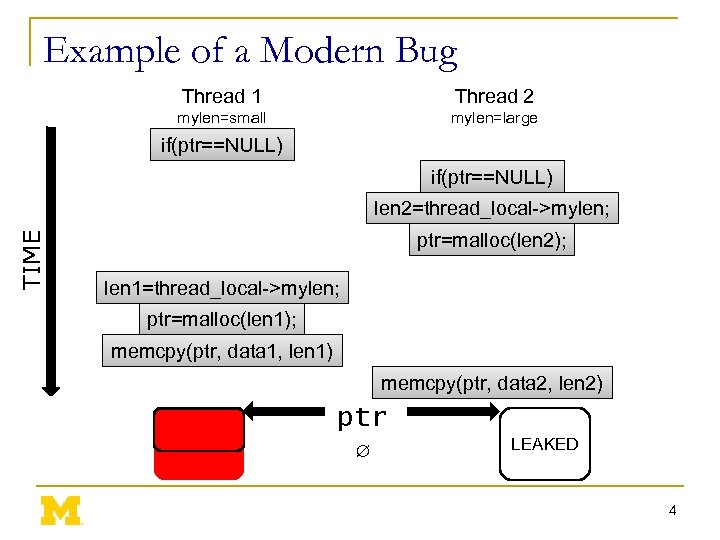 Example of a Modern Bug Thread 1 Thread 2 mylen=small mylen=large if(ptr==NULL) TIME len 2=thread_local->mylen; ptr=malloc(len 2); len 1=thread_local->mylen; ptr=malloc(len 1); memcpy(ptr, data 1, len 1) memcpy(ptr, data 2, len 2) ptr ∅ LEAKED 4
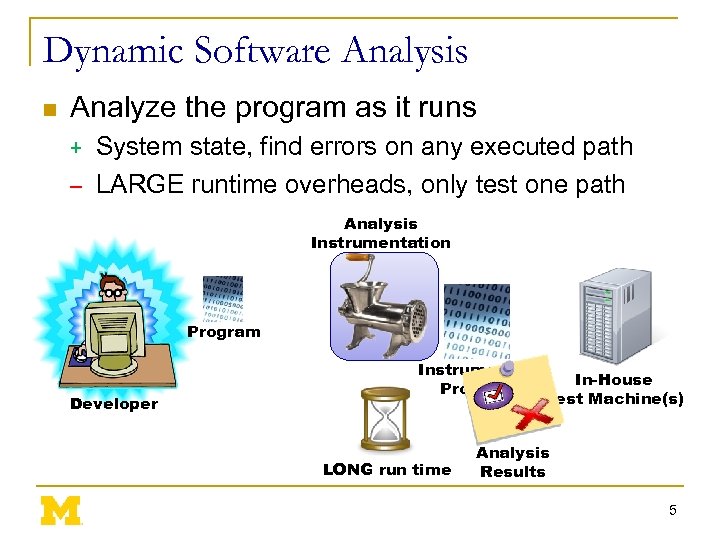 Dynamic Software Analysis n Analyze the program as it runs System state, find errors on any executed path – LARGE runtime overheads, only test one path + Analysis Instrumentation Program Developer Instrumented Program LONG run time In-House Test Machine(s) Analysis Results 5
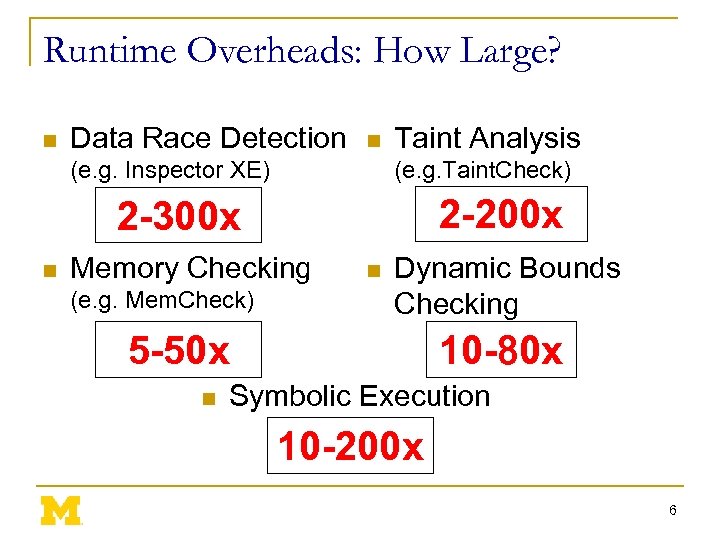 Runtime Overheads: How Large? n Data Race Detection n (e. g. Inspector XE) Taint Analysis (e. g. Taint. Check) 2 -200 x 2 -300 x n Memory Checking (e. g. Mem. Check) n Dynamic Bounds Checking 5 -50 x n 10 -80 x Symbolic Execution 10 -200 x 6
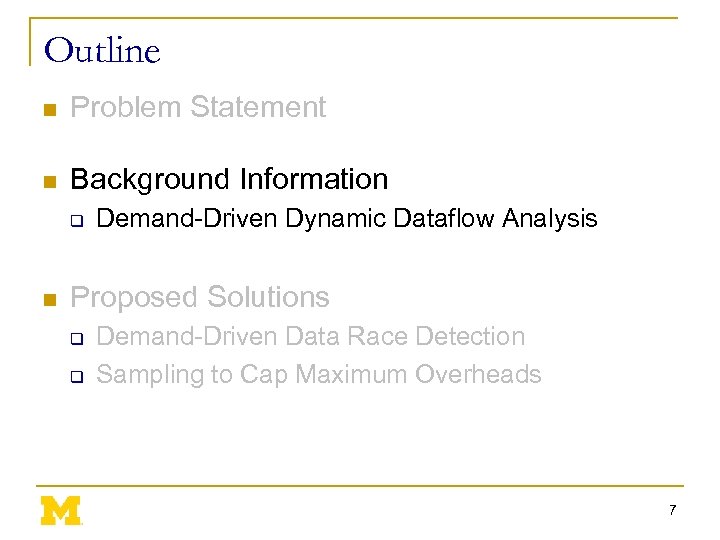 Outline n Problem Statement n Background Information q n Demand-Driven Dynamic Dataflow Analysis Proposed Solutions q q Demand-Driven Data Race Detection Sampling to Cap Maximum Overheads 7
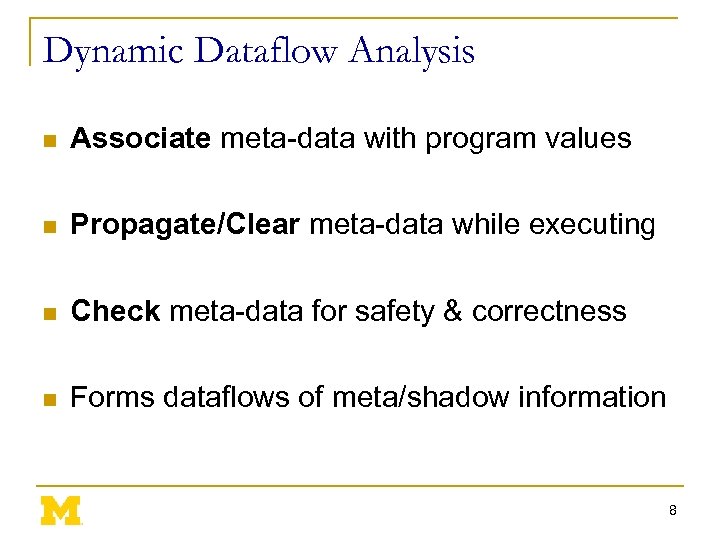 Dynamic Dataflow Analysis n Associate meta-data with program values n Propagate/Clear meta-data while executing n Check meta-data for safety & correctness n Forms dataflows of meta/shadow information 8
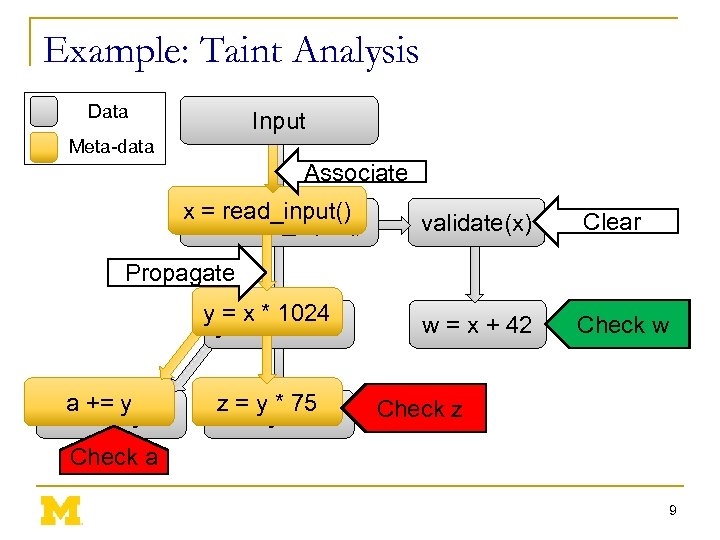 Example: Taint Analysis Data Input Meta-data Associate x = read_input() validate(x) Clear w = x + 42 Check w Propagate y = x * 1024 a += y z = y * 75 Check z Check a 9
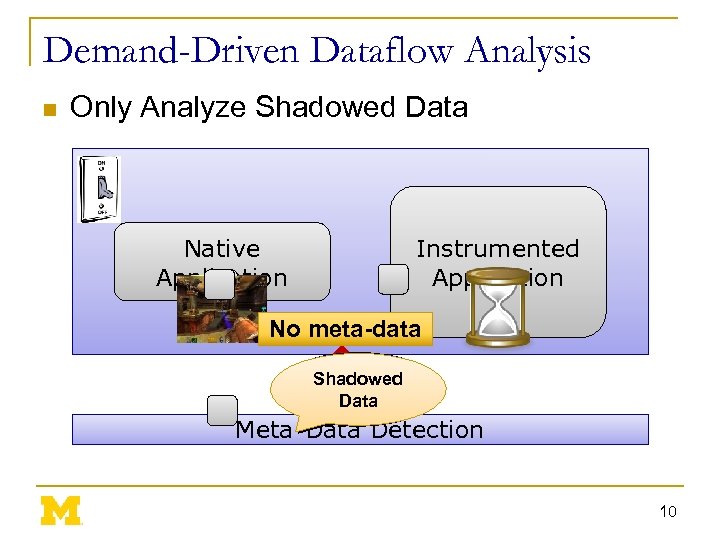 Demand-Driven Dataflow Analysis n Only Analyze Shadowed Data Instrumented Application Native Application No meta-data Non. Shadowed Data Meta-Data Detection 10
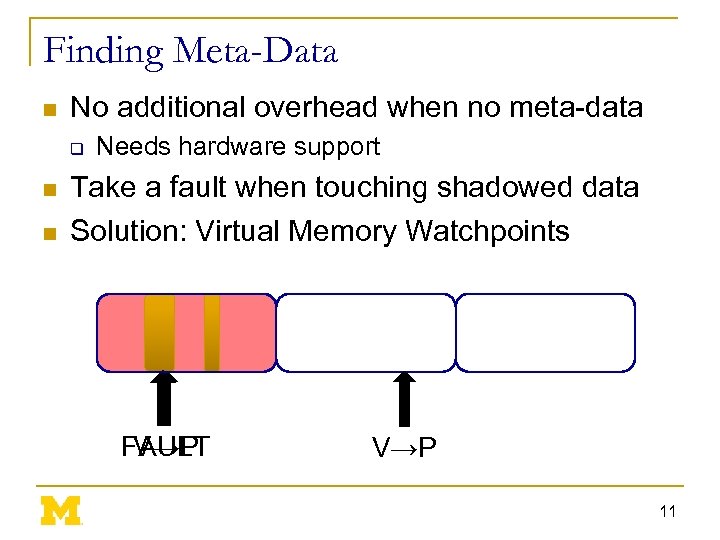 Finding Meta-Data n No additional overhead when no meta-data q n n Needs hardware support Take a fault when touching shadowed data Solution: Virtual Memory Watchpoints V→P FAULT V→P 11
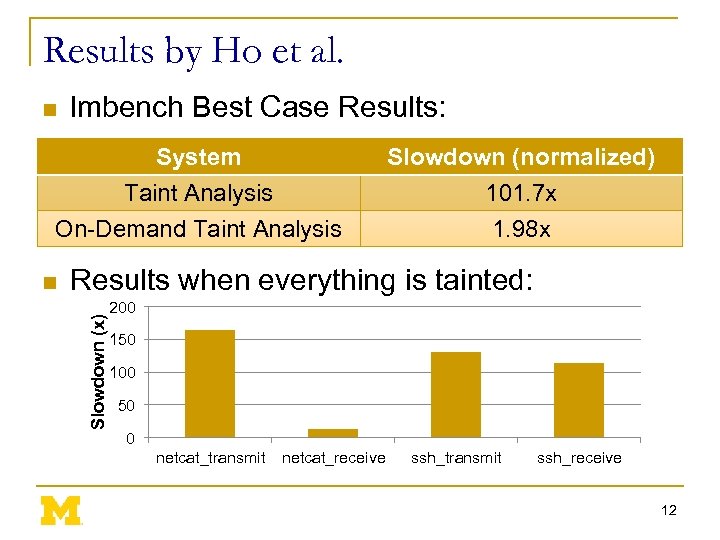 Results by Ho et al. n lmbench Best Case Results: System Taint Analysis On-Demand Taint Analysis Results when everything is tainted: Slowdown (x) n Slowdown (normalized) 101. 7 x 1. 98 x 200 150 100 50 0 netcat_transmit netcat_receive ssh_transmit ssh_receive 12
 Outline n Problem Statement n Background Information q n Demand-Driven Dynamic Dataflow Analysis Proposed Solutions q q Demand-Driven Data Race Detection Sampling to Cap Maximum Overheads 13
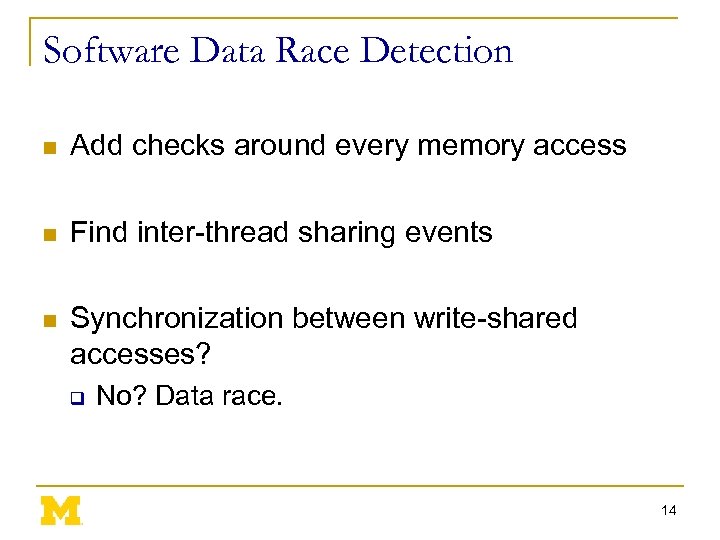 Software Data Race Detection n Add checks around every memory access n Find inter-thread sharing events n Synchronization between write-shared accesses? q No? Data race. 14
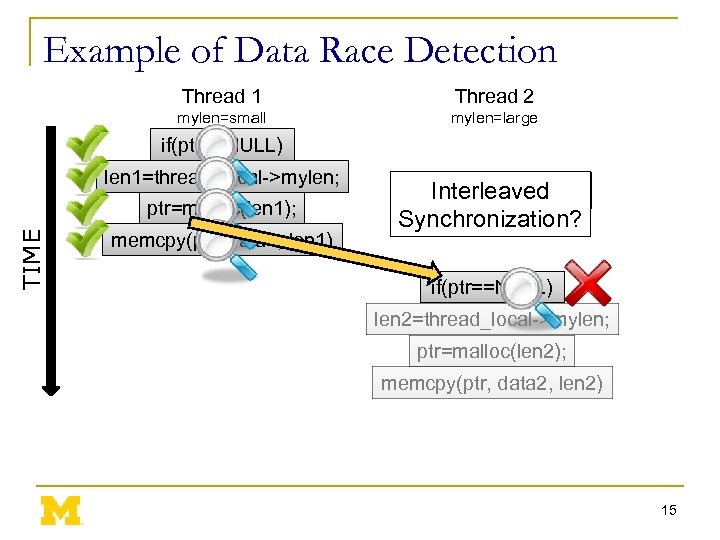 Example of Data Race Detection Thread 1 Thread 2 mylen=small mylen=large if(ptr==NULL) len 1=thread_local->mylen; TIME ptr=malloc(len 1); memcpy(ptr, data 1, len 1) ptr Interleaved write-shared? Synchronization? if(ptr==NULL) len 2=thread_local->mylen; ptr=malloc(len 2); memcpy(ptr, data 2, len 2) 15
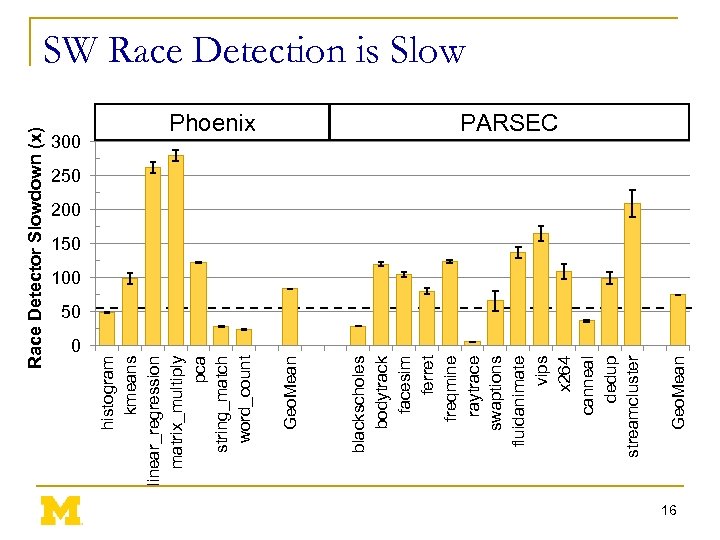 Race Detector Slowdown (x) 0 Geo. Mean Phoenix blackscholes bodytrack facesim ferret freqmine raytrace swaptions fluidanimate vips x 264 canneal dedup streamcluster Geo. Mean 300 histogram kmeans linear_regression matrix_multiply pca string_match word_count SW Race Detection is Slow PARSEC 250 200 150 100 50 16
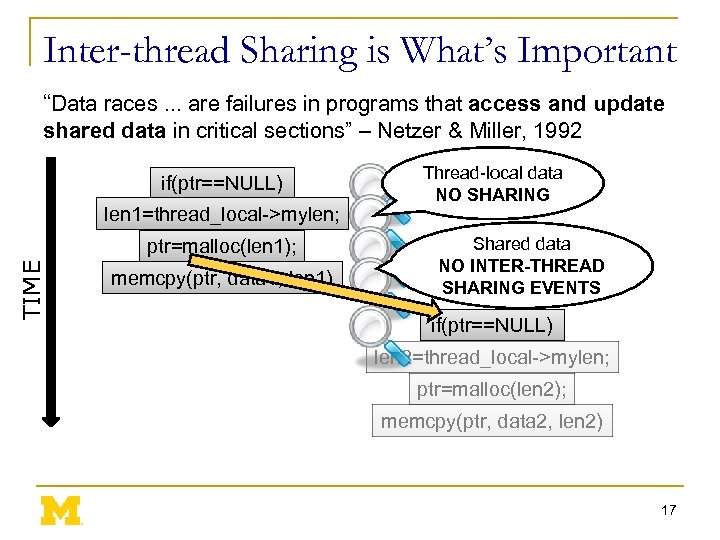 Inter-thread Sharing is What’s Important “Data races. . . are failures in programs that access and update shared data in critical sections” – Netzer & Miller, 1992 if(ptr==NULL) len 1=thread_local->mylen; TIME ptr=malloc(len 1); memcpy(ptr, data 1, len 1) Thread-local data NO SHARING Shared data NO INTER-THREAD SHARING EVENTS if(ptr==NULL) len 2=thread_local->mylen; ptr=malloc(len 2); memcpy(ptr, data 2, len 2) 17
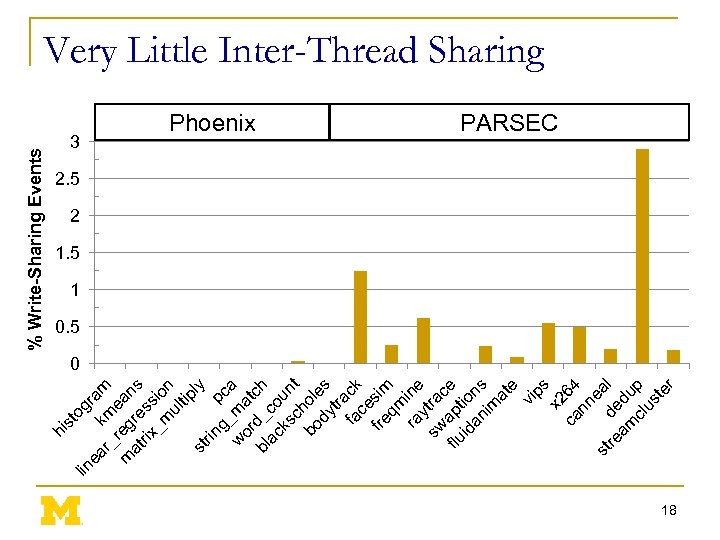 lin st og ea k ram r_ m m reg ean at re s rix ss _m io ul n tip ly st rin g_ pca w ma or t bl d_c ch ac o ks un c t bo hole dy s tra fa ck ce fre sim qm ra ine y sw tra c flu apt e id ion an s im at e vi ps x 2 ca 64 nn e st de al re am du cl p us te r hi % Write-Sharing Events Very Little Inter-Thread Sharing 3 Phoenix PARSEC 2. 5 2 1. 5 1 0. 5 0 18
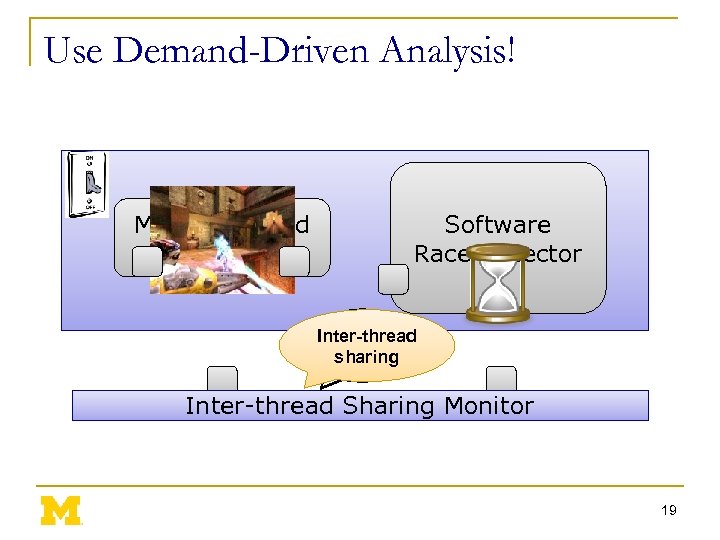 Use Demand-Driven Analysis! Multi-threaded Application Software Race Detector Inter-thread Local Access sharing Inter-thread Sharing Monitor 19
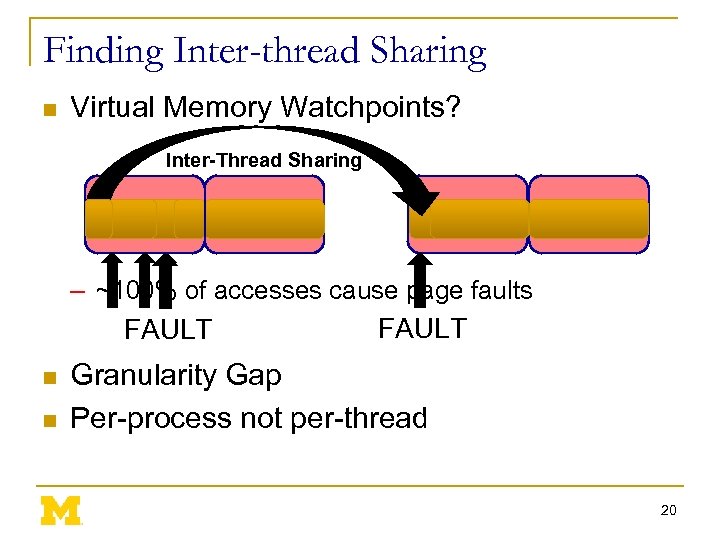 Finding Inter-thread Sharing n Virtual Memory Watchpoints? Inter-Thread Sharing – ~100% of accesses cause page faults FAULT n n FAULT Granularity Gap Per-process not per-thread 20
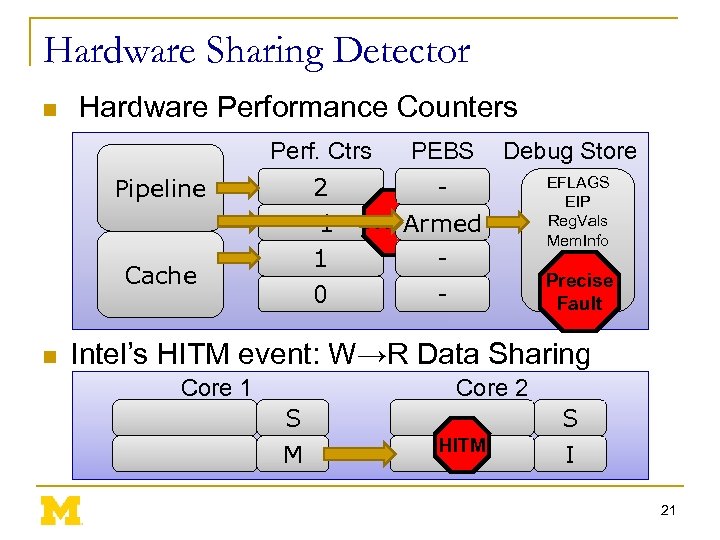 Hardware Sharing Detector n Hardware Performance Counters Perf. Ctrs 2 1 0 -1 0 0 Pipeline Cache n PEBS Debug Store FAULT Armed - EFLAGS EIP Reg. Vals Mem. Info Precise Fault Intel’s HITM event: W→R Data Sharing Core 1 Core 2 S M HITM S I 21
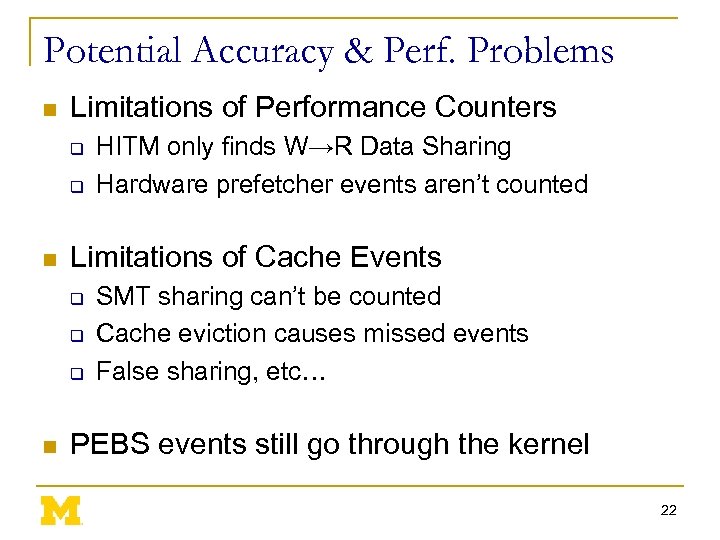 Potential Accuracy & Perf. Problems n Limitations of Performance Counters q q n Limitations of Cache Events q q q n HITM only finds W→R Data Sharing Hardware prefetcher events aren’t counted SMT sharing can’t be counted Cache eviction causes missed events False sharing, etc… PEBS events still go through the kernel 22
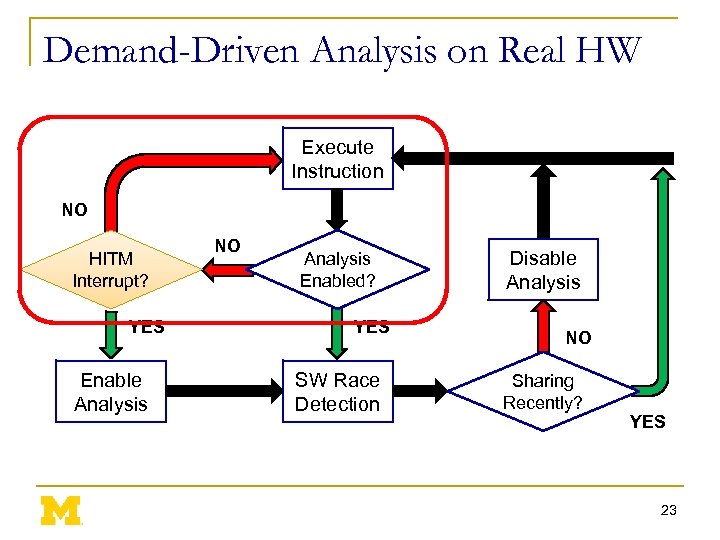 Demand-Driven Analysis on Real HW Execute Instruction NO HITM Interrupt? YES Enable Analysis NO Analysis Enabled? YES SW Race Detection Disable Analysis NO Sharing Recently? YES 23
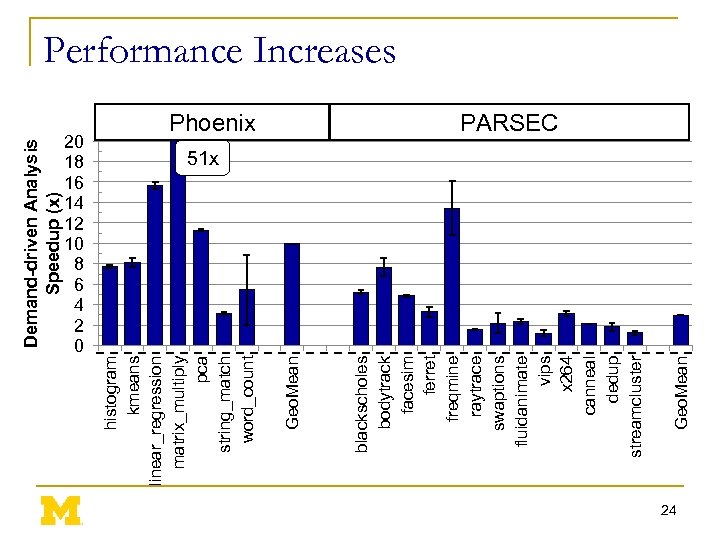 Demand-driven Analysis Speedup (x) 20 18 16 14 12 10 8 6 4 2 0 Geo. Mean Phoenix blackscholes bodytrack facesim ferret freqmine raytrace swaptions fluidanimate vips x 264 canneal dedup streamcluster Geo. Mean histogram kmeans linear_regression matrix_multiply pca string_match word_count Performance Increases PARSEC 51 x 24
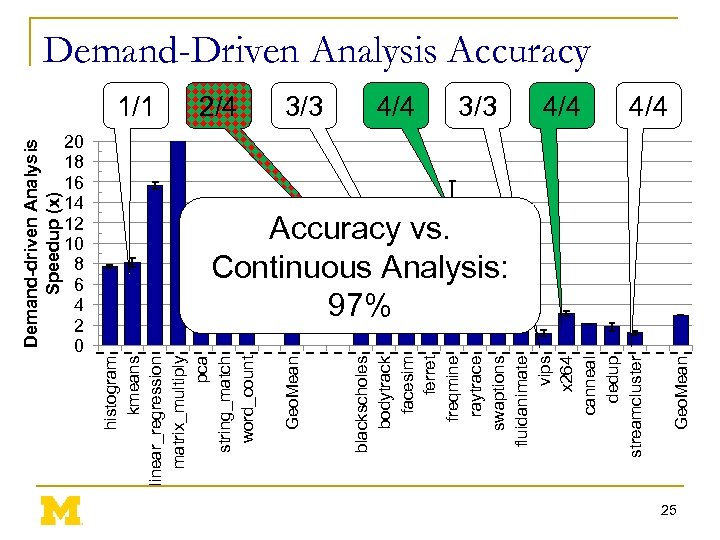 Demand-driven Analysis Speedup (x) 20 18 16 14 12 10 8 6 4 2 0 3/3 4/4 Geo. Mean 2/4 blackscholes bodytrack facesim ferret freqmine raytrace swaptions fluidanimate vips x 264 canneal dedup streamcluster 1/1 Geo. Mean histogram kmeans linear_regression matrix_multiply pca string_match word_count Demand-Driven Analysis Accuracy 4/4 Accuracy vs. Continuous Analysis: 97% 25
 Outline n Problem Statement n Background Information q n Demand-Driven Dynamic Dataflow Analysis Proposed Solutions q q Demand-Driven Data Race Detection Sampling to Cap Maximum Overheads 26
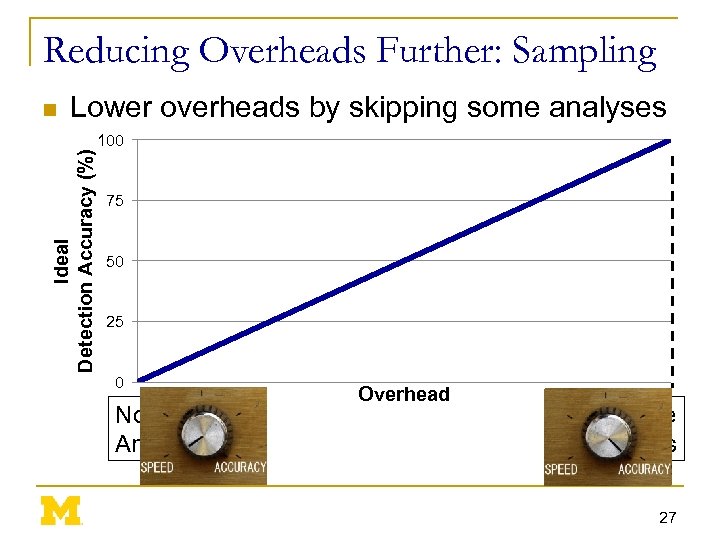 Reducing Overheads Further: Sampling n Lower overheads by skipping some analyses Ideal Detection Accuracy (%) 100 75 50 25 0 No Analysis Overhead Complete Analysis 27
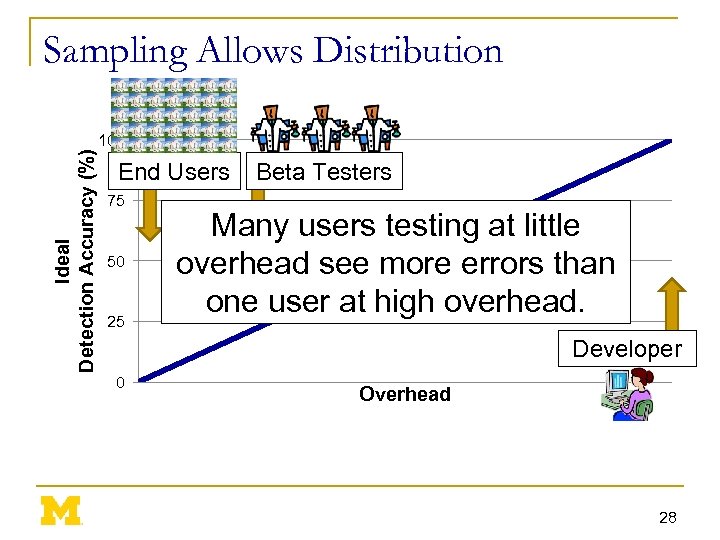 Sampling Allows Distribution Ideal Detection Accuracy (%) 100 End Users 75 50 25 Beta Testers Many users testing at little overhead see more errors than one user at high overhead. Developer 0 Overhead 28
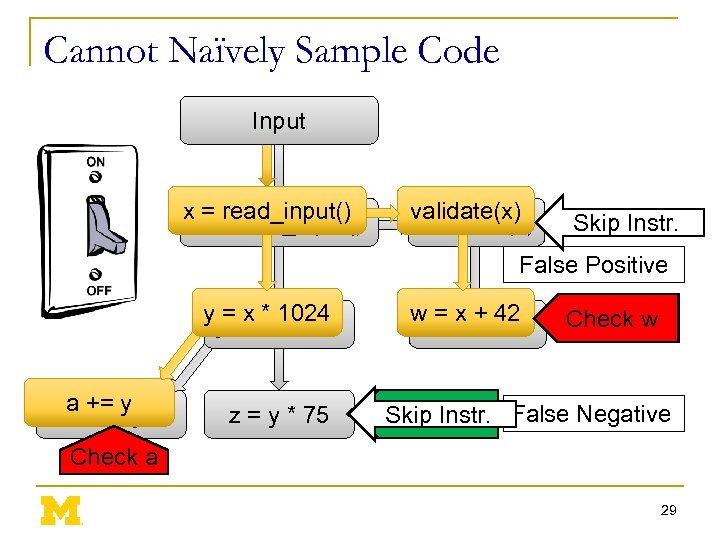 Cannot Naïvely Sample Code Input xx = read_input() validate(x) Validate(x) Skip Instr. False Positive yy = x * 1024 aa += y z = y * 75 w == x + 42 w x + 42 Check w Skip Instr. False Negative Check z Check a 29
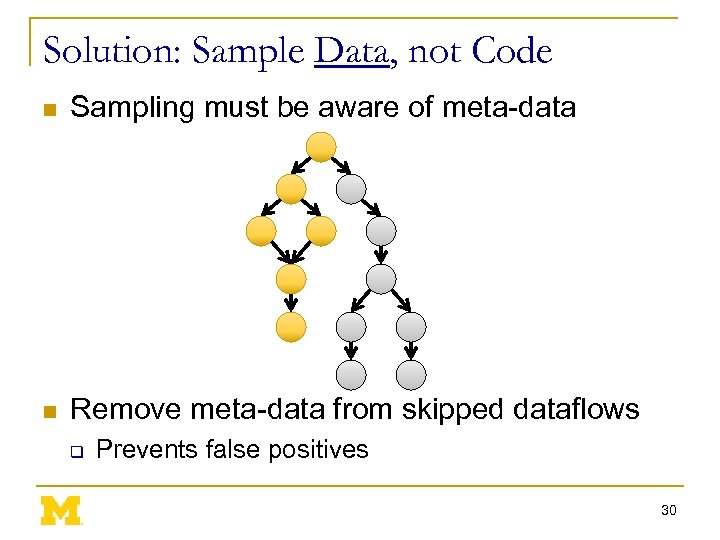 Solution: Sample Data, not Code n Sampling must be aware of meta-data n Remove meta-data from skipped dataflows q Prevents false positives 30
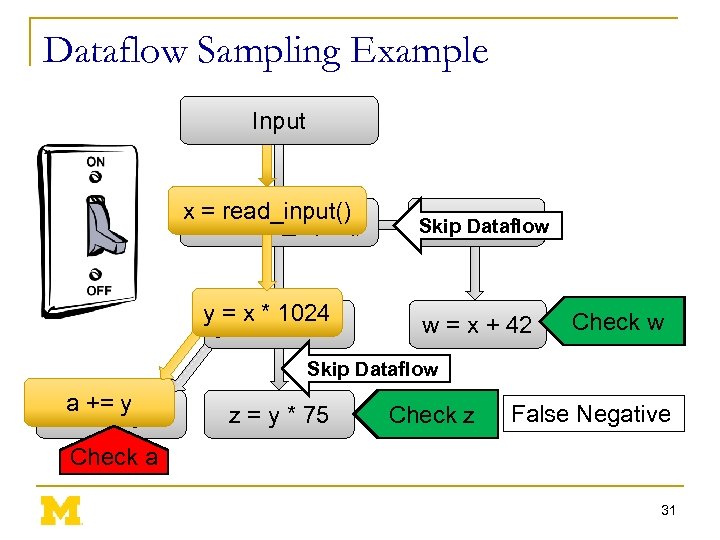 Dataflow Sampling Example Input xx = read_input() validate(x) Skip Dataflow yy = x * 1024 w = x + 42 Check w Skip Dataflow aa += y z = y * 75 Check z False Negative Check a 31
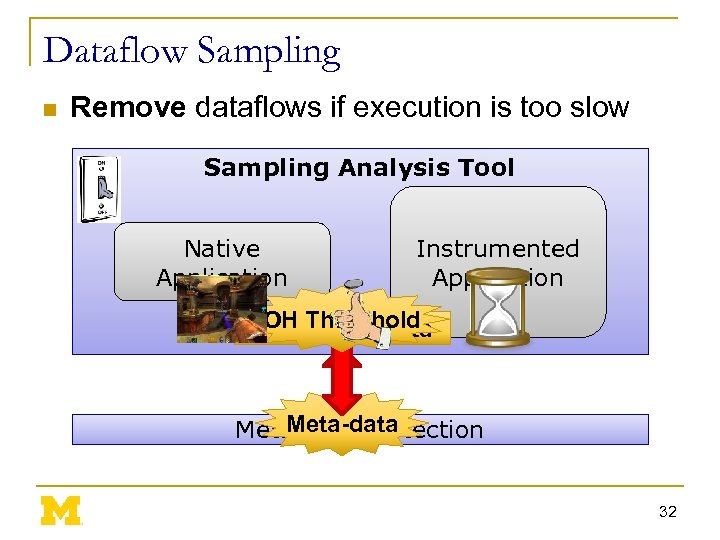 Dataflow Sampling n Remove dataflows if execution is too slow Sampling Analysis Tool Native Application Instrumented Application OH Threshold Clear meta-data Meta-Data Detection 32
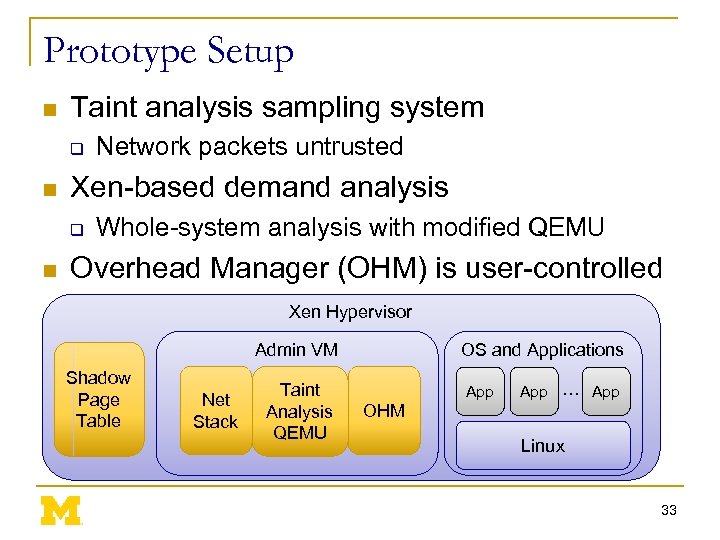 Prototype Setup n Taint analysis sampling system q n Xen-based demand analysis q n Network packets untrusted Whole-system analysis with modified QEMU Overhead Manager (OHM) is user-controlled Xen Hypervisor Admin VM Shadow Page Table Net Stack Taint Analysis QEMU OS and Applications App … App OHM Linux 33
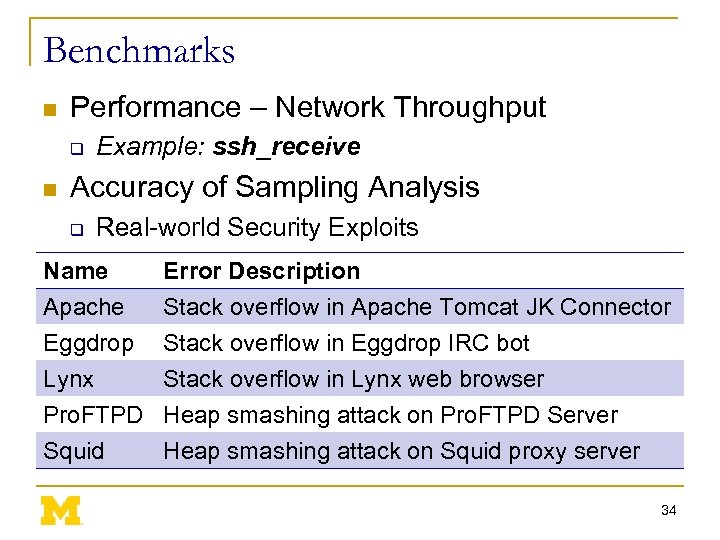 Benchmarks n Performance – Network Throughput q n Example: ssh_receive Accuracy of Sampling Analysis q Real-world Security Exploits Name Apache Eggdrop Lynx Error Description Stack overflow in Apache Tomcat JK Connector Stack overflow in Eggdrop IRC bot Stack overflow in Lynx web browser Pro. FTPD Heap smashing attack on Pro. FTPD Server Squid Heap smashing attack on Squid proxy server 34
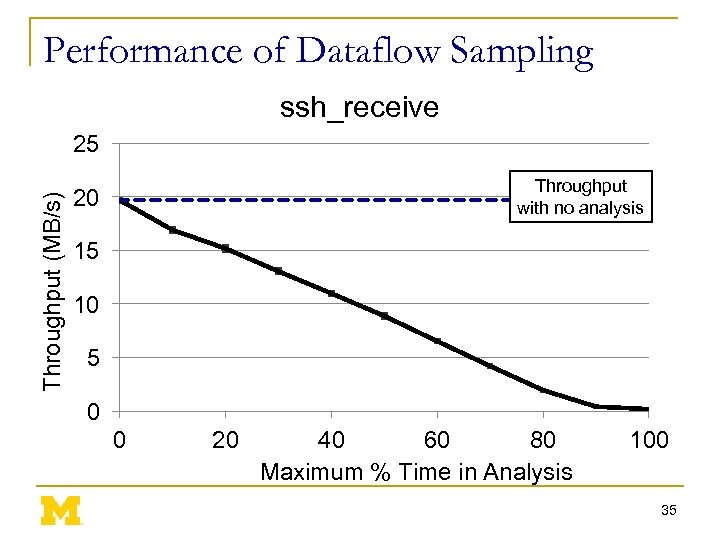 Performance of Dataflow Sampling ssh_receive Throughput (MB/s) 25 Throughput with no analysis 20 15 10 5 0 0 20 40 60 80 Maximum % Time in Analysis 100 35
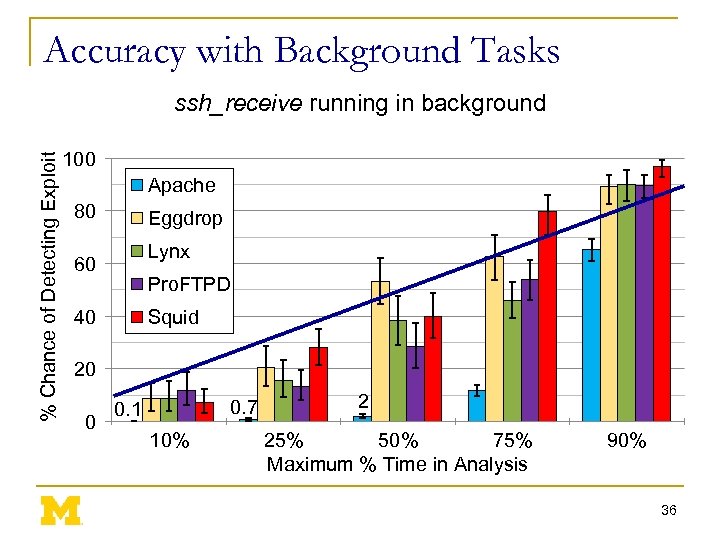 Accuracy with Background Tasks % Chance of Detecting Exploit ssh_receive running in background 100 Apache 80 Eggdrop Lynx 60 Pro. FTPD 40 Squid 20 0 0. 7 0. 1 10% 2 25% 50% 75% Maximum % Time in Analysis 90% 36
 BACKUP SLIDES 37
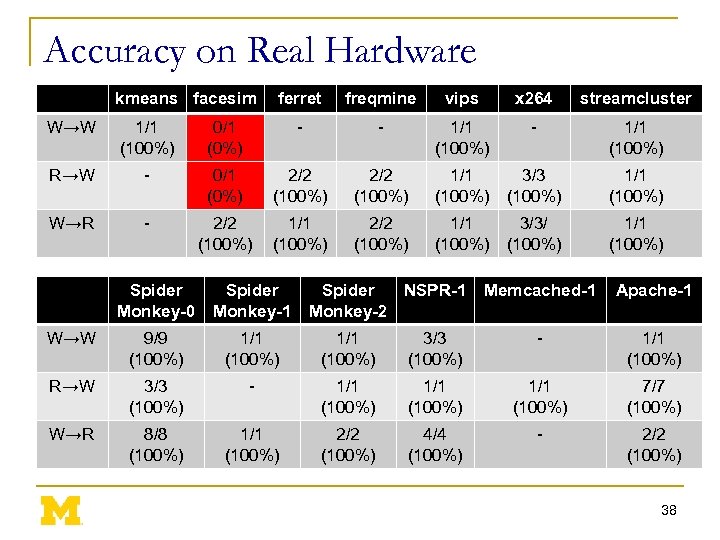 Accuracy on Real Hardware kmeans facesim ferret freqmine vips x 264 streamcluster W→W 1/1 (100%) 0/1 (0%) - - 1/1 (100%) R→W - 0/1 (0%) 2/2 (100%) 1/1 (100%) 3/3 (100%) 1/1 (100%) W→R - 2/2 (100%) 1/1 (100%) 3/3/ (100%) 1/1 (100%) Spider Monkey-0 Spider Monkey-1 Spider NSPR-1 Monkey-2 Memcached-1 Apache-1 W→W 9/9 (100%) 1/1 (100%) 3/3 (100%) - 1/1 (100%) R→W 3/3 (100%) - 1/1 (100%) 7/7 (100%) W→R 8/8 (100%) 1/1 (100%) 2/2 (100%) 4/4 (100%) - 2/2 (100%) 38
 Width Test 39


