

06ab121cece2b919ea7b32e564697465.ppt
- Количество слайдов: 48
 A Systems Approach to Safety Engineering Nancy G. Leveson Aero/Astro Engineering Systems
 Types of Accidents • Component Failure Accidents – Single or multiple component failures – Usually assume random failure • System Accidents – Arise in interactions among components – Related to interactive complexity and tight coupling – Exacerbated by introduction of computers and software © Copyright Nancy Leveson, Aug. 2006
 Chain-of-Events Model • Explains accidents in terms of multiple events, sequenced as a forward chain over time. – Simple, direct relationship between events in chain – Contrapositive (if A had not occurred, then B would not have) • Events almost always involve component failure, human error, or energy-related event • Forms the basis for most safety-engineering and reliability engineering analysis: e, g, FTA, PRA, FMECA, Event Trees, etc. and design: e. g. , redundancy, overdesign, safety margins, …. © Copyright Nancy Leveson, Aug. 2006
 Limitations of Chain-of-Events Model • Social and organizational factors in accidents • System accidents • Software • Human error • Adaptation – Systems are continually changing – Systems and organizations migrate toward accidents (states of high risk) under cost and productivity pressures in an aggressive, competitive environment © Copyright Nancy Leveson, Aug. 2006
 STAMP • Systems-Theoretic Accident Model and Processes – Accidents are not simply an event or chain of events but involve a complex, dynamic process – Based on systems and control theory • Accidents arise from interactions among humans, machines, and the environment Not simply linear causality, but more complex types of causal connections
 • Safety is an emergent property that arises when system components interact") STAMP (2) • Safety is an emergent property that arises when system components interact with each other within a larger environment – A set of safety constraints related to behavior of system components enforces that property – Accidents occur when interactions violate those constraints (a lack of appropriate constraints on the interactions) – “Controllers” embody or enforce those constraints – Goal of system safety engineering is to identify the safety constraints and enforce them in the system design
STAMP (2) • Safety is an emergent property that arises when system components interact with each other within a larger environment – A set of safety constraints related to behavior of system components enforces that property – Accidents occur when interactions violate those constraints (a lack of appropriate constraints on the interactions) – “Controllers” embody or enforce those constraints – Goal of system safety engineering is to identify the safety constraints and enforce them in the system design
 A Broad View of “Control” Note: • Does not imply need for a “controller” Component failures and dysfunctional interactions may be “controlled” through design (e. g. , redundancy, interlocks, fail-safe design) or through process • Manufacturing processes and procedures • Maintenance processes • Operations • Does imply the need to enforce the safety constraints in some way • New model includes what do now and more
 • Systems are not treated as a static design – A socio-technical") STAMP (3) • Systems are not treated as a static design – A socio-technical system is a dynamic process continually adapting to achieve its ends and to react to changes in itself and its environment – Migration toward states of high risk – Preventing accidents requires designing a control structure to enforce constraints on system behavior and adaptation
STAMP (3) • Systems are not treated as a static design – A socio-technical system is a dynamic process continually adapting to achieve its ends and to react to changes in itself and its environment – Migration toward states of high risk – Preventing accidents requires designing a control structure to enforce constraints on system behavior and adaptation
 • Views accidents as a control problem O-ring did not control propellant") STAMP (4) • Views accidents as a control problem O-ring did not control propellant gas release by sealing gap in field joint Software did not adequately control descent speed of Mars Polar Lander • Events are the result of the inadequate control Result from lack of enforcement of safety constraints
STAMP (4) • Views accidents as a control problem O-ring did not control propellant gas release by sealing gap in field joint Software did not adequately control descent speed of Mars Polar Lander • Events are the result of the inadequate control Result from lack of enforcement of safety constraints
 • To understand accidents, need to examine safety control structure itself to") STAMP (5) • To understand accidents, need to examine safety control structure itself to determine why inadequate to maintain safety constraints and why events occurred • To prevent accidents, need to create an effective safety control structure to enforce the system safety constraints • Not a “blame” model but a “why” model
STAMP (5) • To understand accidents, need to examine safety control structure itself to determine why inadequate to maintain safety constraints and why events occurred • To prevent accidents, need to create an effective safety control structure to enforce the system safety constraints • Not a “blame” model but a “why” model

 Accident Causality • Accidents occur when – Control structure or control actions do not enforce safety constraints • Unhandled environmental disturbances or conditions • Unhandled or uncontrolled component failures • Dysfunctional (unsafe) interactions among components – Control structure degrades over time (asynchronous evolution) – Control actions inadequately coordinated among multiple controllers
 Dysfunctional Controller Interactions Boundary areas Controller 1 Process 1 Controller 2 Process 2 Overlap areas (side effects of decisions and control actions) Controller 1 Process Controller 2
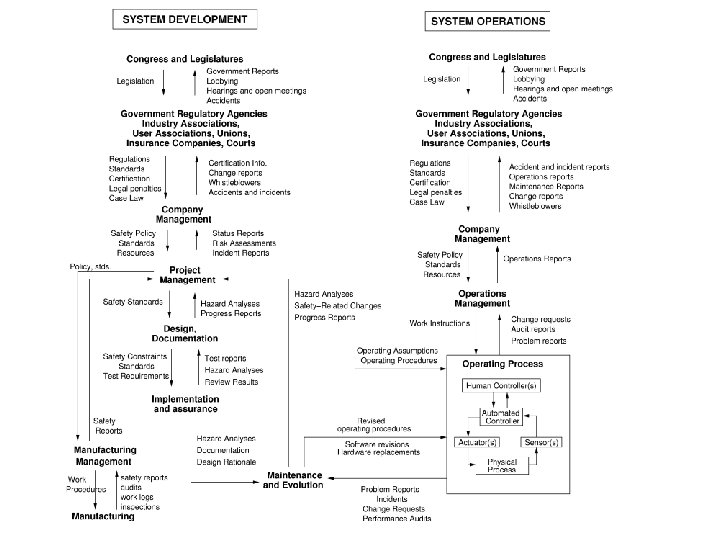
 Modeling Accidents Using STAMP Two types of models are used: 1. Static safety control structure 2. Behavioral dynamics (system dynamics) Dynamic processes behind change in the safety control structure, i. e. , why it may change (e. g. , degrade) over time © Copyright Nancy Leveson, Aug. 2006
 •") Uses for STAMP • Basis for new, more powerful hazard analysis techniques (STPA) • Safety-driven design • More comprehensive accident/incident investigation and root cause analysis • Organizational and cultural risk analysis – Defining safety metrics and performance audits – Designing and evaluating potential policy and structural improvements – Identifying leading indicators of increasing risk (“canary in the coal mine”) • New risk management tools – Policy analysis and evaluation – Risk analysis and control • New holistic approaches to security © Copyright Nancy Leveson, Aug. 2006
Uses for STAMP • Basis for new, more powerful hazard analysis techniques (STPA) • Safety-driven design • More comprehensive accident/incident investigation and root cause analysis • Organizational and cultural risk analysis – Defining safety metrics and performance audits – Designing and evaluating potential policy and structural improvements – Identifying leading indicators of increasing risk (“canary in the coal mine”) • New risk management tools – Policy analysis and evaluation – Risk analysis and control • New holistic approaches to security © Copyright Nancy Leveson, Aug. 2006
 • Supports a safety-driven design process where – Hazard analysis") STAMP-Based Hazard Analysis (STPA) • Supports a safety-driven design process where – Hazard analysis influences and shapes early design decisions – Hazard analysis iterated and refined as design evolves • Goals (same as any hazard analysis) – Identification of system hazards and related safety constraints necessary to ensure acceptable risk – Accumulation of information about how hazards can be violated, which is used to eliminate, reduce and control hazards in system design, development, manufacturing, and operations
STAMP-Based Hazard Analysis (STPA) • Supports a safety-driven design process where – Hazard analysis influences and shapes early design decisions – Hazard analysis iterated and refined as design evolves • Goals (same as any hazard analysis) – Identification of system hazards and related safety constraints necessary to ensure acceptable risk – Accumulation of information about how hazards can be violated, which is used to eliminate, reduce and control hazards in system design, development, manufacturing, and operations
 • Safety-Driven Design Process – Start with identifying system requirements and design") STPA (2) • Safety-Driven Design Process – Start with identifying system requirements and design constraints necessary to maintain safety. – STPA assists in top-down refinement into requirements and safety constraints on individual components. – STPA used to identify scenarios in which safety constraints can be violated. Use results to eliminate or control them in design, operations, etc.
STPA (2) • Safety-Driven Design Process – Start with identifying system requirements and design constraints necessary to maintain safety. – STPA assists in top-down refinement into requirements and safety constraints on individual components. – STPA used to identify scenarios in which safety constraints can be violated. Use results to eliminate or control them in design, operations, etc.
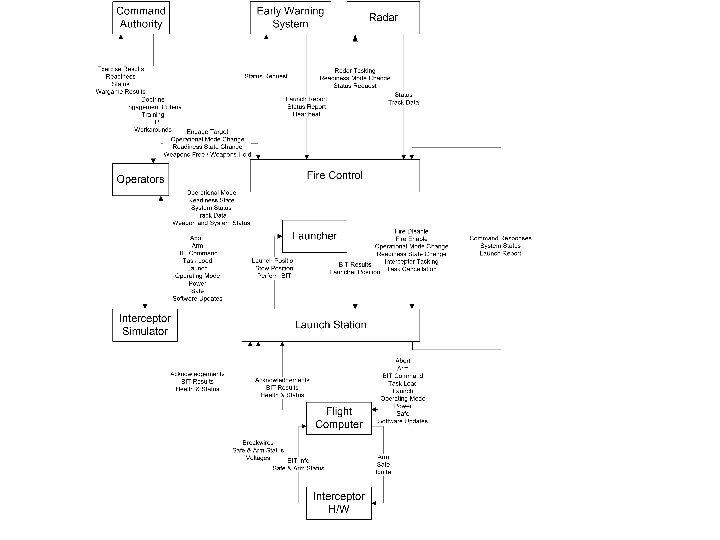
 Missile Defense • A large system-of-systems • Non-advocate safety assessment of inadvertent launch • STPA was the only technique they could find that would work on such a complex, software-intensive system • Have found a large number of potential safety problems that had to be fixed before the system could be deployed.
") Recent and Current Uses of STAMP • Aerospace – NASA Independent Technical Authority (ITA) risk analysis (operations) – NASA Exploration Systems risk management tools (development) Built STAMP and SD models and analyzed effects of things like: hiring constraints management reserves independence of safety decision-making requirements changes on schedule, cost, safety, and performance – Crew Exploration Vehicle (hazard analysis)
Recent and Current Uses of STAMP • Aerospace – NASA Independent Technical Authority (ITA) risk analysis (operations) – NASA Exploration Systems risk management tools (development) Built STAMP and SD models and analyzed effects of things like: hiring constraints management reserves independence of safety decision-making requirements changes on schedule, cost, safety, and performance – Crew Exploration Vehicle (hazard analysis)
 • Defense – Non-advocate safety assessment of") Recent and Current Uses of STAMP (2) • Defense – Non-advocate safety assessment of the Ballistic Missile Defense System – Singapore department of defense • Security (bioterrorism, internet worms) • Others are using it but I only hear indirectly
Recent and Current Uses of STAMP (2) • Defense – Non-advocate safety assessment of the Ballistic Missile Defense System – Singapore department of defense • Security (bioterrorism, internet worms) • Others are using it but I only hear indirectly
 • NGATS (Next") In Work or Planned • Corporate fraud (e. g. , Enron) • NGATS (Next Generation Air Transportation System) for FAA/NASA JPDO • Medical Electronic Health Records (and perhaps other medical applications) • Pharmaceutical testing • Railroads (Maglev) • Forest Fires (Department of the Interior) • Process industry (? ? ) • Security (NGATS)
In Work or Planned • Corporate fraud (e. g. , Enron) • NGATS (Next Generation Air Transportation System) for FAA/NASA JPDO • Medical Electronic Health Records (and perhaps other medical applications) • Pharmaceutical testing • Railroads (Maglev) • Forest Fires (Department of the Interior) • Process industry (? ? ) • Security (NGATS)
 • Built structural and dynamic models") Modeling the New NASA Independent Technical Authority (ITA) • Built structural and dynamic models of ITA • Identified system-level requirements to reduce poor engineering and management decision-making that leads to an accident • Identified gaps and omissions in ITA program design • Performed a rigorous risk analysis on resulting structure to determine: – Factors involved in successful or unsuccessful implementations – Leading indicators and metrics to identify increasing risk – Suggested policy changes in ITA design
Modeling the New NASA Independent Technical Authority (ITA) • Built structural and dynamic models of ITA • Identified system-level requirements to reduce poor engineering and management decision-making that leads to an accident • Identified gaps and omissions in ITA program design • Performed a rigorous risk analysis on resulting structure to determine: – Factors involved in successful or unsuccessful implementations – Leading indicators and metrics to identify increasing risk – Suggested policy changes in ITA design
 The Process
 Sensitivity Analysis Results Effectiveness and Credibility of ITA Time
 System Technical Risk Time
 Lagging vs. Leading Indicators • Number of waivers issued good indicator but lags rapid increase in risk Time
 Time
Time
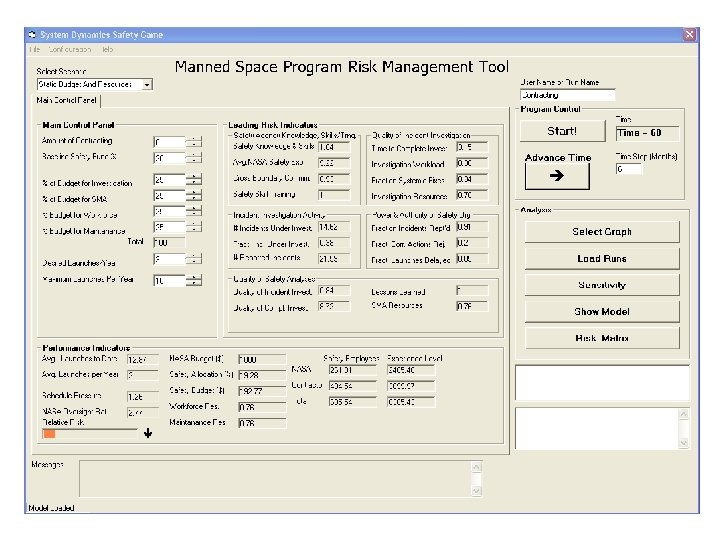
 Risk Management in NASA’s New Exploration Systems Mission Directorate • Created an executable model, using input from the NASA workforce, to analyze relative effects of management strategies on schedule, cost, safety & performance • Developed scenarios to analyze risks identified by the Agency’s workforce – Performed preliminary analysis on the effects of hiring constraints, management reserves, independence of safety decision-making, requirements changes, etc. • Derived preliminary recommendations to mitigate & monitor program-level risks
 ESMD Risk Management • Interview data for validation of the model was collected from 44 NASA employees at HQ, MSFC, JSC, & La. RC in the following offices & directorates: – – – – Office of the Administrator Office of the Chief Engineer (OCE) Office of Safety & Mission Assurance (OSMA) Office of Program Analysis & Evaluation (PA&E) Office of Institutions & Management ESMD Directorate Offices Program Offices Project Offices NASA Engineering & Safety Center (NESC) Center Safety & Mission Assurance Directorates Center Engineering Directorates Center Mission Operations Directorates The Astronaut Office
 Mapping the Control Structure to the SD Model Structure
 Structure of System Dynamics Model
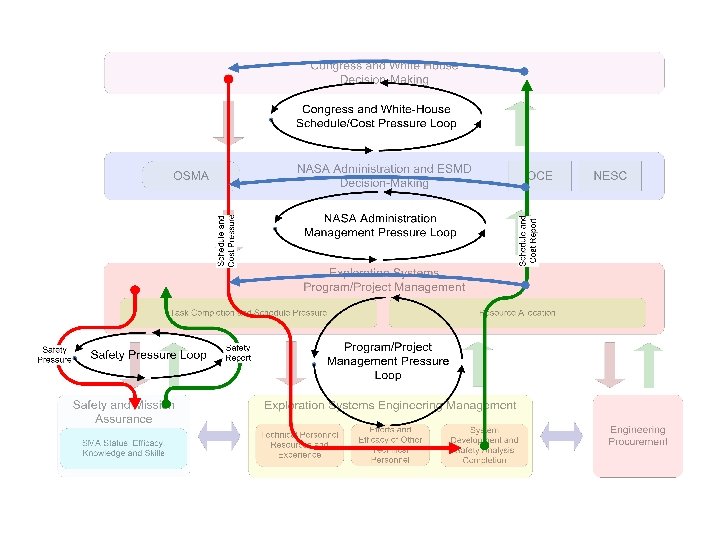
 Example Model Loops

 • To focus the preliminary analysis on issues of concern") ESMD Risk Management (2) • To focus the preliminary analysis on issues of concern to NASA, the results from the interviews were used for scenario development – Example: Workforce skill mix • Relevant aspects include: – Increase in retirements – Capability to hire new civil servants – Transfer of civil servants to & from other directorates • A scenario was built around variation of: – Initial experience distribution of ESMD civil servant workforce – Maximum civil servant hiring rates – Number of technical civil servants that transfer in from SOMD during Shuttle retirement
ESMD Risk Management (2) • To focus the preliminary analysis on issues of concern to NASA, the results from the interviews were used for scenario development – Example: Workforce skill mix • Relevant aspects include: – Increase in retirements – Capability to hire new civil servants – Transfer of civil servants to & from other directorates • A scenario was built around variation of: – Initial experience distribution of ESMD civil servant workforce – Maximum civil servant hiring rates – Number of technical civil servants that transfer in from SOMD during Shuttle retirement
 Example workforce planning insights: – Limits on civil servant hiring will have to be reduced to satisfy increased ESMD hiring needs – Otherwise, civil servant to contractor ratio will be lower than Agency average Note: In the charts below, the desired civil servant to support contractor ratio is fixed Limits on Hiring Pre-Shuttle Retirement Post-Shuttle Retirement Limits on Hiring + + Transfers from Shuttle +
 Agency Average Contracting Ratio Limits on Hiring + Space Shuttle Contracting Ratio + Limits on Hiring + Reliance on Support Contractors • As reliance on support contractors increases, the ultimate safety of the operational system decreases – Difficulty of oversight increases and quality decreases – Will a small ratio of civil servants to contractors work in a development environment?
 Scenario: Investigating Management Reserves Safety of Operational System Fraction of Work Remaining 1 2 Overoptimistic Planning Baseline Reserves Sufficient Reserves 0. 75 Overoptimistic Planning Baseline Reserves Sufficient Reserves 1. 5 0. 5 1 0. 25 0. 5 + 0 0 0 10 20 30 40 1. 50 60 70 80 90 100 110 120 130 140 150 Time (Month) 0 10 20 30 40 50 60 70 80 90 100 110 120 130 140 150 Time (Month) Management reserves have a large positive impact on completion time, & a smaller but significant impact on safety Reserve utilization, management, & monitoring is critical to dampen disturbances in workforce, budget, & technology availability Workforce overwork should be monitored & reserves should be used to alleviate it: 2. 3. • Critical areas include system engineering & integration, safety engineering, & safety assurance (Rework Cycle)
 Schedule Pressure Scenario: Effect of Schedule Pressure & Safety Priority High Low High Safety Priority 1. 2. 3. Overly aggressive schedule enforcement has little effect on completion time (<2%) & cost, but has a large negative impact on safety Priority of safety activities has a large positive impact, including a positive cost impact (less rework) Leading Indicators: Overwork, Impact of safety analyses on design, Acceptance of unsatisfied reqt’s, Operational workarounds
 Scenario: Consequence of High Safety Influence & Power on Decision-Making Fraction of Work Remaining Total In-House Final Cost Relative to Plan 1 2 High Baseline Low 0. 75 High Baseline Low 1. 7 0. 5 1. 4 0. 25 1. 1 0 0 20 2 40 60 80 100 120 Safety of Operational System 140 0. 8 0 20 40 60 80 100 120 140 Accepted Safety and Integration Problems 0. 4 1. 5 1 High Baseline Low 0. 3 0. 2 High Baseline Low 0. 5 0 0 1. 2. 3. 4. 20 0. 1 40 60 80 100 120 140 0 0 20 Positive impact on safety, potential negative impact on cost & schedule People concerned about safety are listened to Negative impact lessened through improved integration, & careful planning & anticipation of safety analysis requirements Leading indicators: Safety-based design changes, Safety overruling, Adequacy & stability of safety resources, Review time allocated to safety analyses & problems, Meeting Safety Reqt’s
 Scenario: Assignment of High-Level Technical Leaders to Safety Analyses Fraction of Work Remaining Status and Credibility of System Safety Analysts 1 0. 75 High Baseline Low 2 High Baseline Low 1. 3 0. 5 0. 25 0. 6 0 0 20 40 60 80 100 120 0 140 20 0. 4 High Baseline Low 3 60 80 100 120 140 Fraction of Late Safety Analyses Safety of Operational System 4 40 High Baseline Low 0. 2 2 1 + 0 0 0 20 1. 2. 3. 40 60 80 100 120 140 0 20 40 60 80 100 120 140 High impact on safety, minimal impact on schedule/cost Rotating technical leaders & “rising stars” into safety positions can increase the status, credibility, & impact of safety efforts Leading Indicators: Attractiveness of safety positions, Experience & skills of current & incoming workforce, Impact of safety analyses
 Scenario: Effect of Scope & Requirements Changes Fraction of Work Remaining Scope and Requirements Changes 2 2 1. 5 1 1 0. 5 Large Changes Small Changes Baseline 0. 5 0 0 20 40 0 60 80 100 120 0 140 Tasks with Accepted Safety and Integration Problems 0. 6 Large Changes Small Changes Baseline 0. 45 Large Changes Small Changes Baseline 20 40 60 80 100 120 140 Safety of Operational System 2 Large Changes Small Changes Baseline 1. 5 0. 3 1 0. 15 0. 5 0 0 0 20 1. 2. 3. 40 60 80 100 120 140 0 20 40 60 80 100 120 140 Small & frequent scope & requirements changes have a large negative impact Mitigation: Management reserves, operations planning, on/off-ramps for technologies & design, Improved SE&I Monitoring: Number of requirements changes, Number of unused or discarded designs & safety analyses, Schedule pressure, Overwork, Operational workarounds
 http:") Resources and Opportunities • New book on the model (about 300 pages written) http: //sunnyday. mit. edu/book 2. html • Commercial tools are being developed by Safeware Engineering Corp.
Resources and Opportunities • New book on the model (about 300 pages written) http: //sunnyday. mit. edu/book 2. html • Commercial tools are being developed by Safeware Engineering Corp.
 allows more powerful:") Summary • A new, more inclusive model of accident causation (STAMP) allows more powerful: – Hazard analysis techniques – Accident/incident investigation and root cause analysis – Design for safety starting in concept development – Project and organizational risk analysis and risk management tools – New, holistic approaches to security
Summary • A new, more inclusive model of accident causation (STAMP) allows more powerful: – Hazard analysis techniques – Accident/incident investigation and root cause analysis – Design for safety starting in concept development – Project and organizational risk analysis and risk management tools – New, holistic approaches to security