ae7a40b8d82c6ca762e1c392df437641.ppt
- Количество слайдов: 55


75% water 25% land ½ is too dry or too cold for large-scale agriculture 75% of world population lives along a river or a coastline. . . or 5% of the land area Or. . . ½ of a ¼

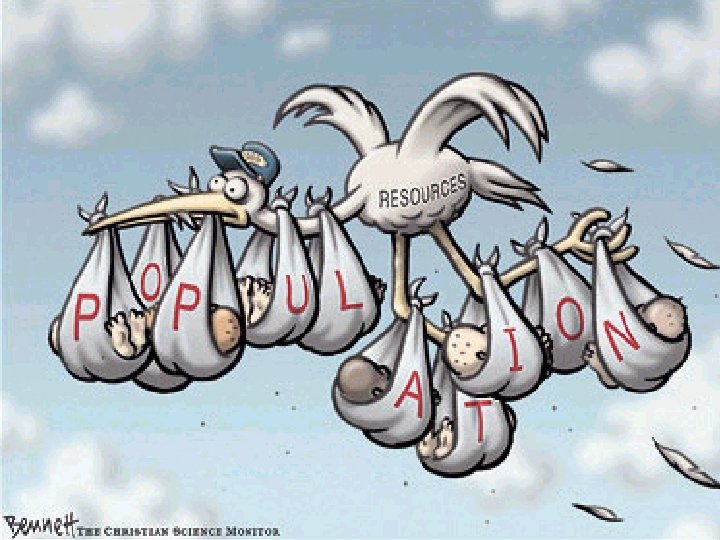
POPULATION Population concentrations 5. NORTHEAST NORTH AMERICA 3. EUROPE 2. SOUTH ASIA 1. EAST ASIA 4. SOUTHEAST ASIA

POPULATION Population density Arithmetic density = # people total land area Longwood University campus – 7, 994 students/sq. mi. D. Hardin

POPULATION Population density Physiologic density Agricultural density = = # people total arable land # people total farmed land D. Hardin

POPULATION Population density Carrying Capacity: The ability of a given amount of land To support a given number of people At a given level of technology D. Hardin

POPULATION Population density Egypt 2011 Population – 80, 410, 017 Total Land Area – 390, 117 sq. mi. Arable Land – 12, 873 sq. mi. (3. 3%) Farmed Land 1, 950 sq. mi. (0. 5%) Arithmetic Density 206 persons/sq. mi. (just a bit higher than Virginia) D. Hardin

POPULATION Population density Egypt Physiologic Density: 6, 246 persons/sq. mi. Agricultural Density: 41, 236 persons/sq. mi. ! D. Hardin

POPULATION Population change Natural Population Change Migration TP = OP + B – D + I - E Total Population Original Population Births Deaths Immigra- Emigration D. Hardin

POPULATION Population change Rates of change Highest – Niger: 3. 52% Lowest – Moldova: -0. 68% World average – 1. 1% (down from 1. 2%) It’s all in the numbers. Take two countries with identical growth rates (. 42%)… Grenada: 105, 303 X. 42% = 442 people annually China: 1, 353, 600, 687 X. 42% = 5, 685, 122 people annually That’s 70% of the population of Virginia every year! World: 7, 072, 887, 517 X 1. 1% = 77, 801, 762 people annually That’s nearly 10 Virginias every year! D. Hardin

POPULATION Population change 2000 2050 D. Hardin

POPULATION Demographic Transition Stage 1 Stage 2 Stage 3 Stage 4 Stage 5 Birth rate Total population Death rate Time D. Hardin

POPULATION Population Pyramids D. Hardin

POPULATION Demographic Transition & population pyramids Stage 1 Birth rate Total population Death rate Time D. Hardin

POPULATION Demographic Transition Stage 1 D. Hardin

POPULATION Demographic Transition & population pyramids Stage 1 Stage 2 Birth rate Total population Death rate Time D. Hardin

POPULATION Demographic Transition Stage 2 Nigeria Libya Iraq 2003 D. Hardin
![POPULATION Demographic Transition Stage 2 [Youth serves the Fuhrer] D. Hardin](https://present5.com/presentation/ae7a40b8d82c6ca762e1c392df437641/image-18.jpg "POPULATION Demographic Transition Stage 2 [Youth serves the Fuhrer] D. Hardin")
POPULATION Demographic Transition Stage 2 [Youth serves the Fuhrer] D. Hardin

POPULATION Demographic Transition Stage 2 Industrial Revolution Medical Revolution Hans Rosling video D. Hardin

POPULATION Demographic Transition Stage 1 Stage 2 Stage 3 Birth rate Total population Death rate Time D. Hardin

POPULATION Demographic Transition Stage 3 India Egypt Israel D. Hardin

POPULATION Demographic Transition Stage 3 D. Hardin

POPULATION Demographic Transition Stage 3 D. Hardin

POPULATION Demographic Transition Stage 3 D. Hardin

POPULATION Demographic Transition Stage 3 D. Hardin

POPULATION Demographic Transition Stage 3 Brazil 1970 s 1980 s 1990 s 2000 s

POPULATION Demographic Transition Stage 3 NUMBER OF CHILDREN IN THE LAST THREE GENERATIONS 60 50 Percentage 40 Grandparents 30 Parents You 20 10 0 1 -2 3 -4 5 -6 6 -7 >7

POPULATION Demographic Transition Stage 1 Stage 2 Stage 3 Stage 4 Birth rate Total population Death rate Time D. Hardin

POPULATION Demographic Transition Stage 4 Canada Australia United States D. Hardin

POPULATION Demographic Transition Stage 4 …while allowing seniors their independence… Social Security decreases poverty among the elderly… Per capita Social Security expenditures and poverty rate for 65+, 1959 -2009 …and creating the nuclear family. D. Hardin

POPULATION Demographic Transition Stage 1 Stage 2 Stage 3 Stage 4 Stage 5 Birth rate Total population Death rate Time D. Hardin

POPULATION Demographic Transition Stage 5 Japan Germany Switzerland D. Hardin

POPULATION Demographic Transition Stage 5 Germany’s “Guest Workers” D. Hardin

POPULATION Demographic Transition Stage 5 Germany’s “Guest Workers” D. Hardin

POPULATION Demographic Transition Stage 5 Germany’s “Guest Workers” D. Hardin

POPULATION Demographic Transition U. S. population pyramids D. Hardin

POPULATION Demographic Transition Ageing U. S. population D. Hardin

POPULATION Demographic Transition Ageing U. S. population D. Hardin

POPULATION Demographic Transition Ageing U. S. population Voter Turn-out by Age, 1976 -2008 ? D. Hardin

POPULATION Population change Natural Population Change Migration TP = OP + B – D + I - E Total Population Original Population Births Deaths Immigra- Emigration D. Hardin

POPULATION Migration Immigration "Give me your tired, your poor, Your huddled masses yearning to breathe free, The wretched refuse of your teeming shore. Send these, the homeless, tempest-tossed to me. I lift my lamp beside the golden door. " D. Hardin

POPULATION Migration Immigration Average Migrant Profile • Young – average in the 20 s (age most willing to do hard, distasteful work) • Educated – average some high school; the best and brightest coming to US (“brain drain”) • Motivated – decision to migrate is more than the average person is willing to risk; willing to endure hardship so their children will have better lives (“American Dream”) D. Hardin

POPULATION Migration Immigration Population Pyramids for Hispanic Citizens and Immigrants in Virginia, 2006 D. Hardin

POPULATION Migration Immigration U. S. -Mexico border San Diego San Ysidro United States Mexico Tijuana D. Hardin

POPULATION Migration Hispanic population: US D. Hardin

POPULATION Migration Hispanic population: nativist fears D. Hardin

POPULATION Migration Hispanic population: VA Region of Birth for Virginia’s Foreign Born 1990 2000 2010 D. Hardin

POPULATION Migration Hispanic population: VA D. Hardin

POPULATION Migration Internal D. Hardin

POPULATION Migration Internal D. Hardin

POPULATION Migration Internal D. Hardin

POPULATION Migration Internal D. Hardin

POPULATION Migration Internal Gerrymandering D. Hardin

POPULATION Migration Internal Redistricting in Virginia D. Hardin

POPULATION Demographic Transition Stage 1 Stage 2 Stage 3 Stage 4 Stage 5 Birth rate Total population Death rate Time D. Hardin
ae7a40b8d82c6ca762e1c392df437641.ppt