

8bee5c7ab0afcd5d9a4a29f4e089fe9d.ppt
- Количество слайдов: 28
 3 D Radiative Transfer in Cloudy Atmospheres: Diffusion Approximation and Monte Carlo Simulation for Thermal Emission K. N. Liou, Y. Chen, and Y. Gu Department of Atmospheric and Oceanic Sciences, UCLA • • 3 D Clouds in the Atmosphere and in Climate Models 3 D Radiative Transfer: Diffusion Approximation 3 D Thermal Radiative Transfer: Monte Carlo Simulation 3 D Results for Cirrus Clouds: Some Thought on Flux, Heating Rate, and Absorption
 A Global View of Clouds from A GOES Satellite
 September 14, 1995 Top") 3 -D Cirrus Observations from Lidar (E. Eloranta, SBIRS ) September 14, 1995 Top View 24 km 12 km 6 km North 24 km Side View
3 -D Cirrus Observations from Lidar (E. Eloranta, SBIRS ) September 14, 1995 Top View 24 km 12 km 6 km North 24 km Side View
 Figure 3. Illustrative 2 D cirrus cloud images located at the Southern Great Plains (SGP/ARM/DOE) derived from a 35 GHz radar on August 14 (top) and March 22, 2001 (bottom).
 Cirrus/Contrail Aerosol/Dust Radiative Transfer/A Unified Theory for Light Scattering by Ice Crystals and Aerosols
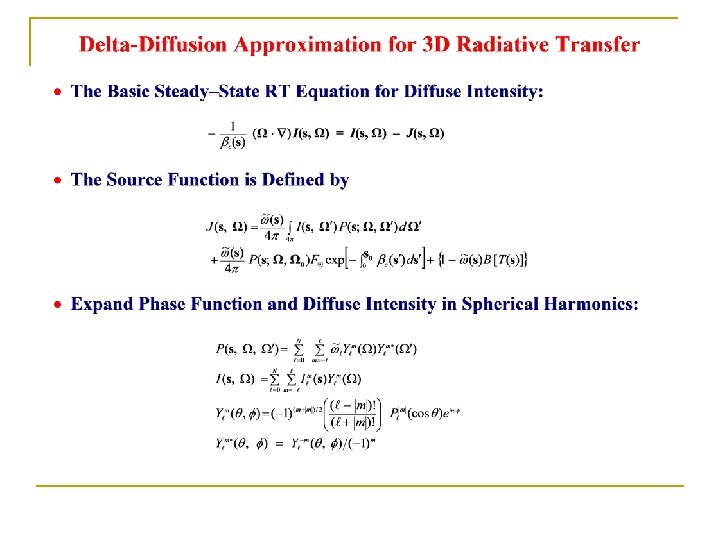
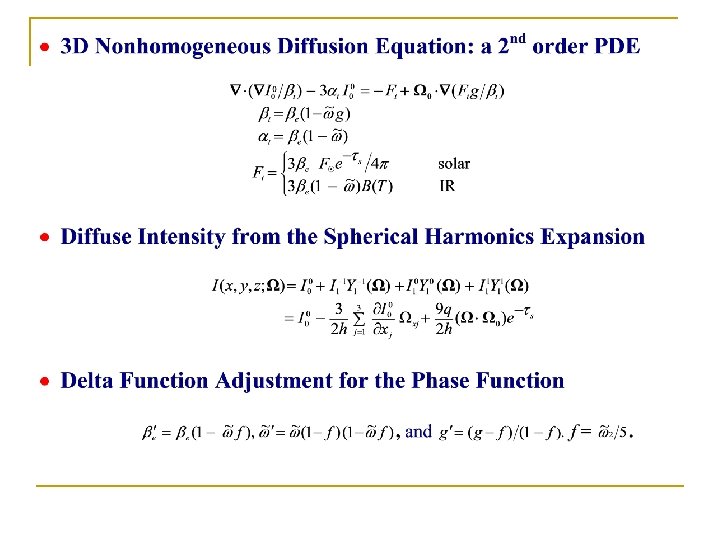
 in") · Decomposition of the Basic Equation and Successive Integrations: · First-order Approximation (N=1) in Cartesian Coordinates:
· Decomposition of the Basic Equation and Successive Integrations: · First-order Approximation (N=1) in Cartesian Coordinates:
 Multigrid Method for Solving Diffusion Equation Solving the diffusion equation on a series of coarser grids first and subsequently interpolating the coarse grid correction back to the pre-specified fine grid. Performing the major computational work on the coarse grid. High frequency errors are relaxed on the fine grid and low frequency errors are relaxed on the coarse grid.
 Schematic Overview for 3 D Infrared Monte Carlo Radiative Transfer Model
 Parameterization of Gaseous and Ice Cloud Emissivities Cubic Gas Cell Emissivity Cubic Cirrus Cell Emissivity
 3 D Inhomogeneous Radiative Transfer Models for Clouds • Monte Carlo “exact” method, delta-diffusion approximation (DDA), and independent pixel-by-pixel approximation (IPA) • Correlated k-distribution method for incorporation of gaseous absorption in multiple scattering atmosphere: 121 wavelength to cover solar (0. 2 -5 mm) and thermal IR (5 -50 mm) • Parameterization of the single-scattering properties in terms of ice/water content and mean effective size/radius
 Broadband Infrared Flux and Cooling Rate for Plane-Parallel Clear Atmosphere: Monte Carlo vs Fu and Liou Subarctic Winter Midlatitude Summer Tropical US Standard
 Broadband Infrared Flux and Cooling Rate for Plane-Parallel Cirrus Cloudy Atmosphere: Monte Carlo vs Fu and Liou Subarctic Winter Midlatitude Summer Tropical US Standard
 Remote Sensing of 3 -D Inhomogeneous Clouds Combined Satellite and Mm-Wave Radar June 1, 2002 3 -D Cloud Imaging in a Mesoscale Grid
 for 3 D RT Calculation") Input 3 D IWC data (Satellite + Mm-wave Radar) for 3 D RT Calculation
Input 3 D IWC data (Satellite + Mm-wave Radar) for 3 D RT Calculation
 3 D Cloud Mapping in a Mesoscale Grid (b) Validation Figure 2 (a)") (a) 3 D Cloud Mapping in a Mesoscale Grid (b) Validation Figure 2 (a) Three-dimensional ice water content (IWC, 0 -0. 28 g/m 3) and mean effective ice crystal size (DE, 0 -196 μm) determined from a unification of the optical depth and DE retrieval from the 0. 63 and 3. 7 μm AVHRR channels aboard the NOAA-14 satellite and the IWC and DE retrieved from the 35 GHz cloud radar over the ARM-SGP CART site at 2023 UTC on April 18, 1997. The 3 D IWC and DE results are presented in xy, yz, and xz planes over a 40 km x 4. 5 km domain. (b) Time series of the flight altitude and the position of the flight track of the North Dakota Citation over the ARM-SGP CART site on April 18, 1997 (upper panel). Comparison of the mean (symbols) and standard deviations (bars) of the retrieved IWC and DE values from the unification approach involving satellite and cloud radar observations derived from in situ measurements taken on board the University of North Dakota Citation, as functions of aircraft leg height (lower panels) (Liou et al. , 2002).
(a) 3 D Cloud Mapping in a Mesoscale Grid (b) Validation Figure 2 (a) Three-dimensional ice water content (IWC, 0 -0. 28 g/m 3) and mean effective ice crystal size (DE, 0 -196 μm) determined from a unification of the optical depth and DE retrieval from the 0. 63 and 3. 7 μm AVHRR channels aboard the NOAA-14 satellite and the IWC and DE retrieved from the 35 GHz cloud radar over the ARM-SGP CART site at 2023 UTC on April 18, 1997. The 3 D IWC and DE results are presented in xy, yz, and xz planes over a 40 km x 4. 5 km domain. (b) Time series of the flight altitude and the position of the flight track of the North Dakota Citation over the ARM-SGP CART site on April 18, 1997 (upper panel). Comparison of the mean (symbols) and standard deviations (bars) of the retrieved IWC and DE values from the unification approach involving satellite and cloud radar observations derived from in situ measurements taken on board the University of North Dakota Citation, as functions of aircraft leg height (lower panels) (Liou et al. , 2002).
 3 D Cloud Mapping in a Mesoscale Grid
 3 D Radiative Heating Rate in a Mesoscale Grid Figure 2. The left panels illustrate three-dimensional solar heating and IR heating/cooling rates in a mesoscale grid, presented in the xy, yz, xz planes computed from the 3 D inhomogeneous radiative transfer model developed by Gu and Liou (2001). The input 3 D cloud IWC and DE fields were from those presented in Fig. 1 a. The solar constant, solar zenith angle, and surface albedo used were 1366 W/m 2, 60 o, and 0. 1 respectively. The standard atmospheric temperature and gaseous profiles were employed in the calculations. The right panels represent the domain-averaged (xy plane) solar heating and IR heating/cooling rates as functions of cloud height.
 Comparison of 3 D broadband Solar Heating Rates 3 D Monte Carlo 3 D DDA relative difference (%) IPA relative difference (%)
 Comparison of 3 D broadband IR Heating Rates 3 D Monte Carlo 3 D DDA relative difference (%) IPA relative difference (%)
 Domain Average Heating Rate in a Cirrus Cloud Solar Heating Thermal IR Heating
 3 D Radiative Transfer in Cloudy Atmospheres: Diffusion Approximation and Monte Carlo Simulation for Thermal Emission K. N. Liou, Y. Chen, and Y. Gu Department of Atmospheric and Oceanic Sciences, UCLA • • 3 D Clouds in the Atmosphere and in Climate Models 3 D Radiative Transfer: Diffusion Approximation 3 D Thermal Radiative Transfer: Monte Carlo Simulation 3 D Results for Cirrus Clouds: Some Thought on Flux, Heating Rate, and Absorption