9e95cac0f5f38c8441305da43718606e.ppt
- Количество слайдов: 40


25 th November 2010 Developing the measurement of harm Insert name of presentation on Master Slide

Global Trigger Tool • Standardised measurement of harm in acute hospitals. • Wales is the only country to use it as a national measure. • Purpose – Track harm – Characterise harm

Developments • Research • Primary Care • Further developments • Support

Measuring harm and informing quality improvement longitudinally in NHS Wales • Four year programme funded by the National Institute for Health Research • Led by Cardiff University in collaboration with Imperial College • Aims to build on the progress NHS Wales has made in the global adoption of the Global Trigger Tool • Phase 1: (Years 1 and 2) will assess the validity of the GTT for widespread use across the NHS • Phase 2 aims to concentrate NHS GTT resources and the research teams resources around a single tool

Automated Universal Trigger Tool Graham Copeland Consultant Surgeon

UK global Trigger Tool u Adult care – 32 variables – 5 modules u General care u Surgical care u Intensive care u Medication care u Laboratory tests
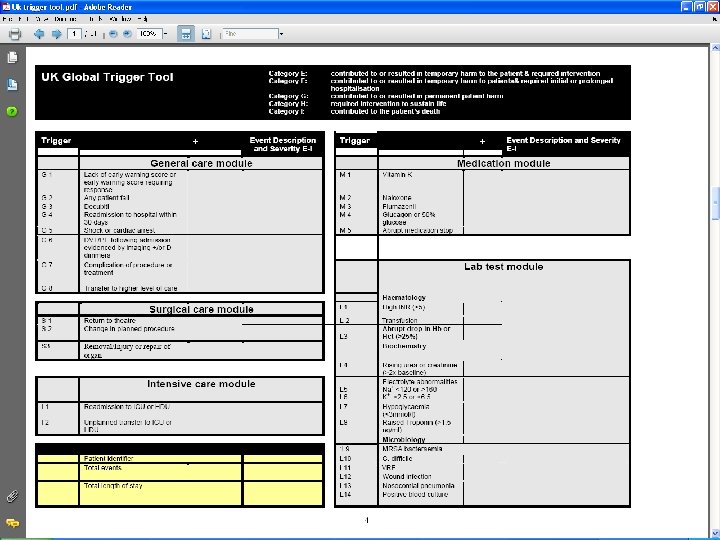

Usual technique u Review random case notes – 50 initially – Then 20 per month u Identify trigger events u Assess causation

Problems u Very labour intensive u Only a tiny sample of the whole – Credibility with clinicians u Random selection – Can be few triggers – Difficult to show improvements over time u Not all triggers result in harm

Avoiding these problems u Assess ALL patients admitted – Increase credibility with clinicians – Allows comparison over time u Prioritise selection of cases for review – Maximises potential improvements – Focuses review on harm
 – Demographic data – Admission Source")
Automated data sources u Hospital episode statistic (HES) – Demographic data – Admission Source – Diagnostic codes – Procedure codes – ITU data – Outcome data u Mortality u Re-admission

Automated data sources u Pathology system u Radiology system u Bed management system u Theatre management system

Universal Trigger Tool HES Surrogates u Manual comparison of 10, 000 random cases over a 2 year period – Coding vs manual review u Manual comparison of all mortalities over a 3 year period (120 cases/month) – Coding vs manual review u u u Correlation between trigger and best fit to code combinations 95% accuracy of trigger detection for the more complex trigger events Only harm events produce automated trigger

Universal Trigger Tool HES Surrogates u Some direct mapping codes u Some triggers require multiple codes Complications – 147 codes u Some triggers require complex code combination – Failure to respond to deterioration in EWS - combination of 3 -5 codes u Some have no code but are still part of the HES dataset
 –")
Universal Trigger Tool HES Surrogates u Some are easy (Direct single code maps) – Hyponatraemia – Hypernatraemia – Hypokalaemia – Hyperkalaemia E 87. 1 E 87. 0 E 87. 6 E 87. 5 – Wound infection T 81. 4

Universal Trigger Tool HES Surrogates u Some require multiple single codes – Complications 147 – Hypotension and cardiac arrest 8 – Sudden cessation of treatment 7 u Some require combinations – Nosocomial pneumonia u 5 Code sets + Y 95 X

Universal Trigger Tool HES Surrogates u Complex combinations – Elective admission + procedure code + myocardial infarction code = Post-op MI – Admission source + episode identifiers and critical care flow dates gives HDU/ITU information

Universal Trigger Tool HES Surrogates u Potential problems with HES – i. LAB suggested 40% inaccuracy – Takes first man standing u However accuracy in surgery 95% u Automated system takes – ‘Last man standing approach’ – Radically decreases inaccuracy

PS u If you think I’m intending to reveal all the CRAB code THINK AGAIN !!!

Universal Trigger Tool HES Surrogates For single relationship codes 99% u For multiple codes relationship 99% u For more complex relationships 95% u Some areas may potentially over-assess u – Orthopaedic prosthetic complications – Orthopaedic prosthetic infections – Pressure ulcers/MRSA/C difficle Causation u Some areas may potentially under-assess – Falls Harm

SOFTWARE u CRAB trigger tool module u CRAB Clinical Informatics – c-ci. definingdesign. co. uk u Internalised system – Real time monitoring once coded – Produces automated exception report for non-coded – 28 day delay to allow readmission – Automated reports

Triggers u Triggers recorded – 10% of admissions – Water muddied by day cases u Large volume in surgery, endoscopy u Very few trigger events (<0. 2%) u Unless converted to overnight or readmitted u Excluding day cases – Trigger events in 31%

Triggers u Consultant specific data – Patients with triggers 31. 2% – Patients with 3 or more 3. 7% – Average number of triggers per admission 0. 5% – Range u Excluding the 1 patient 100%’s u 4. 4 to 51. 1% u 2 lowest orthopaedic consultants

Triggers u Commonest – General medicine u Elderly care u Respiratory u Gastrointestinal 37% 26 -52% 25 -42% 30 -44% u Other high groups – Obstetrics/gynaecology

Module types u General care u Lab test u Surgical care u Intensive care u Medication 71. 3% 20. 3% 6. 9% 0. 3% 1. 3%

General care module % of total in group Readmission u Complication u EWS/Cardiac arrest/shock u Transfer to higher level u Decubiti u DVT/PE u u Fall 54% 20% 14. 2% 4% 3. 5% 2. 3% 1. 4%
 u Haematological 25. 7% u Urea/electrolyte")
Lab test module (% of total in group) u Haematological 25. 7% u Urea/electrolyte 34. 6% u Hypoglycaemia u Troponin u C. difficile/MRSA u Wound infection 4. 2% u Nosocomial pneumonia u Blood culture 6. 4% 16. 1% 2. 2% 3. 6% 7. 1%

Variation of numbers of patients with trigger events > Trigger events
 > Triggers events")
Variation of numbers of patients with trigger events (Mortality) > Triggers events

Effect of mortality on trigger events u 85% patients who die have at least 1 trigger event u 34% have 3 or more u 5% have 6 or more u 5 patients had 10!
 u No sessional variation – General care module – Lab")
Trends (myths and facts) u No sessional variation – General care module – Lab test module u Medication – Highest Jan to May – Lowest in the summer
 u Intensive care – Small numbers – Large variations –")
Trends (myths and facts) u Intensive care – Small numbers – Large variations – Related to occupancy levels u Surgical care – Peak July/ August – Lowest Winter

Change technique u Automated e mail to all consultants – Monthly trigger report – Performance in speciality (%) u Automated management report – Performance overall and in all modules – Variation over time – Highlights for u Cquin u LIPS

Change technique u Mortality review group – Review all deaths >4 triggers u Divisional governance groups – Review all patients >3 triggers – Review variations in individuals – Automated data sheets u Overseen by Benchmarking Group u Report to Clinical Governance Committee and Board

CONCLUSION u Automated Trigger tool analysis possible u Accurate and reproducible u Can allow focused review u Can monitor changes over time u Perhaps the time has come to revisit the methodology u Could increase clinician engagement

Developments • Research • Primary Care • Further developments • Support • Automate?

Any Questions?
9e95cac0f5f38c8441305da43718606e.ppt