49b1901d38c6d9cdafa8af9a8c57f610.ppt
- Количество слайдов: 50
 22 nd APAN Meeting in Singapore National University of Singapore, July 17 -21, 2006 Operational Fisheries Application of RS/GIS in Japan Sei-Ichi SAITOH*, Hidetada KIYOFUJI*, Daichi TACHIKAWA**, Mihoko ABE**, Kazuhiko TATEYAMA** and Motoki HIRAKI*** * Hokkaido University ** FUJITSU Hokkaido Systems Limited *** GIS Hokkaido Limited
 Contents • Background • Objectives • ubiquitous • • Information System Overview of Information Transfer Hierarchical Product Structure Web. GIS and Onboard GIS Concluding Remarks
 Fisheries as Social Systems RS/GIS logistics Fishing Fish Market 特 売 ウ ニ Retail Stock Release Aquaculture Sea Ranching Sustainability Consumer
 Geographical Information System • Dynamic Information") Fisheries-GIS • 4 -D (x, y, z, t) Geographical Information System • Dynamic Information of Oceanic Features
Fisheries-GIS • 4 -D (x, y, z, t) Geographical Information System • Dynamic Information of Oceanic Features
 Objectives For sustainable use and fisheries management…… • To develop fisheries information system • To produce high value-added fisheries oceanographic information • To provide such information in near real time in anytime and at anywhere (Ubiquitous) …. . using remote sensing and GIS
 Fisheries Information System L&X-band Satellite Receiving Module NOAA・Aqua/Terra SST Real time and Chl Tera. Scan automatic processing Sea Ice Datebase Module Oracle Analysis Module • Calculate • Overlay • raster to vector ERDAS/Imagine Arc. IGIS Module Web. GIS Onboard. GIS Arc. IMS Geo. Base Internet Clients Satellite Communication
 and Onboard GIS") Characteristics For sustainable use and fisheries management…… • Web. GIS(Arc. IMS) and Onboard GIS (GEOBASE) • Ubiquitous information system using satellite communication (WIDE-STAR and SUPERBIRD) • High value-added fisheries oceanographic information (Hierarchical Structure) • Near real time with automatic data processing (ERDAS/Imagine and Arc. GIS) and data base management system (ORACLE) …. . using remote sensing and GIS
Characteristics For sustainable use and fisheries management…… • Web. GIS(Arc. IMS) and Onboard GIS (GEOBASE) • Ubiquitous information system using satellite communication (WIDE-STAR and SUPERBIRD) • High value-added fisheries oceanographic information (Hierarchical Structure) • Near real time with automatic data processing (ERDAS/Imagine and Arc. GIS) and data base management system (ORACLE) …. . using remote sensing and GIS
 SUPERBIRD(6 Mbps) J-SAT(3") Overview of Information Transfer Communication satellite MODIS Database Analysis WIDESTAR(64 Kbps) SUPERBIRD(6 Mbps) J-SAT(3 Mbps) Internet GPS Display Overlay Measure Web. GIS(Land) Onboard GIS (Offshore)
Overview of Information Transfer Communication satellite MODIS Database Analysis WIDESTAR(64 Kbps) SUPERBIRD(6 Mbps) J-SAT(3 Mbps) Internet GPS Display Overlay Measure Web. GIS(Land) Onboard GIS (Offshore)
 Satellite Communication • SUPERBIRD-D 110 E Coverage
 • Pacific Saury (Cololabis saira) •") Target Species • Japanese common Squid (Todarodes pacificus) • Pacific Saury (Cololabis saira) • Albacore (Thunnus alalunga) • Skipjack (Katsuwonus Pelamis)
Target Species • Japanese common Squid (Todarodes pacificus) • Pacific Saury (Cololabis saira) • Albacore (Thunnus alalunga) • Skipjack (Katsuwonus Pelamis)
 Fishing fleets detected by OLS/DMSP Squid Pacific saury October 13, 1998
 Distribution and Migration Okhotsk Sea of Japan Bering Sea Northwestern Pacific Squid Skipjack saury Albacore
 Service Regions Squid Albacore saury
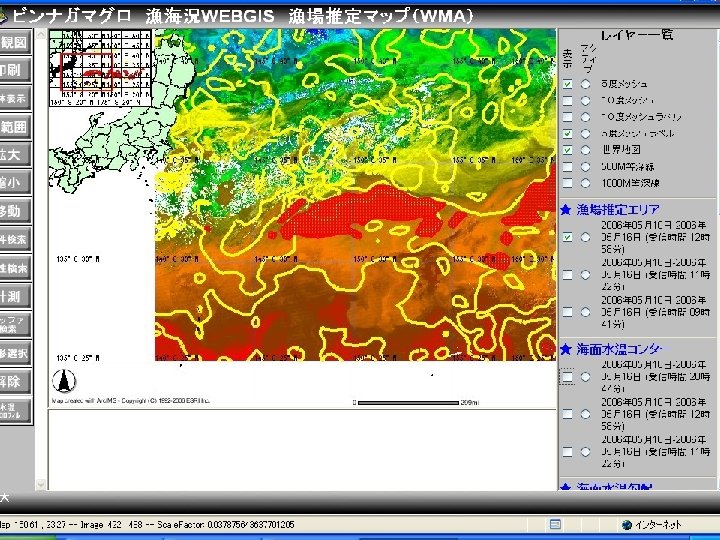
 Hierarchical Structure Level 1 Product Processing Level 2 Product Combination Level 3 Product Integration Level 4 Product Potential Fishing Ground
 Brief descriptions of each product level Product level and Product description 1 Raster-image data from the Terascan system 2 Single-image processing such as SST gradient or contour line 3 Integration of Level 1 and Level 2 products 4 Estimated potential fishing ground 5 Predicted one- or two-days-forward fishing ground
 (www. ncfisheries. net/fishes/) Japan") How to make potential fishing ground Albacore tuna (Thunnus alalunga) (www. ncfisheries. net/fishes/) Japan Oyashio Questions of interest: Why albacore – abundant What oceanographic factors – habitat How to determine – proxy indicators Subarctic Front Shatsky Rise Kuroshio Emperor Seamount Chain Kuroshio Extension Subtropical Front
How to make potential fishing ground Albacore tuna (Thunnus alalunga) (www. ncfisheries. net/fishes/) Japan Oyashio Questions of interest: Why albacore – abundant What oceanographic factors – habitat How to determine – proxy indicators Subarctic Front Shatsky Rise Kuroshio Emperor Seamount Chain Kuroshio Extension Subtropical Front
 How to make potential fishing ground JAFIC DATA BASE Fisheries Satellite RS NASA, RSS and AVISO Monthly 1998 -2003 Classified fishing data High catch data Arc. GIS Enhancement Visualization Spatial analyst Examination Visualization Simple prediction habitat Probability of environmental map Statistical model Geostatistical for prediction CPUE analyst Potential albacore habitat TRMM/TMI-AVHRR SST Sea. Wi. FS SSC T/P-ERS Merged SSHA GAM-GLM Oceanic features: eddies, fronts
 Method 1 : Simple prediction map Input map Combine SSHA High catch range (mean ± one SD) 13. 5 ± 19. 16 cm Chl-a 0. 3 ± 0. 11 mg m-3 SST 19. 5 ± 1. 52 °C Arc. GIS: Spatial analyst Output map
 Method 2 : Environmental probability map Input map Fishing effort CPUE SSHA + Chl-a + SST + Arc. GIS: Spatial analyst Prob. Each interval Average Output map 1. Fishing efforts : indices of fish availability (Andrade & Garcia, 1999) 2. CPUEs: indices of fish abundance (Bertrand et al. , 2002)
 Method 3 : Statistical model for prediction Input map Satellite data SSHA Catch data GAM Piecewise GLM Chl-a Stepwise GLM -Residual deviance -AIC -F-statistic SST Arc. GIS: Geostatistical analyst Output map Significant equation
 Space. Fish LLP was estabulished on June 20,") Space Fish LLP (Limited Liability Partnership) Space. Fish LLP was estabulished on June 20, 2006
Space Fish LLP (Limited Liability Partnership) Space. Fish LLP was estabulished on June 20, 2006
 TOREDAS: start to fish Traceable Operational Resources Environment Data Acquisition System
 SUPERBIRD(6 Mbps) J-SAT(3") Overview of Information Transfer Communication satellite MODIS Database Analysis WIDESTAR(64 Kbps) SUPERBIRD(6 Mbps) J-SAT(3 Mbps) Internet GPS Display Overlay Measure Web. TOREDAS(Land) Onboard TOREDAS (Offshore)
Overview of Information Transfer Communication satellite MODIS Database Analysis WIDESTAR(64 Kbps) SUPERBIRD(6 Mbps) J-SAT(3 Mbps) Internet GPS Display Overlay Measure Web. TOREDAS(Land) Onboard TOREDAS (Offshore)
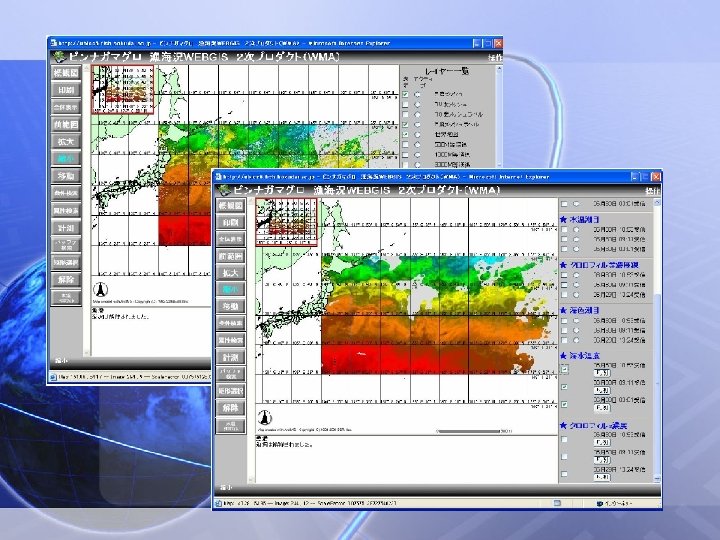
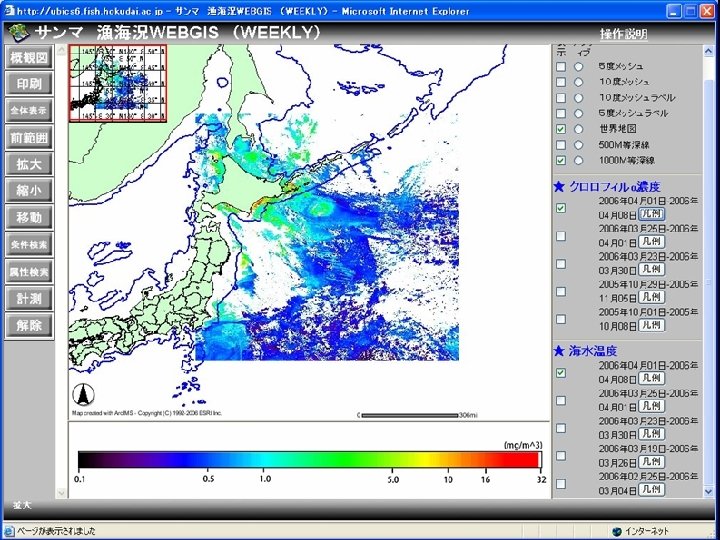
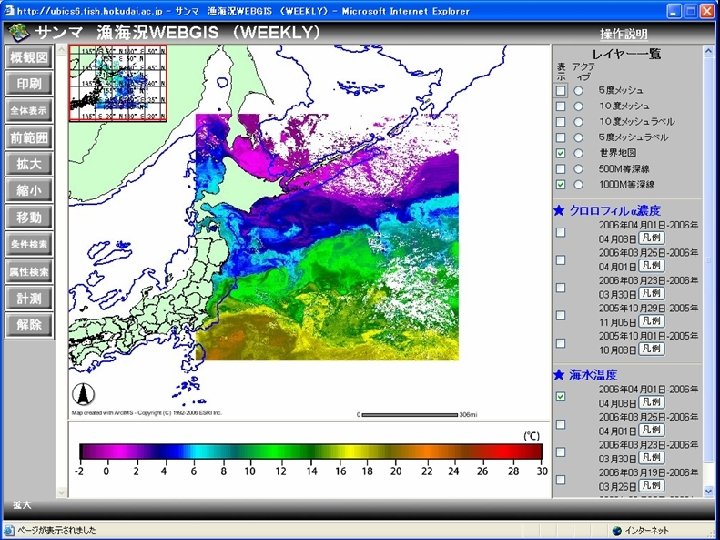
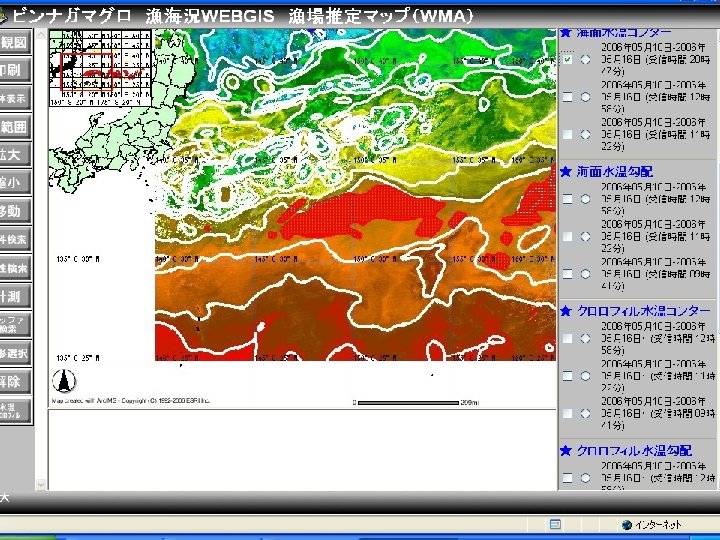
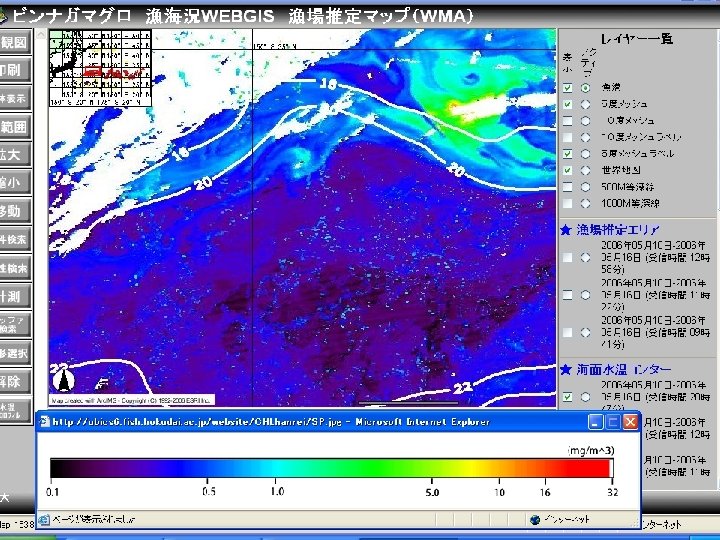
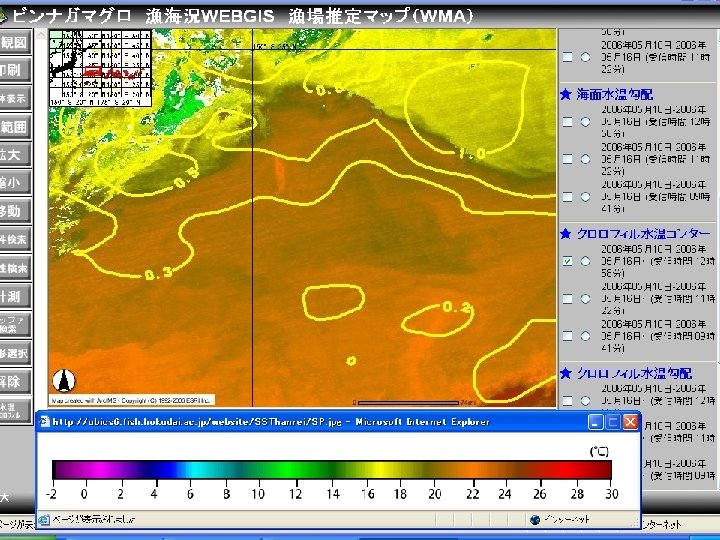
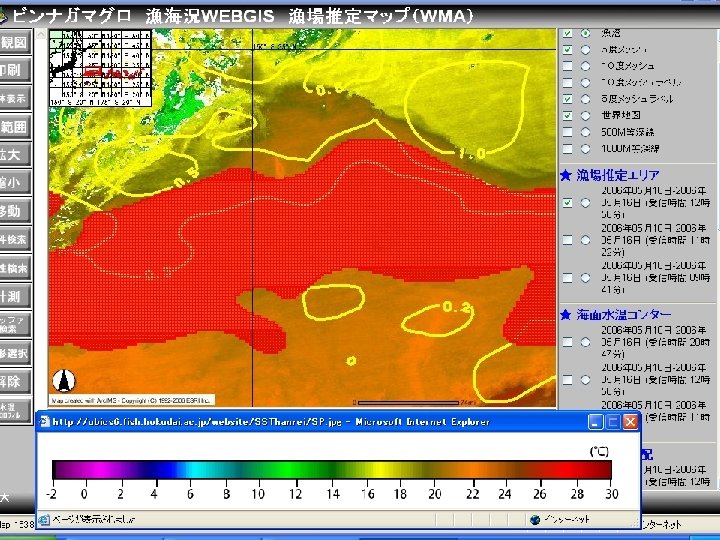
 Web TOREDAS
 Onboard TOREDAS
 SUPERBIRD(6 Mbps) J-SAT(3") Overview of Information Transfer Communication satellite MODIS Database Analysis WIDESTAR(64 Kbps) SUPERBIRD(6 Mbps) J-SAT(3 Mbps) Internet GPS Display Overlay Measure Web. TOREDAS(Land) Onboard TOREDAS (Offshore)
Overview of Information Transfer Communication satellite MODIS Database Analysis WIDESTAR(64 Kbps) SUPERBIRD(6 Mbps) J-SAT(3 Mbps) Internet GPS Display Overlay Measure Web. TOREDAS(Land) Onboard TOREDAS (Offshore)
 Antenna for Satellite Communication -Diameter: 60 cm -Ku band
 Notebook PC Receiver
 Sahara
 Panasonic - Tough Book
 Panasonic - Tough Book For Fishermen -Hard Duty -Touch Panel -Protect water
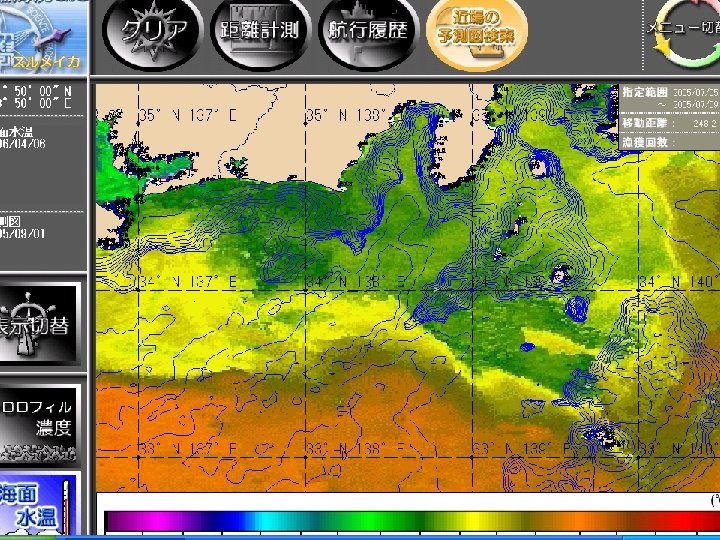
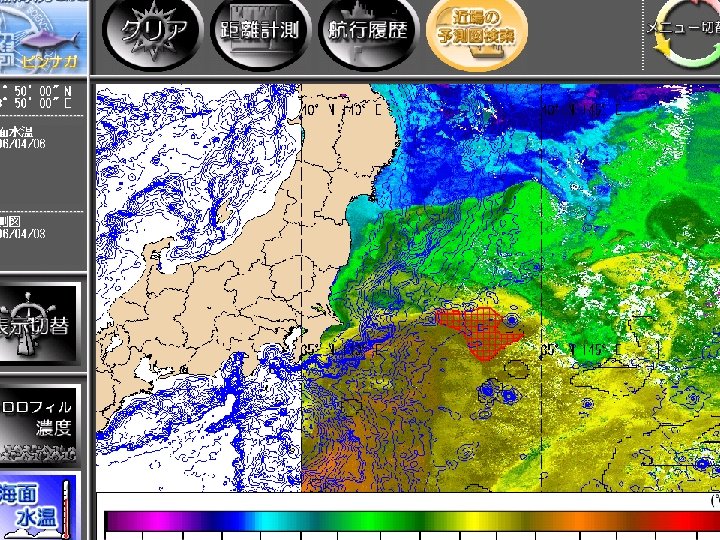
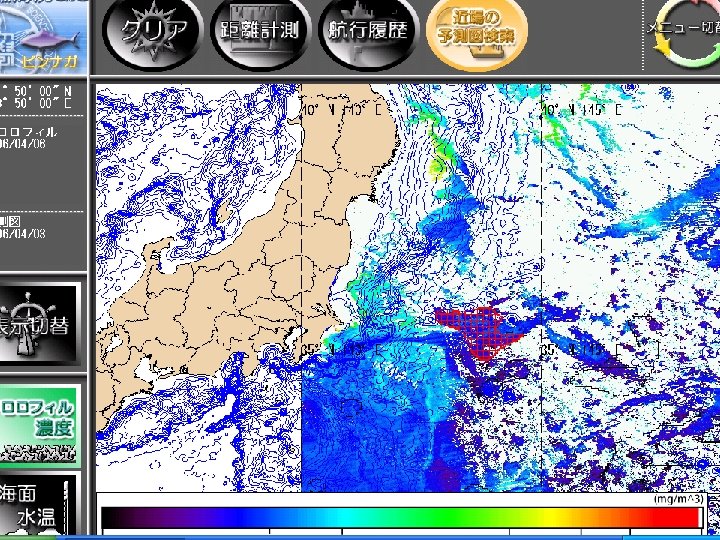
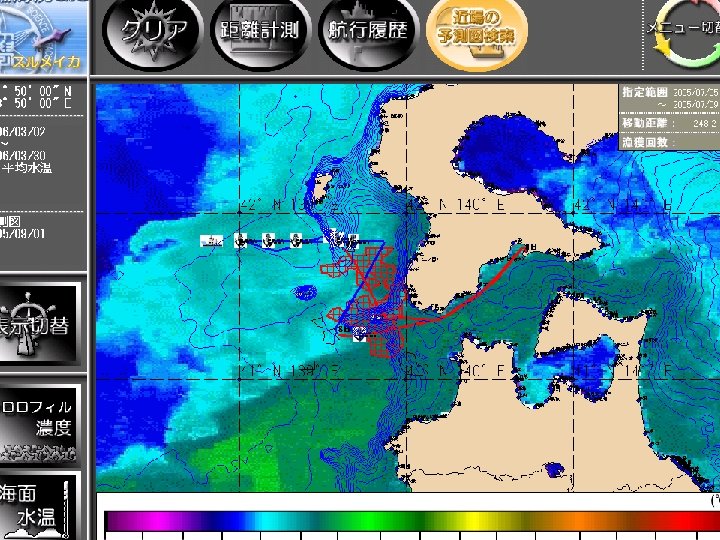
 A: clear, B: distance measurements, C: trip history, D: search the nearest predicted fis ground, E: change menu.
 A B C D E A: clear B: distance measurements C: trip history D: search the nearest predicted fishing ground E: change menu.
 Web TOREDAS
 Research and Development -Raw data -Statistics -etc Operational") Operational Fisheries Oceanography -Models -Technology (Observing/sampling) Research and Development -Raw data -Statistics -etc Operational Fisheries Oceanography -Measurements: systematic, long-term, routine -Interpretation of data: fast(near real-time) -Dissemination of results: rapid, e. g. internet -Funding -Data -Application USERS Governments, Regulatory Authorities, Commercial Enterprises, Research Institutes -Products
Operational Fisheries Oceanography -Models -Technology (Observing/sampling) Research and Development -Raw data -Statistics -etc Operational Fisheries Oceanography -Measurements: systematic, long-term, routine -Interpretation of data: fast(near real-time) -Dissemination of results: rapid, e. g. internet -Funding -Data -Application USERS Governments, Regulatory Authorities, Commercial Enterprises, Research Institutes -Products
/GIS assisted fisheries") Concluding Remarks For sustainable use and fisheries management…… • Support ubiquitous RS(MODIS)/GIS assisted fisheries operation • Contribute to save energy and fuel for optimum fishing activities • Improve understanding fishing ground formation and fish migration • Promote to develop “Operational” Fisheries Oceanography This project is supported by Ministry of Economy, Trade and Industry (METI)
Concluding Remarks For sustainable use and fisheries management…… • Support ubiquitous RS(MODIS)/GIS assisted fisheries operation • Contribute to save energy and fuel for optimum fishing activities • Improve understanding fishing ground formation and fish migration • Promote to develop “Operational” Fisheries Oceanography This project is supported by Ministry of Economy, Trade and Industry (METI)
 Future Satellite MODIS Database Fishing fleet TOREDAS never sleep 24 hours/365 days
 : Operation Management and Resource Management •") Future System • VMS (Vessel Management System) : Operation Management and Resource Management • Safety Operation: Weather and Wave Information • Economic Usage: Fish Market Information • Traceable: Food safety
Future System • VMS (Vessel Management System) : Operation Management and Resource Management • Safety Operation: Weather and Wave Information • Economic Usage: Fish Market Information • Traceable: Food safety