17258085030ff174cbe551d7064bfcac.ppt
- Количество слайдов: 22


2010 Round of Censuses of Agriculture Roundtable meeting Samoa, March 2009 Jean Watt Statistics New Zealand

Map

New Zealand’s primary sector • Primary industries directly contribute 7. 1 % to GDP in 2008 • Primary products make up about two-thirds total exports • Main export commodities • • • Milk powder, butter and cheese Meat and edible offal Logs, wood and wood articles Mechanical machinery and equipment Fish, crustaceans and molluscs Fruit

Agricultural production • Livestock – – 38. 5 million sheep 5. 3 million dairy cattle 4. 4 million beef cattle 1. 4 million farmed deer – 370, 000 pigs – Source: 2007 Agricultural Production Census

Agricultural production • Grain crops • Wheat, barley, maize, oats …… • Fruit • Apples, peaches, avocados, kiwifruit, grapes…. • Vegetables • Potatoes, onions, squash, peas, leafy greens… • Exotic forestry • Flowers and nursery crops

Agriculture in New Zealand • Important sector of the economy • Carried out on a commercial basis by farming and forestry businesses • Highly mechanised – 7% of the labour force directly employed in agriculture, horticulture and forestry
 • Wide range of statistics produced • Produced by many")
Official Statistics System (OSS) • Wide range of statistics produced • Produced by many government agencies • Statistics New Zealand • Producer of statistics • Lead role in improving and co-ordinating the OSS

Agricultural Production Statistics • Long history of agricultural statistics • Agricultural census/survey most years • Current program – Began with 2002 Census – Joint collection with Ministry of Agriculture and Forestry (MAF)
")
The Agricultural Programme Current agricultural statistics programme: • 2002 Census • Yearly (2003 -2006) sample surveys • 2007 Census • Yearly (2008 -2011) sample surveys • 2012 Census

2007 Agricultural Production Census • Content • • • Farm details Land area and land use Livestock Grain crops Horticulture (fruit, vegetables, flowers and nursery crops) Farm practices (including fertiliser applied, irrigation and cultivation)
 • Data")
2007 Agricultural Production Census • Questionnaire posted to each farm (July 2007) • Data capture - scanning • Data validation, checks and analysis • Provisional release – February 2008 • Final release – May 2008

Population frame • Quality frame – quality statistics • Key attributes – • • Coverage Content Maintenance Updating • Other uses • Production of output statistics • Design of future surveys and statistics

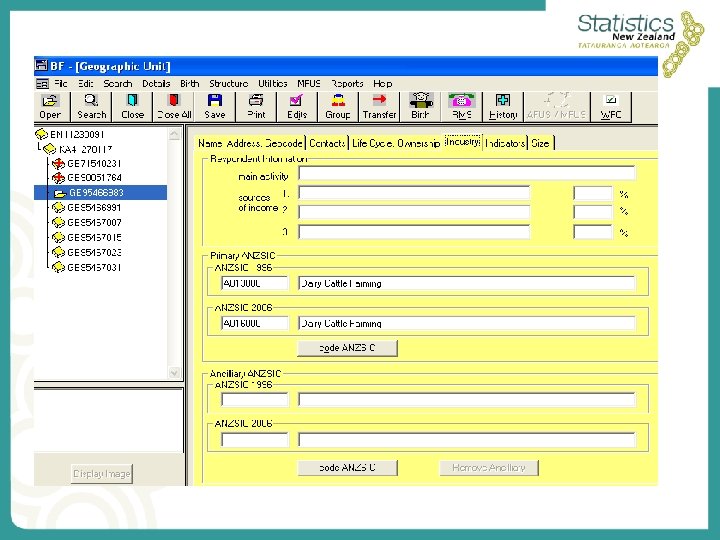
Population frame • Business Frame • • Tax based frame GST registrations No bottom cut-off point for agriculture Compulsory registration at $40, 000 » Partial and unquantifiable coverage of small/hobby farms • Content includes – legal and trading names, address, location, industry, ownership details, business type, size, lifecycle information • Standard classifications eg ANZSIC

Population - continued • BF updated via: – Tax system – monthly updates – Feedback from Statistics NZ surveys, including agricultural census and surveys – Other sources eg media reports

Population - continued – Agricultural census and survey feedback – – – Name (legal, trading) and address (postal, location) Industry (ANZSIC) Frame cleansing (ceases, transfers etc) Identification of sharemilkers and leases Ownership structures – Automated and manual updating – Balancing complexity, resources and priorities – An up-to-date frame is needed for the design of future sample surveys

Data integration and linking • Linking of information at unit record level across datasets • Benefits include: • • New types of data Better use of existing data No direct surveying of respondents New types of research leading to improved understanding and knowledge

Data integration and linking • Statistics Act • Data use and confidentiality • Business and economic data • Linking at the business (firm) level • Business Frame – Provides the key – Used for all business and economic surveys – Longitudinal dimension – enabling changes over time to be studied

Data integration and linking • Some examples: • 2007 Agricultural Census - forestry data – NEFD survey data for 40 large forestry units – Linked Employer Employee Data (LEED) – Wages and jobs data linked to Business Frame – Longitudinal Business Database (LBD) – Prototype database – Business related data from a range of survey and administrative sources

Agricultural statistics opportunities • Linking to financial information • Businesses file a tax return each year • Key financial items (sales, purchases, profit, loss etc) • Already used to produce financial statistics • Challenges: – Complex ownership structures (linking agricultural production activity to the associated tax unit) – Financial information may include non-farm activity

Agricultural statistics opportunities • Linking to Energy Survey • Primary sector currently being surveyed • Type and quantity of energy used (petrol, electricity etc) • Population sourced from Business Frame • Better understanding of fuel use in the agricultural sector

Agricultural statistics opportunities • Linking to a land based frame – Potential to integrate agricultural production and economic statistics to land based data – Low match rate from earlier studies – Potential new database developments
17258085030ff174cbe551d7064bfcac.ppt