eb391e659fc44d5c86e78b7ea1ba9ab8.ppt
- Количество слайдов: 97
 13. 0 Aggregate Demand
 13. 1. 1 One thing that moves AD is a change in the level of consumption ( C ) What determines C?
 C is based upon perception of long-term financial prospects Make a certain amount of income, for a certain time, you tend to spend at that level Bumps along the way, smoothed out on average
 In the aggregate, C is a function of people’s perception of permanent income – long-term expected income status
 13. 1. 2 Amount of current income in economy is determined by the amount of production in the economy Funds paid for production are people’s income Current nominal income – price level times real GDP P*Y
 People spend a portion of their income for consumption We will call that fraction b b is always between zero and one So, b(PY) is the share of current aggregate income that is spent on consumption
 For some people, spending out of current income is the whole story For others, spending on consumption comes from savings Ex. retirees Consumption out of accumulated wealth is called Autonomous consumption – A
 + A We can now see the") The Consumption Function C = b (PY) + A We can now see the source of one of the forces that moves the macroeconomy
The Consumption Function C = b (PY) + A We can now see the source of one of the forces that moves the macroeconomy
 Consumer Confidence If prospects brighten, perceived permanent income goes up Higher consumption results As C increases, AE increases, and AD shifts out, increasing real GDP Since part of C is itself a function of real GDP, these positive expectations become somewhat self-fulfilling
 13. 1. 3 Historical Example Near the end of WWII, people were fearful of slipping back into the Depression Where would the demand for products come from once the war was over? Much of it came from A Rationing during the war had made consumption difficult – sort of a forced savings Pent-up demand helped ease transition back to peace
 Consumer confidence and Autonomous consumption are important forces that can move the economy, but they cannot sustain growth by themselves A major engine for growth is the next variable, Investment (I)
 13. 2. 1 Level of real investment – in plants, equipment, etc. is determined in the long term capital market This is where people get the money to make investments It coordinates the desires of those who have funds and those who need funds
 Financial capital or liquidityfunds that pass through the capital market Unlike real production capital (machines used to produce products), financial capital can take any shape Funds flow from lenders to borrowers, who then turn that financial capital into the investments they imagine (Blueprints, and backhoes, and buildings…)
 Financial intermediaries like banks or mutual funds act as the gobetween for savers and borrowers They help coordinate people’s wishes
 Investments like a factory usually take a significant amount of time to be paid off 20 or 30 years This is why we call this a long-term capital market

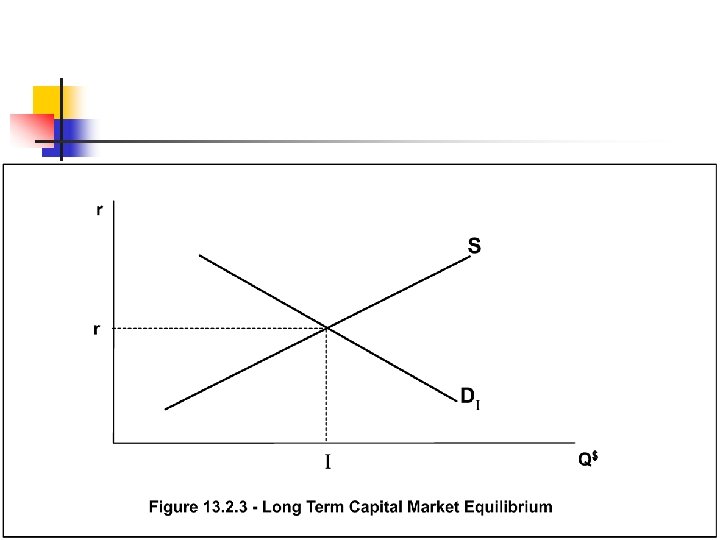
 Vertical axis –") In this graph Horizontal axis – quantity of financial capital (Q$) Vertical axis – nominal interest rate ( r ) Supply and demand lines represent the attitudes of suppliers and demanders What determines those attitudes?
In this graph Horizontal axis – quantity of financial capital (Q$) Vertical axis – nominal interest rate ( r ) Supply and demand lines represent the attitudes of suppliers and demanders What determines those attitudes?
 13. 2. 3
 Supply of capital line The higher the interest rate, the greater the quantity of capital supplied Supply comes from accumulated wealth of savers
 represents attitudes of those who wish to borrow") 13. 2. 4 Demand line (DI) represents attitudes of those who wish to borrow funds to make these real investments Entrepreneurs have to borrow liquidity now to make investments that will have a return in the future The higher the interest rate, the less attractive the borrowing It is an inverse relationship
13. 2. 4 Demand line (DI) represents attitudes of those who wish to borrow funds to make these real investments Entrepreneurs have to borrow liquidity now to make investments that will have a return in the future The higher the interest rate, the less attractive the borrowing It is an inverse relationship
 13. 2. 5 Combining these two lines, we reach an equilibrium This is how I is determined
 If attitudes change in the capital market, then not only do those lines shift, but the resulting change in I will move AD in the big macro picture
 Suppose supply of capital shifts down Suppliers charge less for their capital Interest rates fall Investment (I) increases AD moves Right
 Graphically,
 Suppose borrowers wanted to borrow less capital Demand for capital falls Interest rates fall Investment falls AD moves Left
 Graphically,
 We started with shifts In capital supply or in capital demand Now, we will look at sources of those shifts
 13. 2. 6 Clarifying shift terms With supply, most of the time we will use up and down Think about whether suppliers will charge more or less for their capital

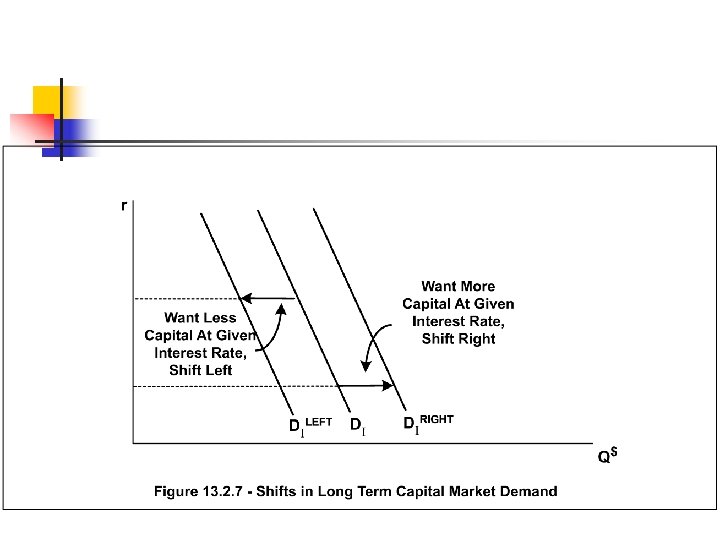
 With the demand side, we will use left and right Think about is there is more or less capital demanded at that given interest rate
 13. 2. 7 One of the main determinants of the level of interest people charge for their capital is their perception of the risk of not being paid back Individual like me or you –most risky General Motors – less risky U. S. government - least risky of all

 More risk means you pay a higher rate U. S. Gov’t pays the U. S. Treasury bond rate A firm like GM pays the prime rate Individuals usually pay higher rates, depending on past actions Depending on risk, even different governments might pay more for the same loan
 13. 2. 8 -13. 2. 9 One thing that determines the level of long term capital supply is Short term level of supply People are more comfortable making short term loans than longer ones They want control back sooner Short term loans (less than a year) get supplied at lower interest rates than long ones
 Several “premiums”, or added costs, Are part of the long term line They are above and beyond the short term line Waiting premium – extra cost for having to wait to get the money back Inflationary expectation premium – the longer the loan, the more likely the real return will be eaten up by inflation Ex. 5% return on loan, but inflation is 5%, you made 0% real return Longer loans are more susceptible to this

 13. 2. 10
 3 factors Determine long term capital supply line Short term supply line Inflationary expectations Waiting premium These become the shift variables for S
 13. 2. 11 One more shift variable. Entry into or exit out of a country’s capital market More funds in- increases quantity supplied – S shifts right More funds out – decreases quantity supplied – S shifts left

 Sources of entry Accumulated wealth within country – more wealth, more potential funds for the capital market n International capital flows – flows into a country occur when conditions are improving (more political stability, more opportunity) n
 An example Capital flow into the country Shifts S right Lower interest rates More I If the holders of the international capital make the actual investment themselves, It is called foreign direct investment
 Graphically,
 If funds flow into one country, They must be flowing out of another Flows out occur because of Political instability, or more attractive opportunities elsewhere
 Contraction of S means Higher interest rates Less I AD left More unemployment Less real GDP Just the opposite of previous graph
 13. 2. 12 Demand for long term capital is greatly influenced by Expectations More positive expectations shift the demand for capital (DI) Right
 A rightward shift in DI means Higher interest rates More I AD right More real GDP Less unemployment
 Graphically,
 Conversely, More negative expectations do just the opposite Lower interest rates Less I AD left Less real GDP More unemployment
 In the real world, Many war-torn countries find themselves in similar situations Others do not want to invest in their country because of the risk that investment might be destroyed Peace can bring both stability and more positive expectations Capital supply and demand both would shift right More I, more real GDP, less unemployment
 Another example Great Depression Deeply depressed expectations of future DI shifted way left I fell AD went way left Less real GDP More unemployment Deflation
 13. 3 The Trade Balance
 13. 3. 1 We’ve seen how changes in I can move AD Now, we’ll see how the trade balance (X-M) can also have an effect on the overall macro economy
 International trade exists because specialization can lead to surpluses and gains from trade can be realized (Remember Wayne and Garth? ) As long as channels of exchange are open, markets will form to coordinate the exchange of these surpluses
 How much trade? It depends upon the underlying conditions in the markets for those items being traded
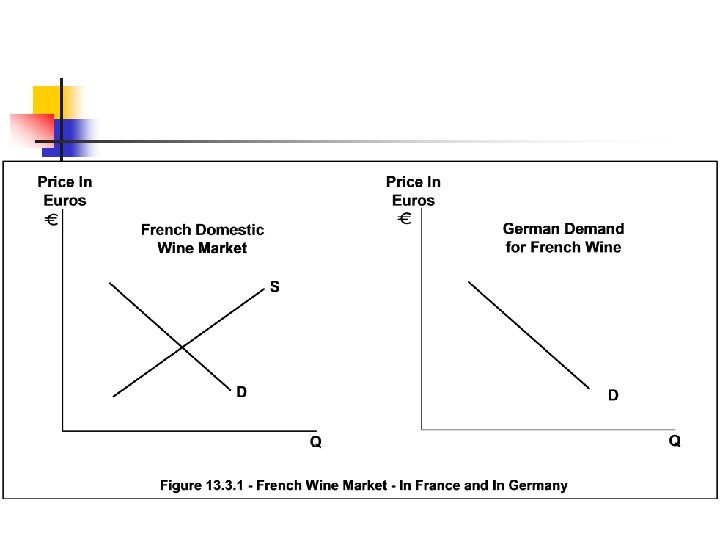
 Assume two countries France and Germany Determinants of trade in French wine: n Attitude of French wine producers, as represented by the French wine supply line n Attitude of French demanders of French wine, as represented by the domestic demand line n Attitude of the German demanders of French wine
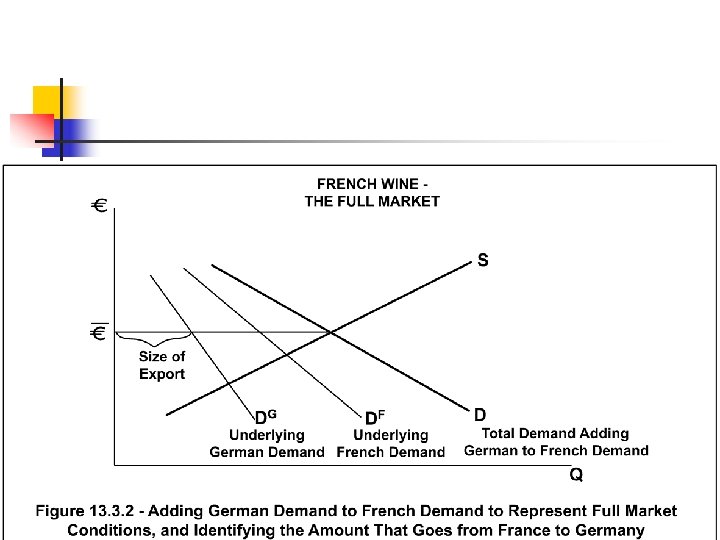
 Adding German demand to the French demand yields the full demand conditions At this full equilibrium price, follow over to the German demand line to identify the size of the French export / German import
 13. 3. 2 International trade is often complicated by the fact that different countries use different currencies
 Each nation uses a different kind of fiat money In order to buy European goods, we must first buy euros (€) In order for European people to buy American goods, they must first buy dollars ($)
 What this means is that somewhere along the line, dollars have been exchanged for euros While you personally may not have done it, the guys who made the good in Europe got paid in their own currency. We say that these exchanges of currencies occur in a foreign exchange market.
 You may have experienced part of a foreign exchange market if you have traveled to another country and had to exchange currencies
 There is a foreign exchange market for any two currencies For now, we will assume a two-currency world with only dollars and euros being exchanged
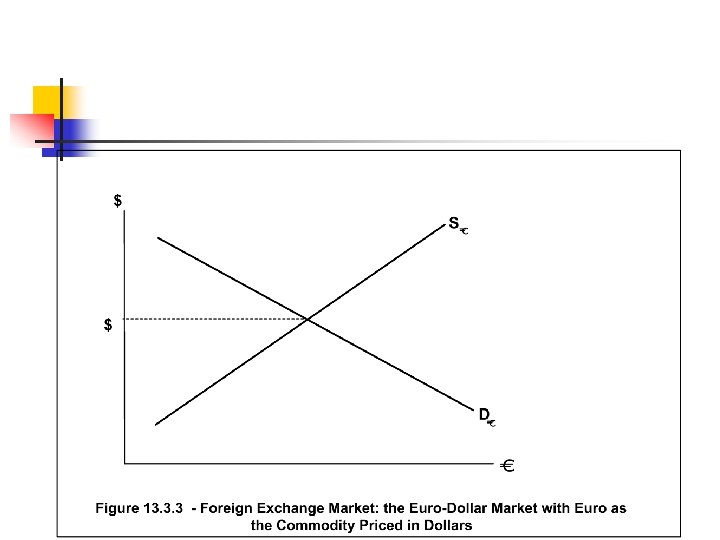
 13. 3. 3 2 perspectives on the foreign exchange market The first has euros as the commodity being purchased The price of the euros is measured in dollars There is an exchange rate for euros that is measured in dollars Ex. $1. 20 = 1 euro
 13. 3. 4 Another perspective on the foreign exchange market has The dollar as the commodity The price of a dollar is measured in euros Ex. . 833 € = 1 dollar
 Graphically, both perspectives
 13. 3. 5 Here’s the key. The demand for euros is the source of the supply of dollars Every dollar we wish to exchange for a euro is a dollar we are willing to supply to the Europeans There are only two goods exchanged, so if D€ increases, the S$ increases
 Connecting Perspectives on the Foreign Exchange Market
 Or, in reverse, if S€ increases, the D$ increases
 These are just two perspectives on the same market The exchange rates show the exact same information If it takes X dollars to buy 1 euro Then it takes 1/x euros to buy 1 dollar http: //finance. yahoo. com/m 3? u

 13. 3. 6 Exchange rates are just the prices in the foreign exchange markets Changes in the supply and demand for the currencies will change the exchange rates
 Suppose the demand for euros increases The dollar price of a euro goes up If demand for euros is increasing, it means that the supply of dollars is also increasing The euro price of a dollar goes down

 When one currency can buy more of another, economists say that currency is getting stronger Before, 1 euro = 2 dollars Now, 1 euro = 4 dollars The euro is stronger and the dollar is weaker
 13. 3. 7 These changes in exchange rates will affect many people’s decisions Before, when a European tourist in NY wants to buy something that costs $400, It cost 200 euro Now, with the stronger euro, it only costs 100 euro
 However, if you are in Europe, An apartment that was 400 euro a month Used to cost you $800, but with the weaker dollar now costs $1, 600 Stronger or weaker currencies aren’t necessarily bad or good, but they will affect who buys what
 13. 3. 8 If the only reason people ever bought currencies was for exports and imports, and exchange rates were allowed to float, the trade balance would be in balance X=M, or X-M=0 Many times, the trade balance is not in balance How can that happen?
 13. 3. 9 There are other reasons currencies get exchanged besides exports and imports International capital flows also mean currency gets exchanged
 For example, Suppose demand for financial capital increases in the U. S. Interest rates rise, ceteris paribus Rising interest rates attract a greater quantity supplied Suppose some of the new quantity supplied comes from Europe
 When European capital comes into the U. S. , Euros will be exchanged for dollars Increased demand for dollars Increased supply of euros These foreign exchange market shifts make the dollar stronger

 A stronger dollar means More U. S. imports Less U. S. exports Trade balance becomes more negative AD moves left
 13. 3. 10 Suppose confidence in the U. S. economy declines sharply Less demand for financial capital means lower interest rates Capital flows out If it flows to Europe, then increased demand for euros means a weaker U. S. dollar More U. S. exports, less U. S. imports
 13. 3. 11 Countervailing forces When would a capital flow stop? Capital flows out make the euro more expensive, and the supply of capital in Europe expands, which lowers the European interest rate As the capital flow continues, the cost of going (exchange rate) keeps increasing, and the advantage of going (the higher interest rate) keeps falling Eventually, you reach a new equilibrium
 13. 3. 12 The model assumes there is time for information to flow and be thoughtfully processed People can now move international capital in seconds Bad news can cause a wave of independent actions, but collectively they can cause a global financial panic
 For example, 1997 -financial instability in Thailand Concern about stability in other countries “Asian contagion” Fear becomes self-fulfilling Capital flees to safe havens like the U. S. or Europe Capital flows out mean a big fall in the value of their currencies Plus, investment nearly vanished as confidence also disappered
 Asian economies go into deep recessions Weak currencies mean not being able to buy U. S. exports U. S. bought lots of foreign imports with our stronger dollar Highest trade deficit in U. S. history by 1998 Even though these countries were exporting huge amounts, and exports can help an economy, they are not a sufficient foundation for a healthy economy
 Trade in an item depends") 13. 3. 13 Summary of the Trade balance (X-M) Trade in an item depends upon: Underlying market conditions in the producing country Exchange rate Demand conditions in the other country Plus, International capital flows that can change exchange rates by making the dollar stronger or weaker
13. 3. 13 Summary of the Trade balance (X-M) Trade in an item depends upon: Underlying market conditions in the producing country Exchange rate Demand conditions in the other country Plus, International capital flows that can change exchange rates by making the dollar stronger or weaker
 13. 4. 1 The last two variables that move AD are the ones that make up the government budget position (G-T) (Government spending – Taxes) Determined by the President and Congress – 536 people in all
 13. 4. 2 In reality, the budget position is complicated by many special interest groups who lobby for certain causes This affects G and T
 Occasionally, International events can dramatically change the budget position Ex. Pearl Harbor