1 GEN1030 Introduction to Environmental Studies Aliya Nurtaeva,


8912-gen1030_lecture4_sui_2013.ppt
- Количество слайдов: 38
 1 GEN1030 Introduction to Environmental Studies Aliya Nurtaeva, Ph.D. KIMEP, Office # 507 /Valikhanov [email protected] Lecture 4 Human Populations
 2 Outline Population growth Limits to growth: some opposing views Human demography Population growth: opposing factors Demographic transition Family planning and fertility control The future of human populations
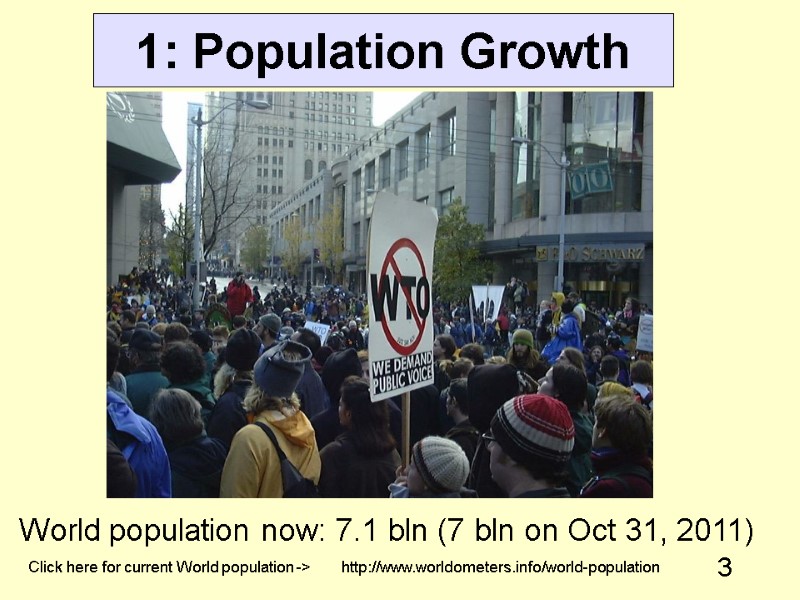
 3 1: Population Growth World population now: 7.1 bln (7 bln on Oct 31, 2011) Click here for current World population -> http://www.worldometers.info/world-population
 4 Population Characteristics (1) Population - a group of individuals of the same species that inhabit the same area. Natality: Number of births over a particular time period. Crude Birth Rate = # of humans born per 1000 individuals per year. Mortality: Number of deaths in a population over a particular time period. Crude Death Rate = # of humans died per 1,000 individuals per year. Note: mortality ≠ morbidity!
 5 Population growth rate = birth rate - death rate (natural growth rate, migration is ignored). (may be in % of the total population). Age distribution - number of individuals of each age in the population. Age distribution greatly influences the population growth rate. Population density is the number of individuals per unit area. High population density --> competition for resources. Kazakhstan – low density: ~6.2 person/sq km on Jan 1, 2013 Population Characteristics (2)
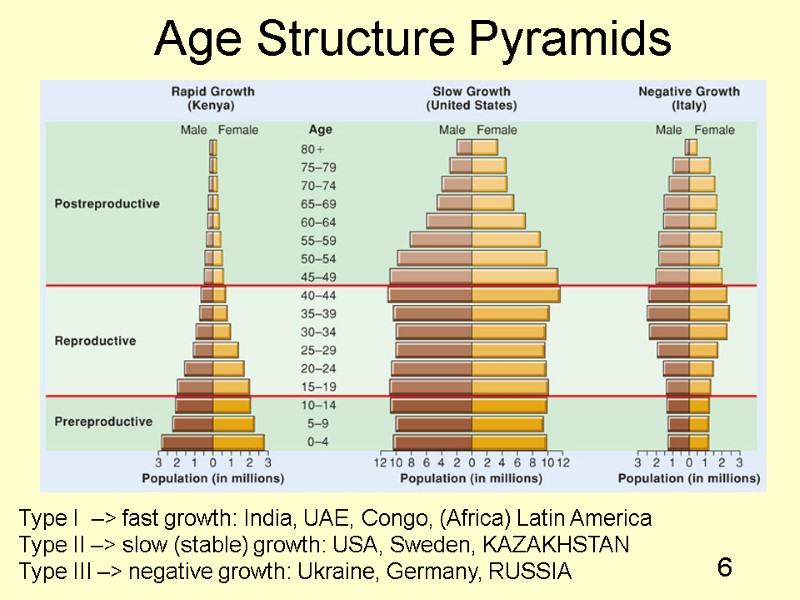
 6 Age Structure Pyramids Type I –> fast growth: India, UAE, Congo, (Africa) Latin America Type II –> slow (stable) growth: USA, Sweden, KAZAKHSTAN Type III –> negative growth: Ukraine, Germany, RUSSIA
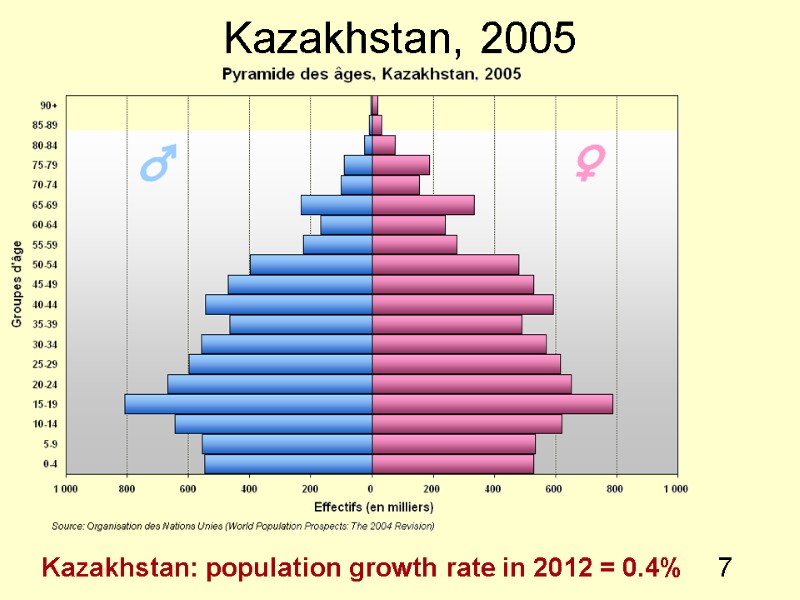
 7 Kazakhstan, 2005 Kazakhstan: population growth rate in 2012 = 0.4%
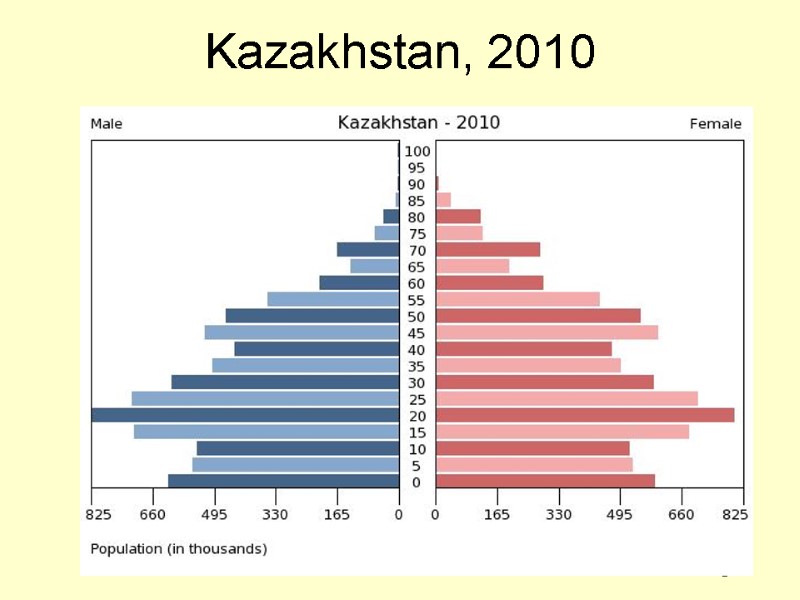
 8 Kazakhstan, 2010
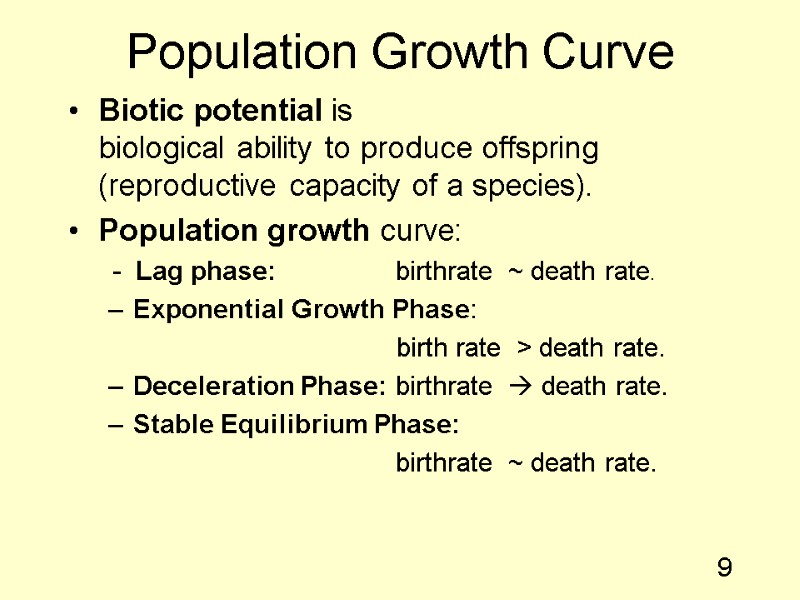
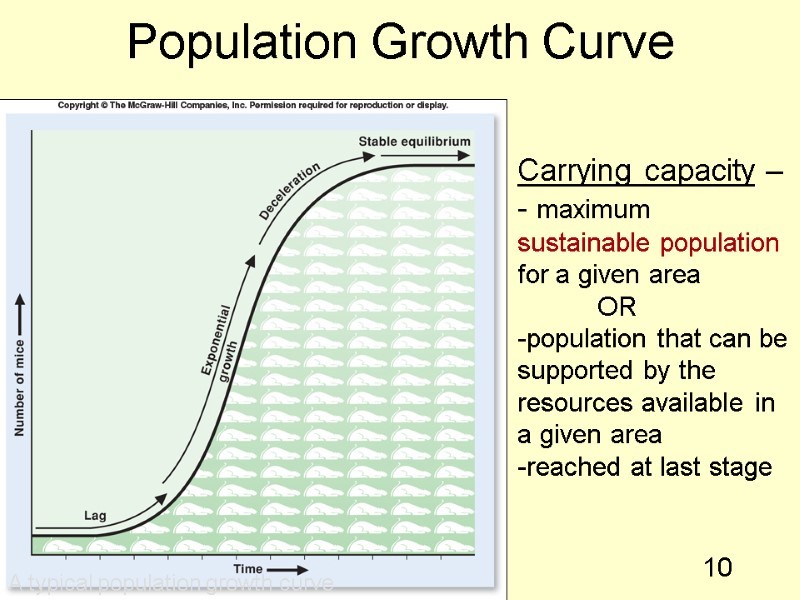
 9 Population Growth Curve Biotic potential is biological ability to produce offspring (reproductive capacity of a species). Population growth curve: - Lag phase: birthrate ~ death rate. Exponential Growth Phase: birth rate > death rate. Deceleration Phase: birthrate death rate. Stable Equilibrium Phase: birthrate ~ death rate.
 10 Population Growth Curve A typical population growth curve Carrying capacity –- maximum sustainable population for a given area OR population that can be supported by the resources available in a given area reached at last stage
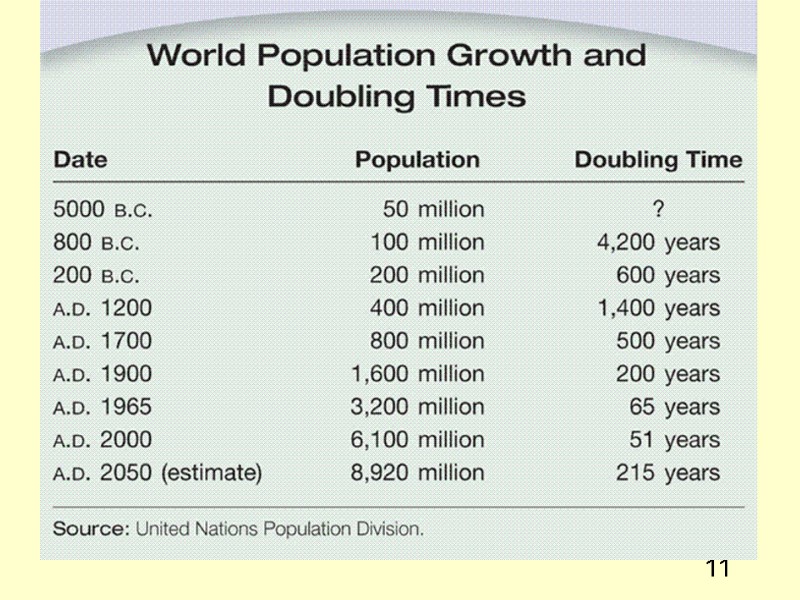
 11 ADD TABLE 4.1
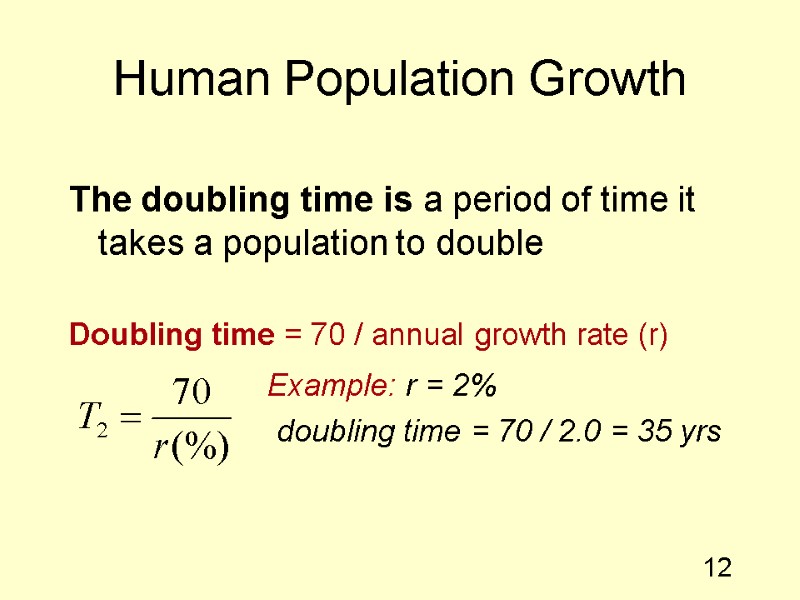
 12 Human Population Growth The doubling time is a period of time it takes a population to double Doubling time = 70 / annual growth rate (r) Example: r = 2% doubling time = 70 / 2.0 = 35 yrs
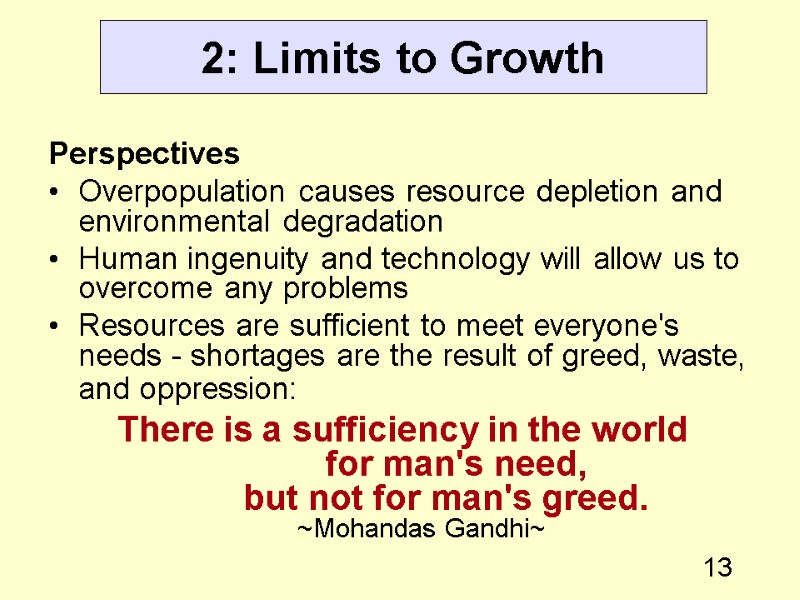
 13 2: Limits to Growth Perspectives Overpopulation causes resource depletion and environmental degradation Human ingenuity and technology will allow us to overcome any problems Resources are sufficient to meet everyone's needs - shortages are the result of greed, waste, and oppression: There is a sufficiency in the world for man's need, but not for man's greed. ~Mohandas Gandhi~
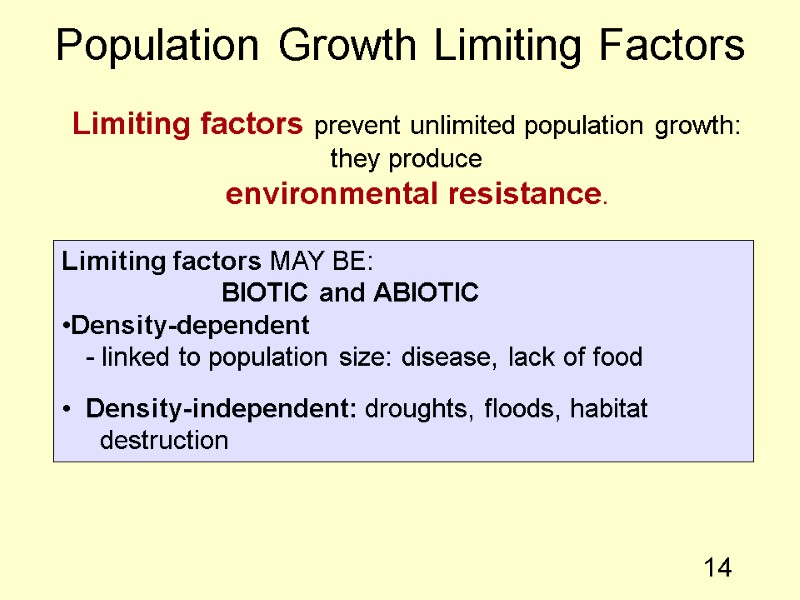
 14 Population Growth Limiting Factors Limiting factors prevent unlimited population growth: they produce environmental resistance. Limiting factors MAY BE: BIOTIC and ABIOTIC Density-dependent - linked to population size: disease, lack of food Density-independent: droughts, floods, habitat destruction
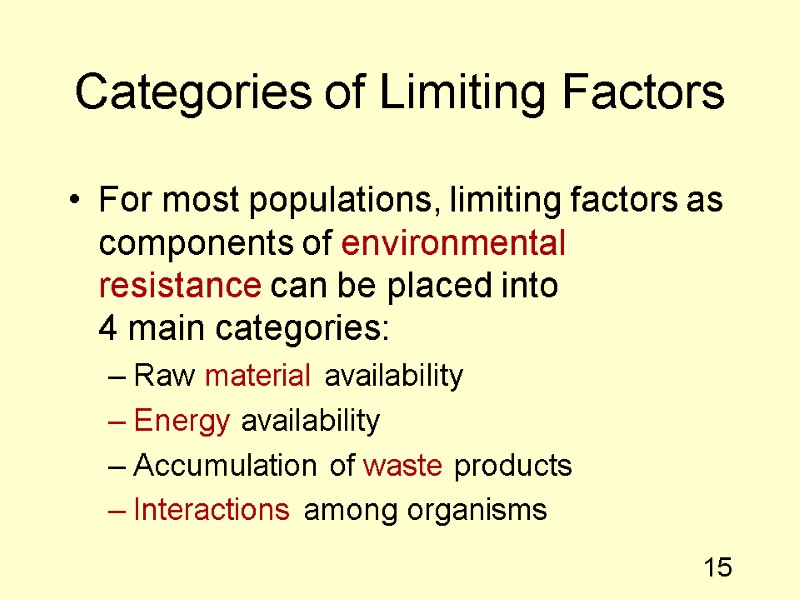
 15 Categories of Limiting Factors For most populations, limiting factors as components of environmental resistance can be placed into 4 main categories: Raw material availability Energy availability Accumulation of waste products Interactions among organisms
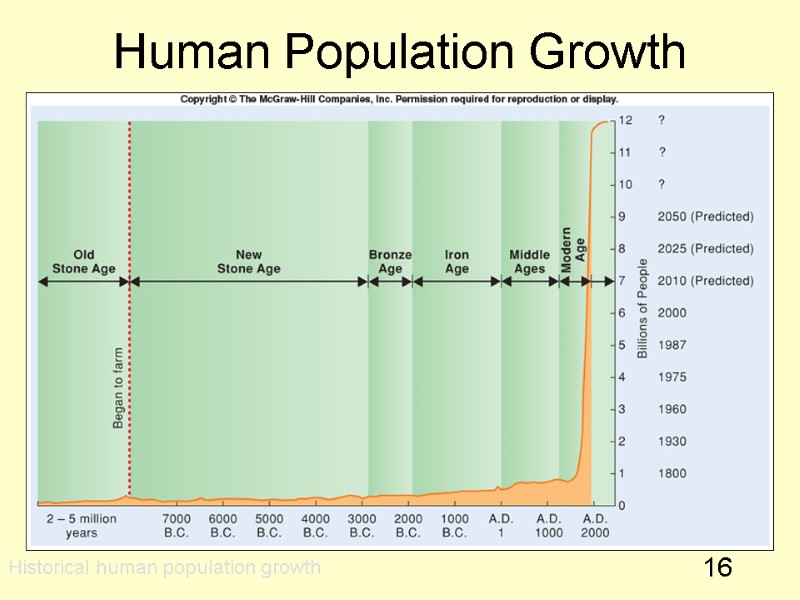
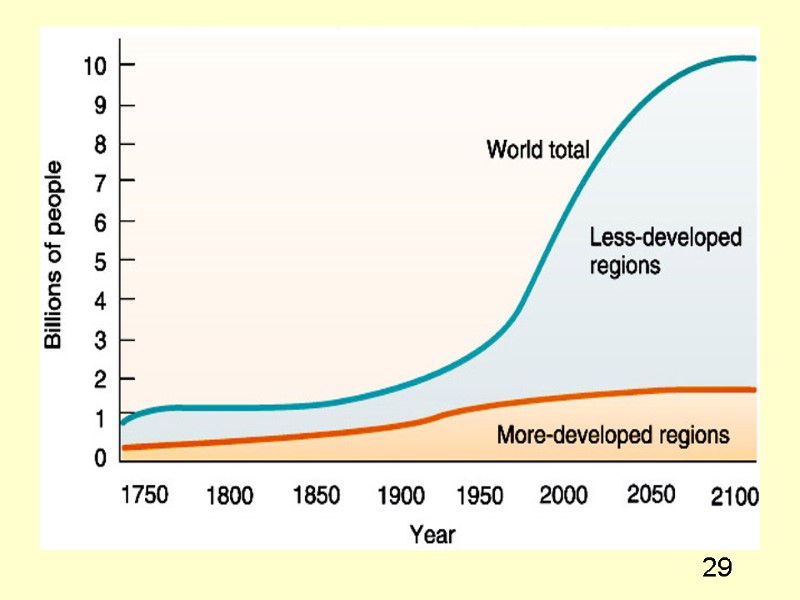
 16 Human Population Growth Historical human population growth
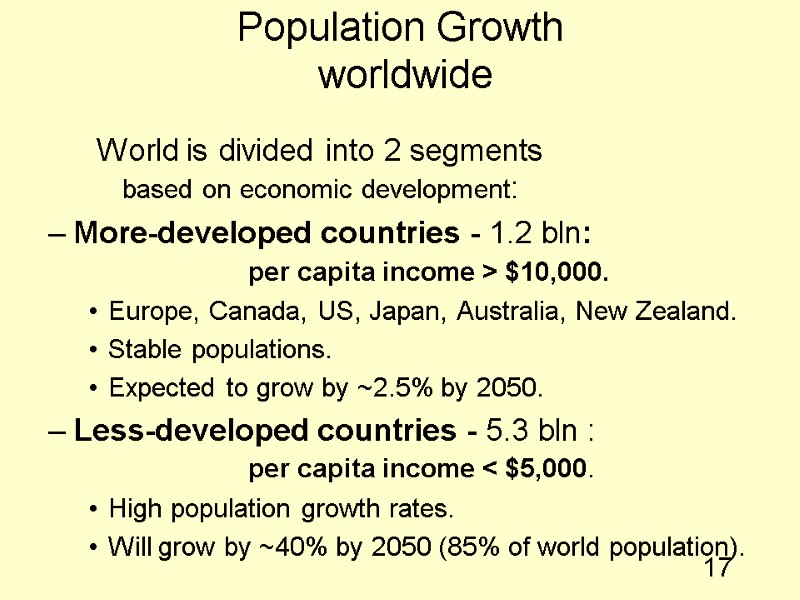
 17 Population Growth worldwide World is divided into 2 segments based on economic development: More-developed countries - 1.2 bln: per capita income > $10,000. Europe, Canada, US, Japan, Australia, New Zealand. Stable populations. Expected to grow by ~2.5% by 2050. Less-developed countries - 5.3 bln : per capita income < $5,000. High population growth rates. Will grow by ~40% by 2050 (85% of world population).
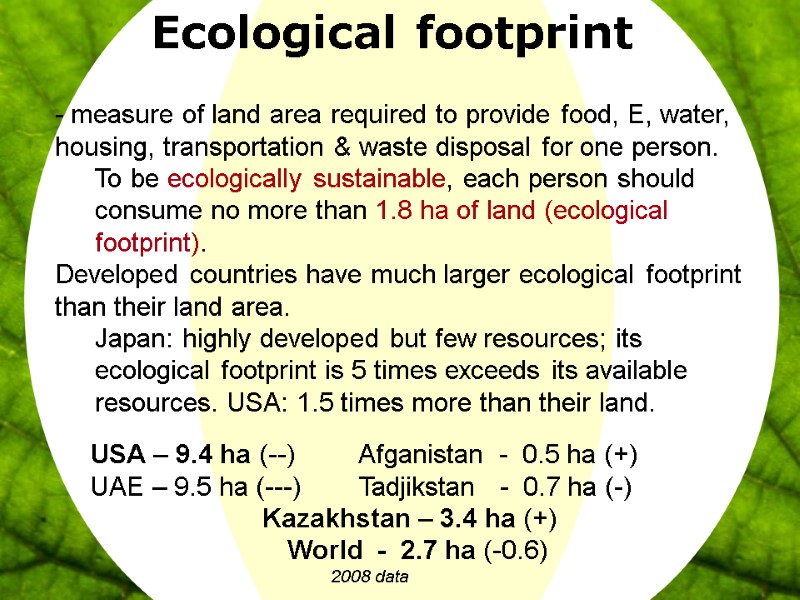
 18 Ecological footprint USA – 9.4 ha (--) Afganistan - 0.5 ha (+) UAE – 9.5 ha (---) Tadjikstan - 0.7 ha (-) Kazakhstan – 3.4 ha (+) World - 2.7 ha (-0.6) 2008 data - measure of land area required to provide food, E, water, housing, transportation & waste disposal for one person. To be ecologically sustainable, each person should consume no more than 1.8 ha of land (ecological footprint). Developed countries have much larger ecological footprint than their land area. Japan: highly developed but few resources; its ecological footprint is 5 times exceeds its available resources. USA: 1.5 times more than their land.
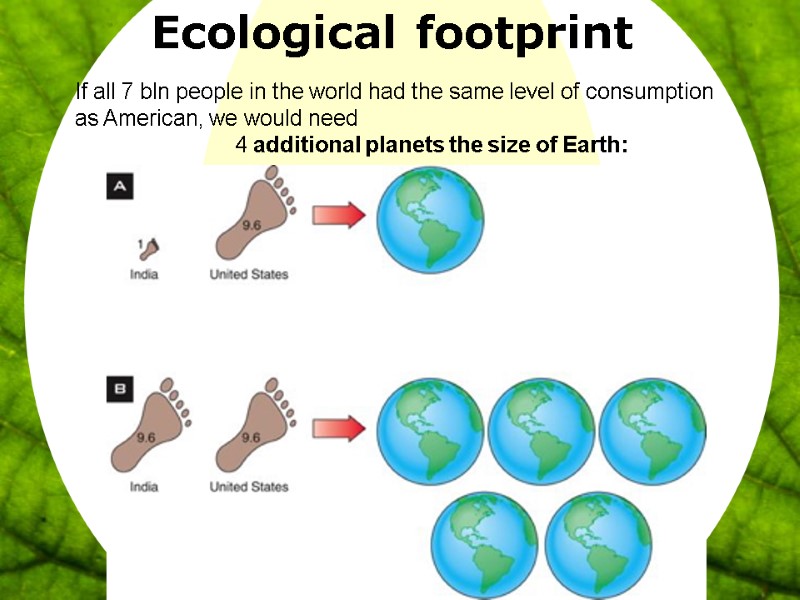
 19 Ecological footprint If all 7 bln people in the world had the same level of consumption as American, we would need 4 additional planets the size of Earth:
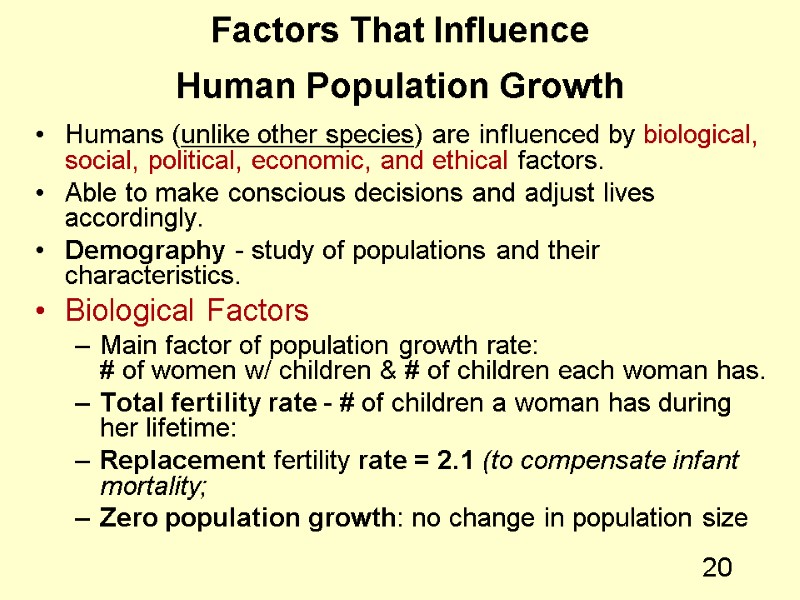
 20 Factors That Influence Human Population Growth Humans (unlike other species) are influenced by biological, social, political, economic, and ethical factors. Able to make conscious decisions and adjust lives accordingly. Demography - study of populations and their characteristics. Biological Factors Main factor of population growth rate: # of women w/ children & # of children each woman has. Total fertility rate - # of children a woman has during her lifetime: Replacement fertility rate = 2.1 (to compensate infant mortality; Zero population growth: no change in population size
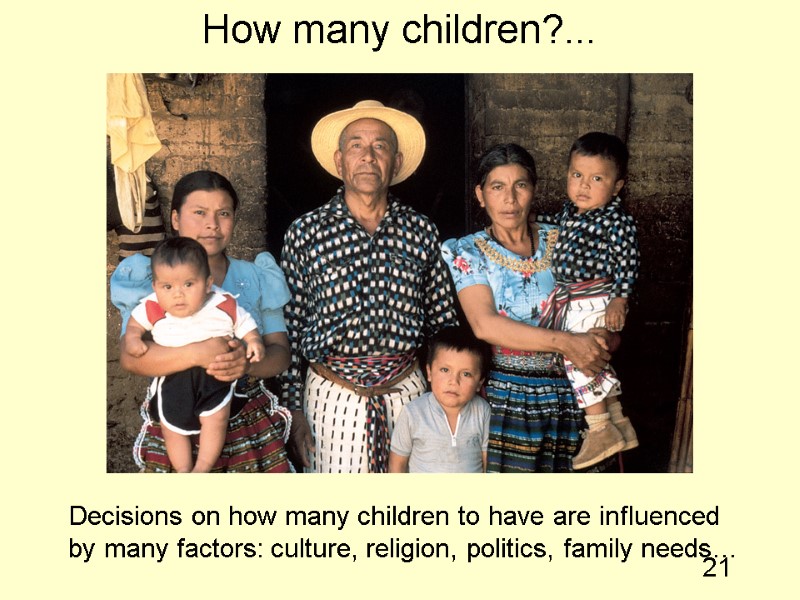
 21 Decisions on how many children to have are influenced by many factors: culture, religion, politics, family needs… How many children?...
 22 Factors That Influence Human Population Growth Social Factors Reduced fertility rates desirable, (especially in LDCs) Religious & cultural factors influence # of children in a family: - male-dominated countries - early marriages Women education (general and medical) If level of education increases, fertility rates fall. Why?
 23 Economic Factors: In less developed countries, the economic benefits of children are extremely important. In the developed world, large numbers of children are an economic drain. Political Factors Governments can reward or punish high fertility rates: paid maternity, child tax deduction, childcare facilities Low birth rates in Europe policies to encourage having more children: Fast population growth in developing countries China, India Family planning strategies
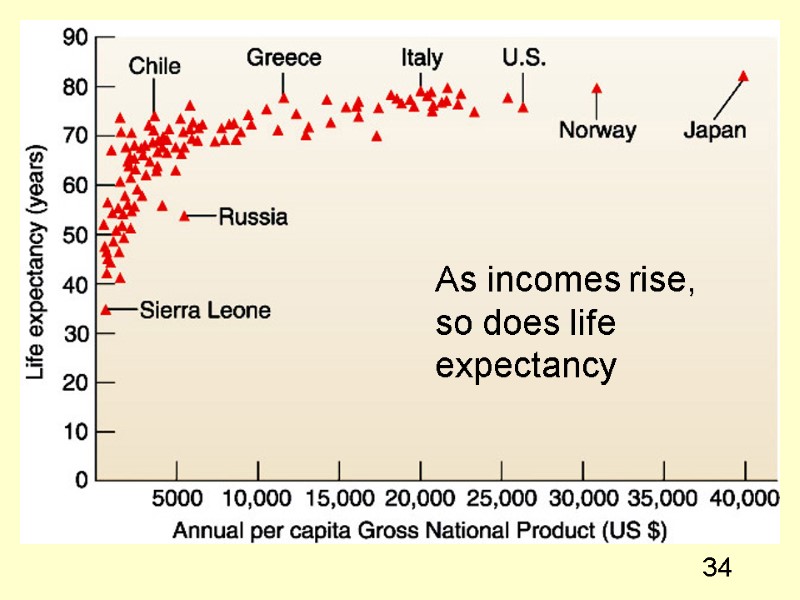
 24 Population Growth Rates and Standard of Living Economic measure of standard of living is average purchasing power per person. Gross national income (GNI) is an index of purchasing power measuring total goods and services generated by citizens of a country.
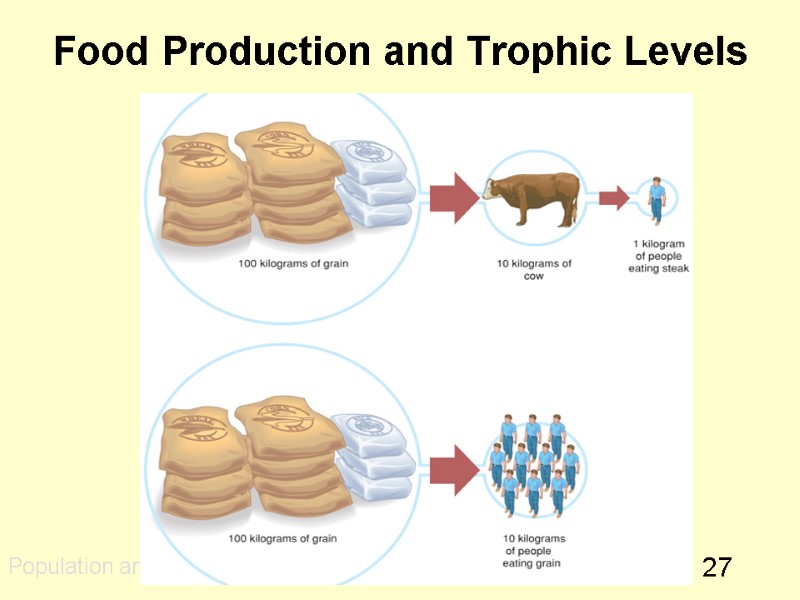
 25 Food Production and Human Population As human population grows, so does the demand for food. Most people in developed countries must purchase their own food. Most people in less-developed countries must grow their own food. Human populations can increase in size only if other plant and animal populations decrease in size.
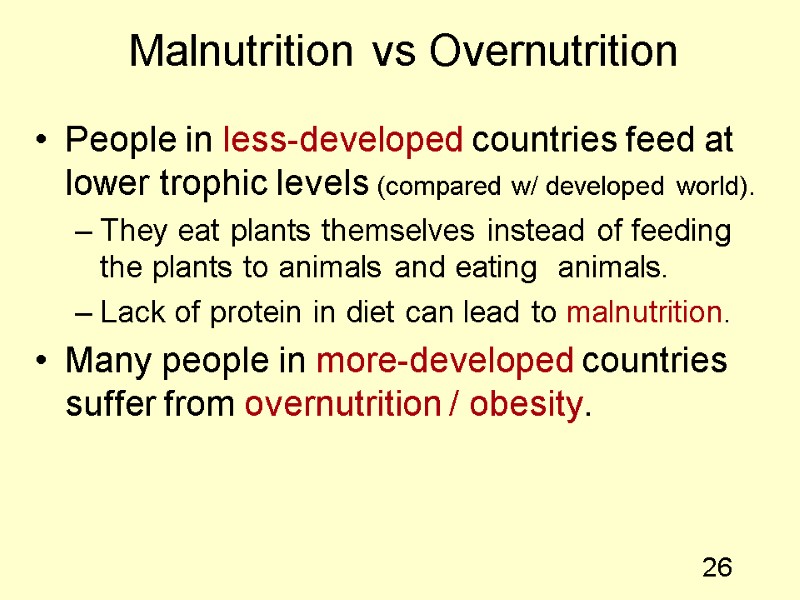
 26 Malnutrition vs Overnutrition People in less-developed countries feed at lower trophic levels (compared w/ developed world). They eat plants themselves instead of feeding the plants to animals and eating animals. Lack of protein in diet can lead to malnutrition. Many people in more-developed countries suffer from overnutrition / obesity.
 27 Food Production and Trophic Levels Population and trophic levels
 28 3: Human Demography Demography – the study of human populations Two demographic worlds Less-developed counties represent 80% of the world population, but more than 90% of projected growth Richer countries tend to have zero or negative growth rates http://www.thirdworldtraveler.com/Third_World/TW_definition_description.html
 29
29
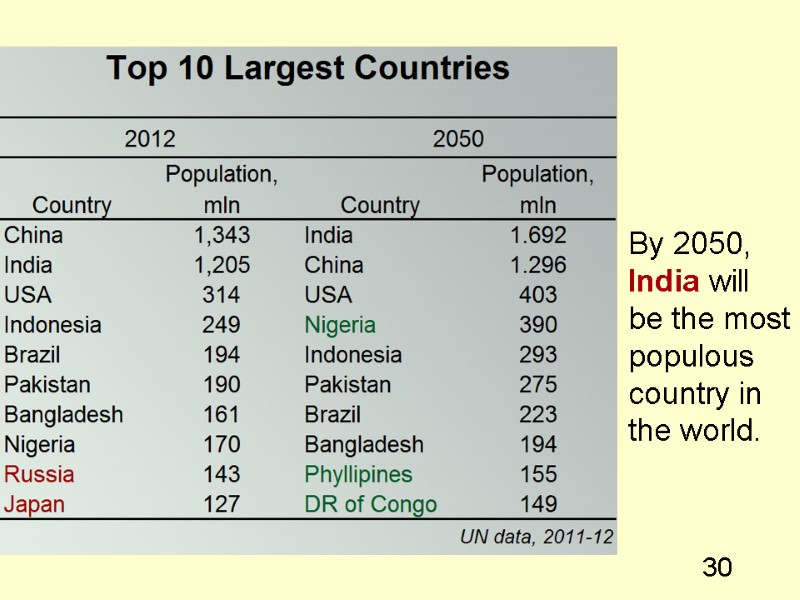
 30 By 2050, India will be the most populous country in the world.
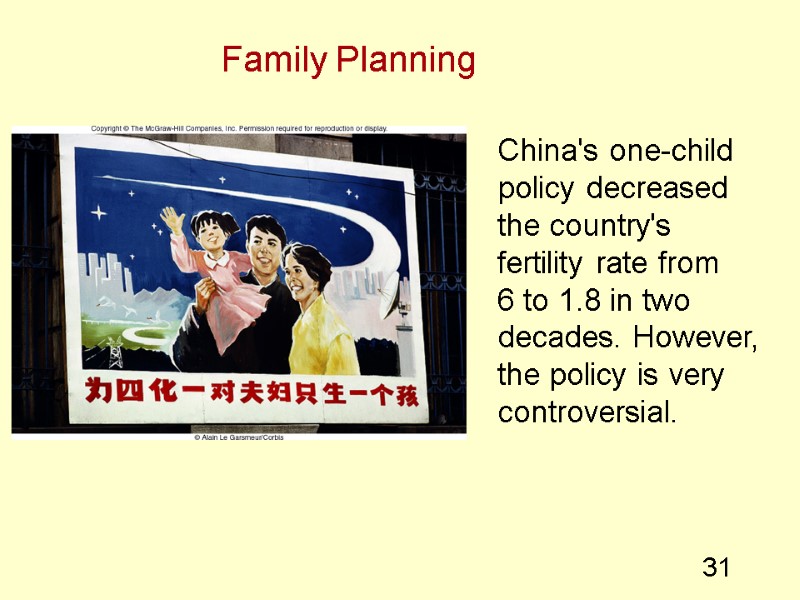
 31 China's one-child policy decreased the country's fertility rate from 6 to 1.8 in two decades. However, the policy is very controversial. Family Planning
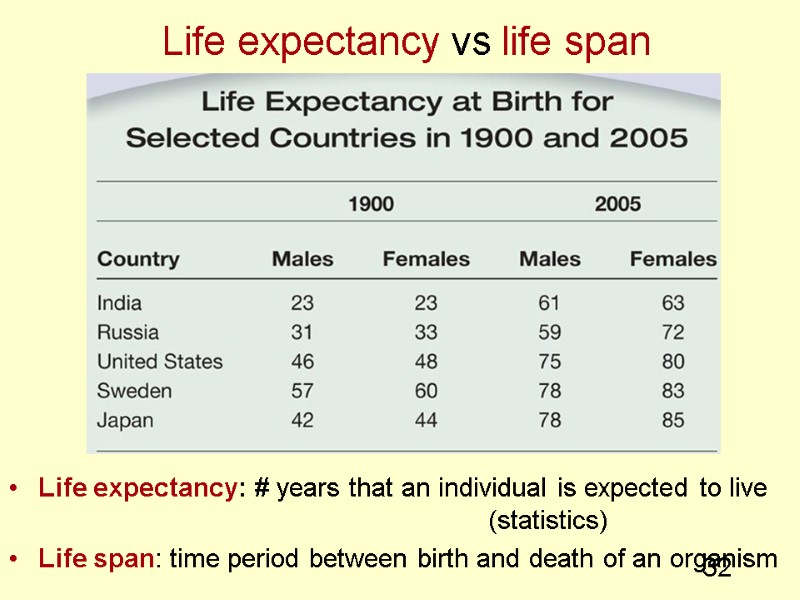
 32 Life expectancy vs life span Life expectancy: # years that an individual is expected to live (statistics) Life span: time period between birth and death of an organism
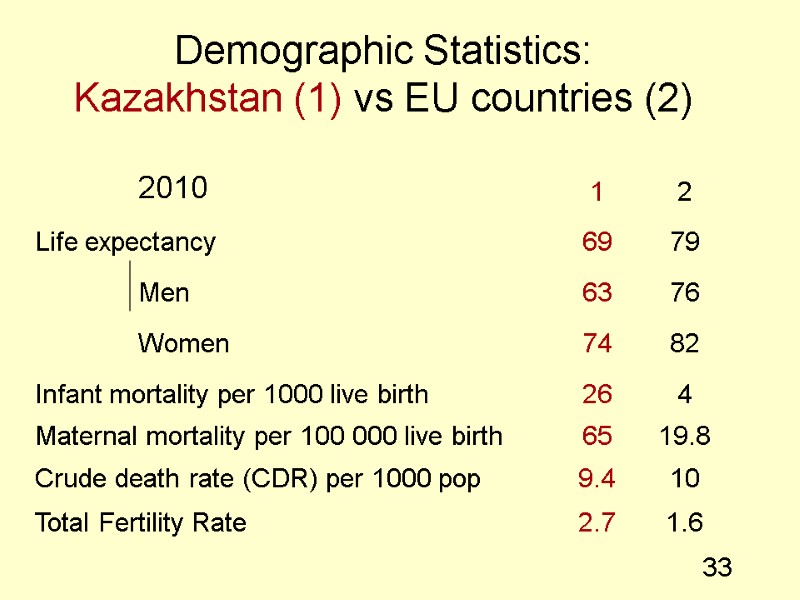
 33 Demographic Statistics: Kazakhstan (1) vs EU countries (2)
 34 As incomes rise, so does life expectancy
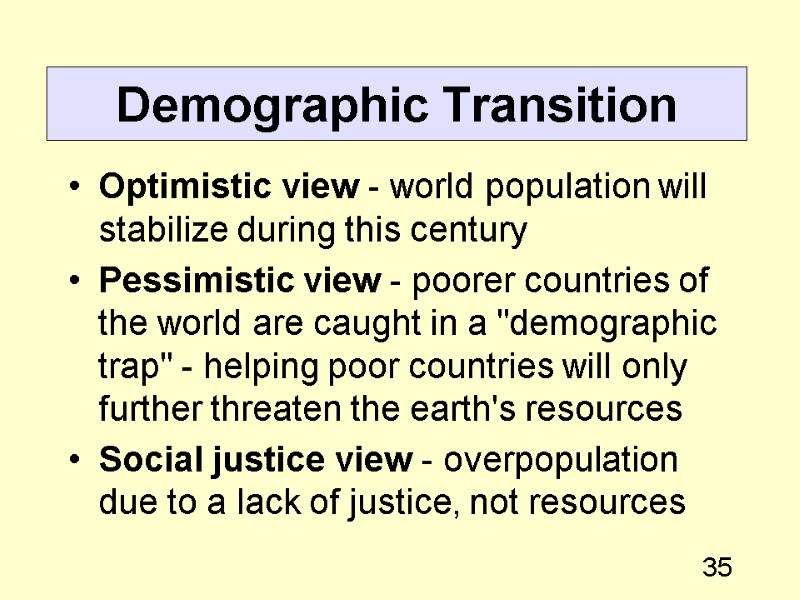
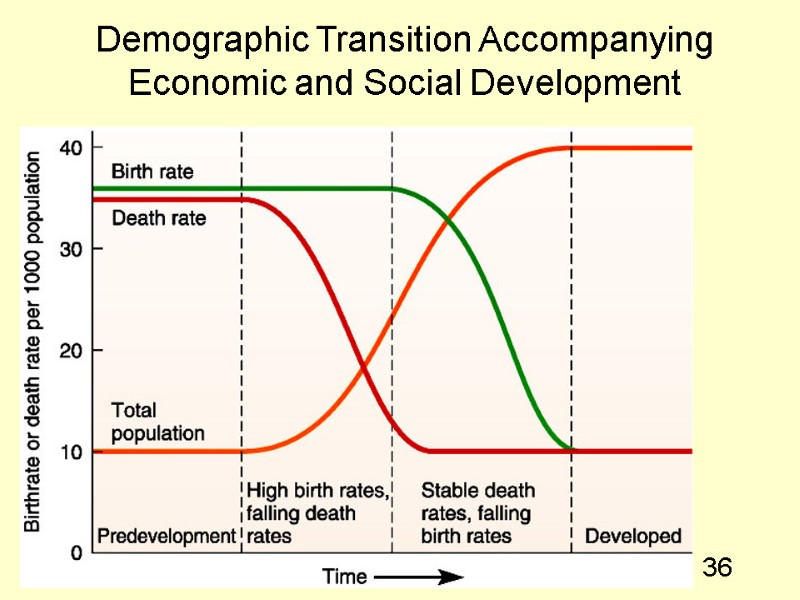
 35 Demographic Transition Optimistic view - world population will stabilize during this century Pessimistic view - poorer countries of the world are caught in a "demographic trap" - helping poor countries will only further threaten the earth's resources Social justice view - overpopulation due to a lack of justice, not resources
 36 Demographic Transition Accompanying Economic and Social Development
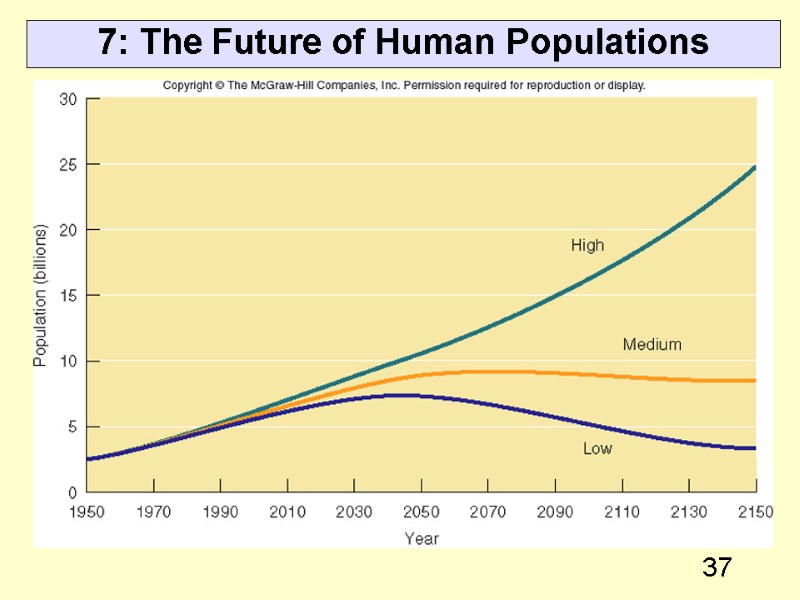
 37 7: The Future of Human Populations
 38 Summary Most of the population growth occurs in less-developed countries of the world. Demography - study of human populations and the things that affect them. Population growth rates are determined by biological, social, economic & political factors. The demographic transition model suggests that as a country becomes industrialized, its population becomes stabilized.

