
1 CHAPTER III NATIONAL INCOME ACCOUNTING COMPONENTS OF


- Размер: 306 Кб
- Количество слайдов: 24
Описание презентации 1 CHAPTER III NATIONAL INCOME ACCOUNTING COMPONENTS OF по слайдам
1 CHAPTER III NATIONAL INCOME ACCOUNTING COMPONENTS OF GDP MEASURING INFLATION
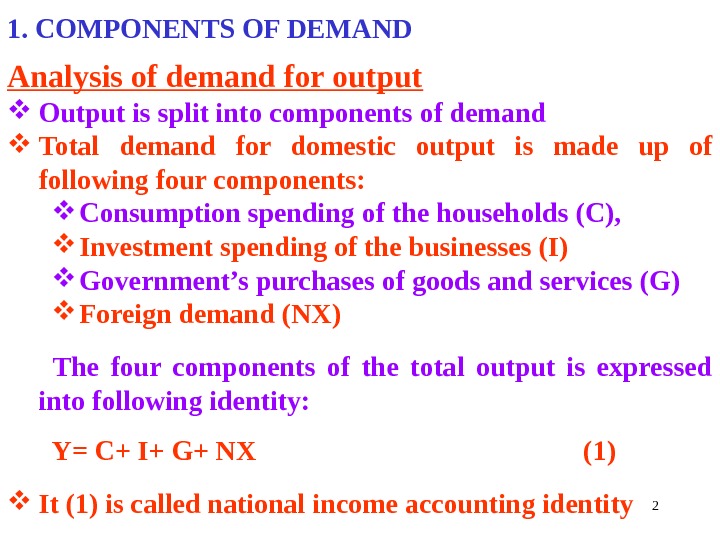
21. COMPONENTS OF DEMAND Analysis of demand for output Output is split into components of demand Total demand for domestic output is made up of following four components: Consumption spending of the households (C), Investment spending of the businesses (I) Government’s purchases of goods and services (G) Foreign demand (NX) The four components of the total output is expressed into following identity: Y= C+ I+ G+ NX (1) It (1) is called national income accounting identity
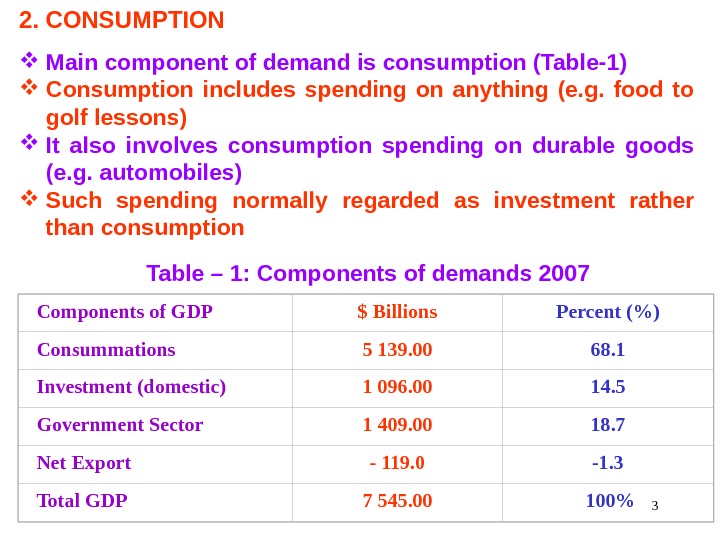
32. CONSUMPTION Main component of demand is consumption (Table-1) Consumption includes spending on anything (e. g. food to golf lessons) It also involves consumption spending on durable goods (e. g. automobiles) Such spending normally regarded as investment rather than consumption Table – 1: Components of demands 2007 Components of GDP $ Billions Percent (%) Consummations 5 139. 00 68. 1 Investment (domestic) 1 096. 00 14. 5 Government Sector 1 409. 00 18. 7 Net Export — 119. 0 -1. 3 Total GDP 7 545. 00 100%
4 Division of GDP in the USA from 2007 shows that: Consumption made 68. 1% of GDP in USA Share of Investments is 14. 2% Share of government sector is 17. 7% And Share of Foreign Demand is 1. 1% Share of the components are not constant They vary from Year to Year and country to country
5 Division of GDP in Japan from 2003 shows that: Japan consumes a far smaller share of GDP than USA Rising share of consumption in USA in 1980 s was important reasons for poor economic performance Higher consumption means: Less investment Larger trade deficits Lower saving
63. GOVERNMENT Government spending includes: Salaries of government employees Government spending for purchases of goods and services Defence expenditures Costs of transport and communication Government transfer payments as social security and unemployment benefits
74. INVESTMENT Investment includes: Investment increases ability to produce output Building of plants Construction of factories and offices Including new machineries Additions to a firm’s inventories Expenditure also for education means investment Human capital means ability to produce Investment in education is regarded as investment in human capital However, personal educational expenditures as consumption But public educational expenditures is government investment spending
85. NET EXPORTS ‘ Net exports’ account the difference between domestic spending on foreign goods and foreign spending on domestic goods When foreigners purchase our goods, their spending adds to the demand of our domestic goods When we purchase foreign goods has, it decreases demand for our domestic goods The difference between exports and imports is ‘Net Export’ US net export is negative since the 1980 s (Table-1) It means a deficit of trade-balance In some years net exports have been close to zero
97. SOME IMPORTANT IDENTITIES Let us introduce some notations and conventions It will be followed throughout the book Let us first simplify our analysis making following assumptions: Let us denote C for consumption and I for investment spending Let us output produced equals output sold Let us the economy has neither a government nor foreign trade
10 Hence, we can write: Y= C + I (1) Identity (2) shows the allocation of income It means the Nation Income could be either consumed or invested Let us establish a relationship among saving, consumption, and GDP: Again the National Income could be either consumed or saved Hence, we can write: Y = C + S (2) This (3) shows the components of demand
11 From (1) and (2), we have: C + I = Y = C + S (3) I = S (4) It means (4), in a simple economy investment equals saving Let analysis this conclusion More is saved more is invested More consumption means less investment Less consumption means more investment The conclusion is it is better to save more, them more saving means investment & growth
123. REINTRODUCING GOVERNMENT AND FOREIN TRADE Let us now introduce government and external sector in the model above Let us: Government purchases equals G Government taxes equals TA Transfers (Social Transfer) to the private sector equals TR Net exports (Exports — Imports) is NX
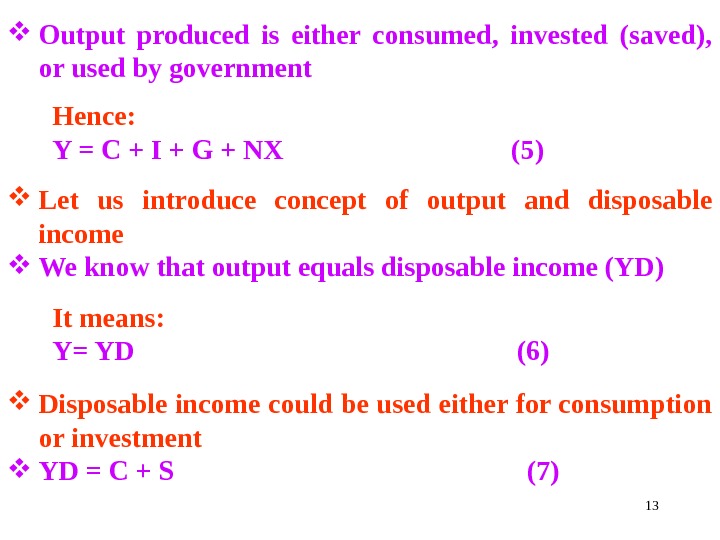
13 Output produced is either consumed, invested (saved), or used by government Hence: Y = C + I + G + NX (5) Let us introduce concept of output and disposable income We know that output equals disposable income (YD) It means: Y= YD (6) Disposable income could be used either for consumption or investment YD = C + S (7)
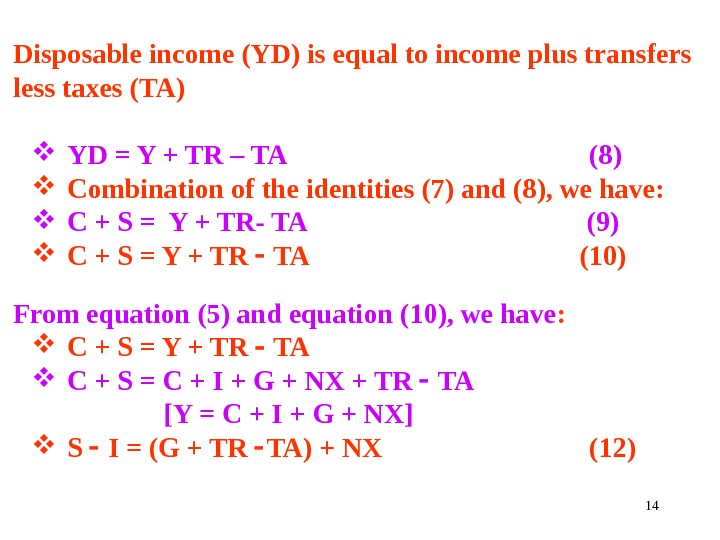
14 Disposable income (YD) is equal to income plus transfers less taxes (TA) YD = Y + TR – TA (8) Combination of the identities (7) and (8), we have: C + S = Y + TR- TA (9) C + S = Y + TR TA (10) From equation (5) and equation (10), we have : C + S = Y + TR TA C + S = C + I + G + NX + TR TA [Y = C + I + G + NX] S I = (G + TR TA) + NX (12)
15 Case-I If saving equals investment, then maximum possible investment is achieved: In this case, government spending and net export is zero It means, there is no government spending And eithere is no foreign trade or trade is balanced Net export could be zero, if there is no foreign trade or trade-balance is zero However, government spending could never be zero
16 Case-II By unchanged government spending, investment could be increased by increasing imports Apparently, it means that if more is imported more could be invested This is correct, but more and more capital goods (and not luxury) have to be imported However, only more and more export enables import of more and more capital goods that ensure growth Hence, export must be enhanced, but by import in place of luxury goods import of capital goods must be ensured
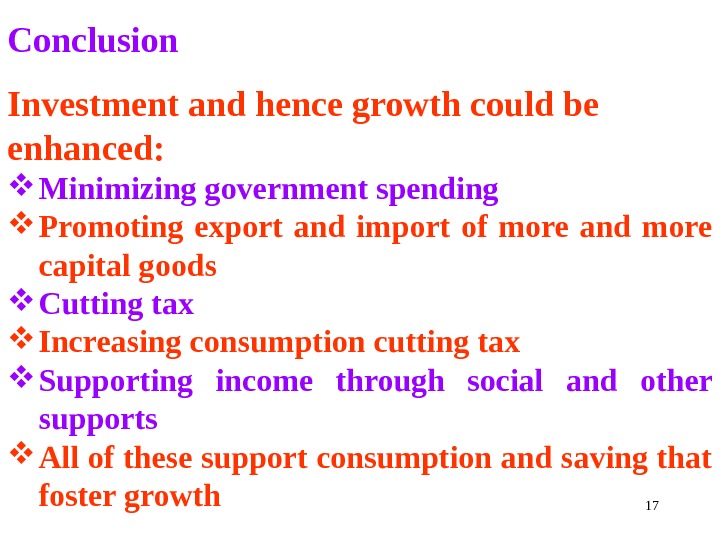
17 Conclusion Investment and hence growth could be enhanced: Minimizing government spending Promoting export and import of more and more capital goods Cutting tax Increasing consumption cutting tax Supporting income through social and other supports All of these support consumption and saving that foster growth
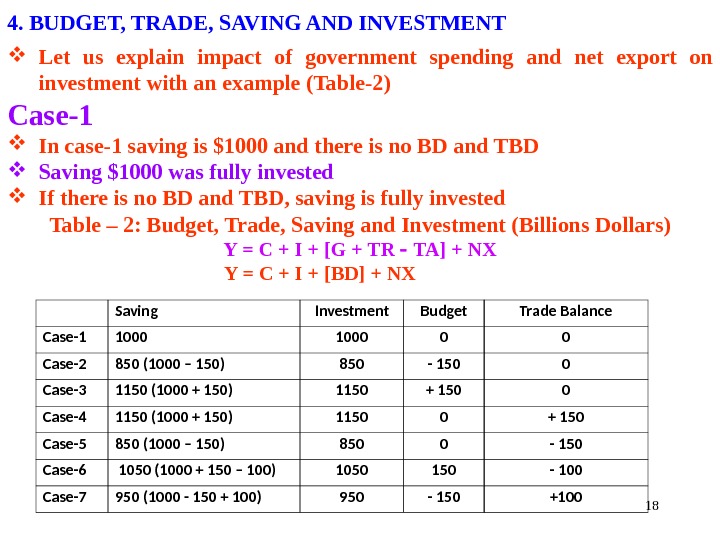
184. BUDGET, TRADE, SAVING AND INVESTMENT Let us explain impact of government spending and net export on investment with an example (Table-2) Case-1 In case-1 saving is $1000 and there is no BD and TBD Saving $1000 was fully invested If there is no BD and TBD, saving is fully invested Table – 2: Budget, Trade, Saving and Investment (Billions Dollars) Y = C + I + [G + TR TA] + NX Y = C + I + [BD] + NX Saving Investment Budget Trade Balance Case-1 1000 0 0 Case-2 850 (1000 – 150) 850 — 150 0 Case-3 1150 (1000 + 150) 1150 + 150 0 Case-4 1150 (1000 + 150) 1150 0 + 150 Case-5 850 (1000 – 150) 850 0 — 150 Case-6 1050 (1000 + 150 – 100) 1050 150 — 100 Case-7 950 (1000 — 150 + 100) 950 — 150 +
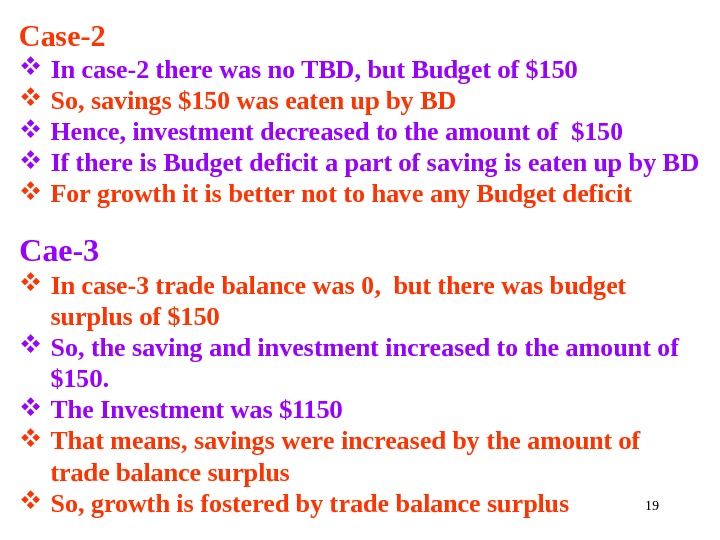
19 Case-2 In case-2 there was no TBD, but Budget of $150 So, savings $150 was eaten up by BD Hence, investment decreased to the amount of $150 If there is Budget deficit a part of saving is eaten up by BD For growth it is better not to have any Budget deficit Cae-3 In case-3 trade balance was 0, but there was budget surplus of $150 So, the saving and investment increased to the amount of $150. The Investment was $1150 That means, savings were increased by the amount of trade balance surplus So, growth is fostered by trade balance surplus
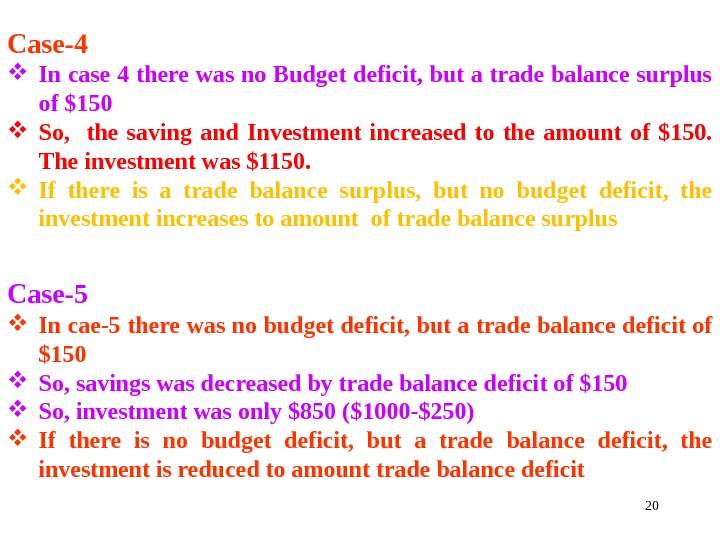
20 Case-4 In case 4 there was no Budget deficit, but a trade balance surplus of $150 So, the saving and Investment increased to the amount of $150. The investment was $1150. If there is a trade balance surplus, but no budget deficit, the investment increases to amount of trade balance surplus Case-5 In cae-5 there was no budget deficit, but a trade balance deficit of $150 So, savings was decreased by trade balance deficit of $150 So, investment was only $850 ($1000 -$250) If there is no budget deficit, but a trade balance deficit, the investment is reduced to amount trade balance deficit
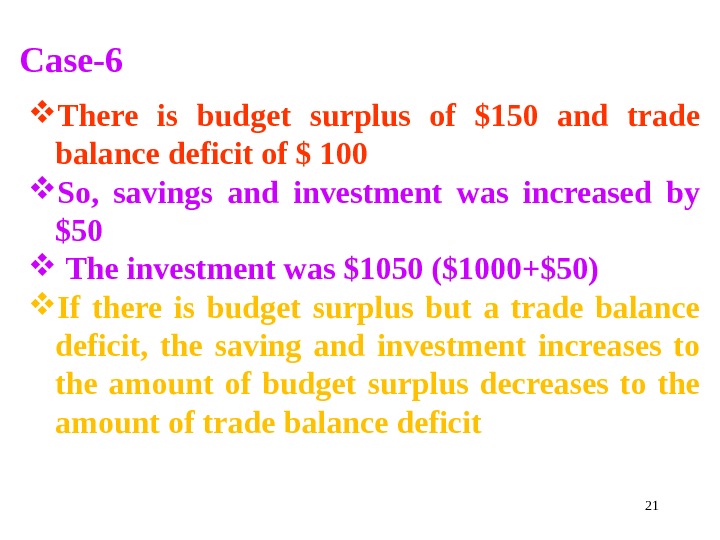
21 Case-6 There is budget surplus of $150 and trade balance deficit of $ 100 So, savings and investment was increased by $50 The investment was $1050 ($1000+$50) If there is budget surplus but a trade balance deficit, the saving and investment increases to the amount of budget surplus decreases to the amount of trade balance deficit
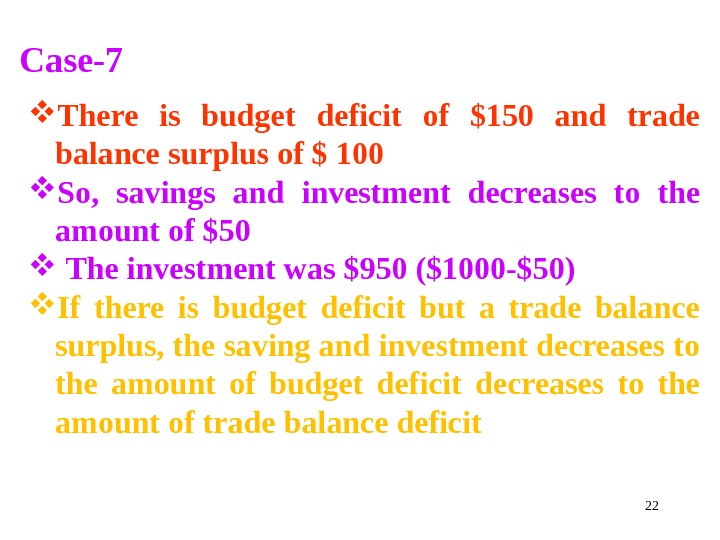
22 Case-7 There is budget deficit of $150 and trade balance surplus of $ 100 So, savings and investment decreases to the amount of $50 The investment was $950 ($1000 -$50) If there is budget deficit but a trade balance surplus, the saving and investment decreases to the amount of budget deficit decreases to the amount of trade balance deficit
23 Questions Describe the different components of GDP and explain the relationship among the components saving, investment and government sector. Explain the relation between savings and investment using the national income accounting identities. Explain the impact of national budget, trade balance on savings and investment using an example.
24 End of the Chapter Thank You Very Much For Patient Listening