1 Basic Concepts of Real Estate Marketability Analysis



06-re_marketability_analysis.ppt
- Размер: 4.3 Mегабайта
- Количество слайдов: 54
Описание презентации 1 Basic Concepts of Real Estate Marketability Analysis по слайдам
 1 Basic Concepts of Real Estate Marketability Analysis Wayne Foss, DBA, MAI, CRE, FRICS Foss Consulting Group Email: wfoss@fossconsult. com
 2 Property Productivity Concepts Productivity Analysis — Analysis of a property’s capacity to deliver services to meet human needs, house economic activities, and supply satisfaction and amenities. A parcel of real estate produces (supplies) services for those who use it. Price paid is a function of: its supply of services relative to potential users’ purchasing power need for its services inability to find good substitutes at a lower price Market Analysis in Real Estate is different from other types of market analysis real estate is not well defined product can change over time location is fixed
 3 Property Productivity Concepts Focus of the discussion for all aspects of the subject property is to: Segment the subject market to address advantages and disadvantages Property Productivity Analysis seeks to answer: What does the subject have to offer to the market? What are the subject’s competitive advantages and disadvantages
 4 Property Productivity: Site and Improvements Design and condition of the subject can limit the potential market it can serve. Physical attributes analysis is the initial action in marketability analysis Physical attributes of the site: Size, Shape, Topography, Climate Vegetation, Natural Drainage, Floodplain Soil and Subsoil


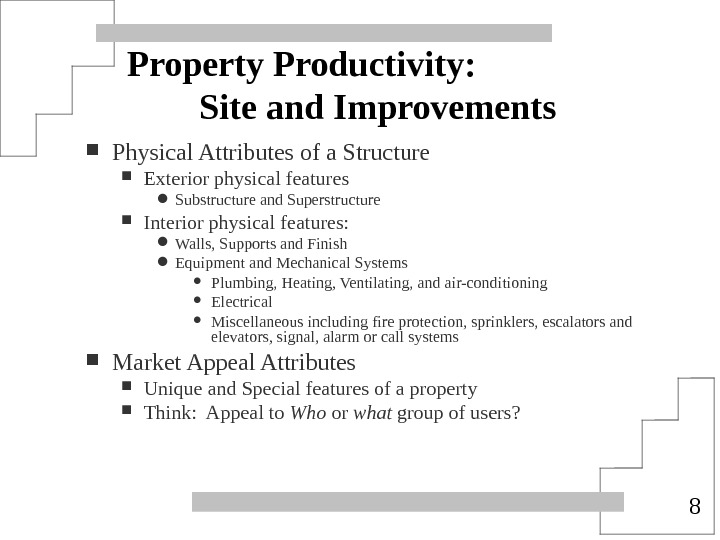
 8 Property Productivity: Site and Improvements Physical Attributes of a Structure Exterior physical features Substructure and Superstructure Interior physical features: Walls, Supports and Finish Equipment and Mechanical Systems Plumbing, Heating, Ventilating, and air-conditioning Electrical Miscellaneous including fire protection, sprinklers, escalators and elevators, signal, alarm or call systems Market Appeal Attributes Unique and Special features of a property Think: Appeal to Who or what group of users?
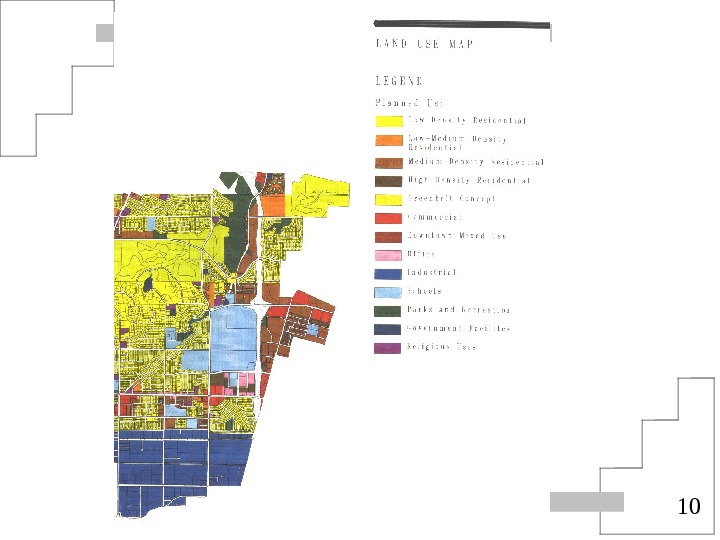
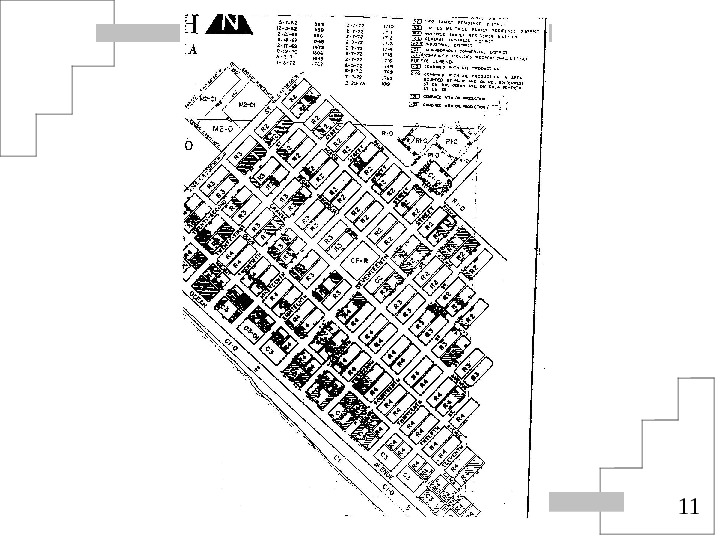
 9 Property Productivity: Legal and Regulatory Attributes Regulations may be Public or Private Can enhance or detract from the value of the property Examples of Constraints: Local Zoning Ordinances and General Plans restrict a site that is ideal for an office building to residential housing strong neighborhood association prevents changes in use Local Subdivision Codes requirements for extra wide streets and landscaping increase cost of development, thereby reducing the supply Examples of Enhancements: Rezoning of a neighborhood that is undergoing transition to a higher and more intensive use. (i. e. : residential to commercial)


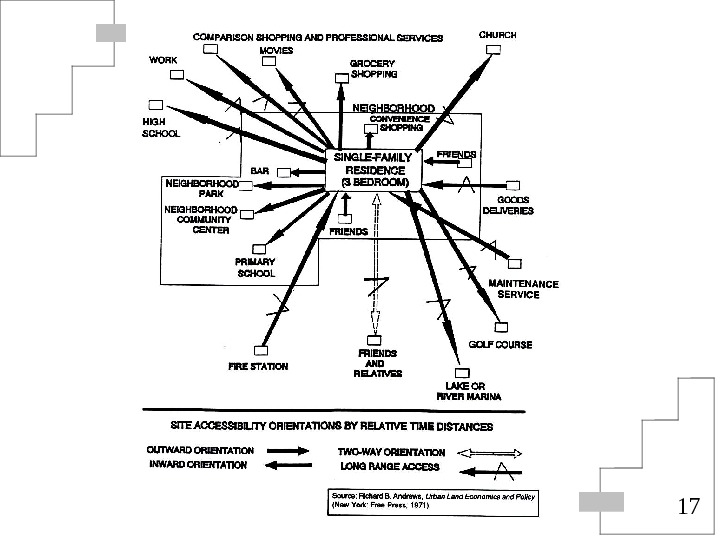
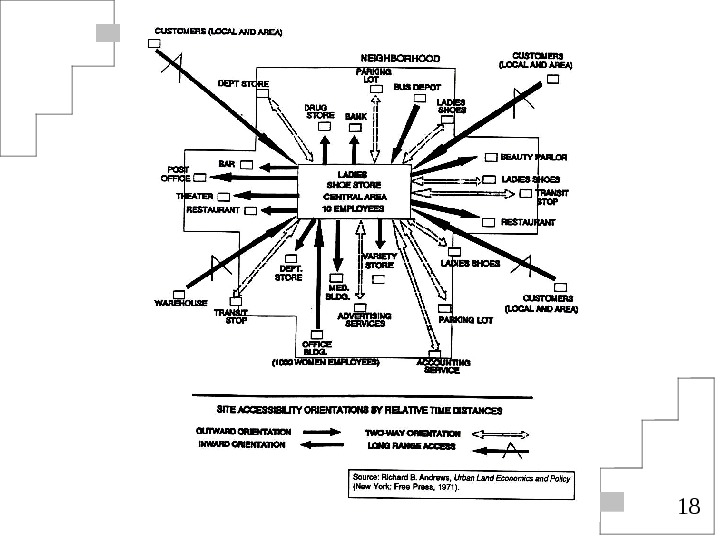
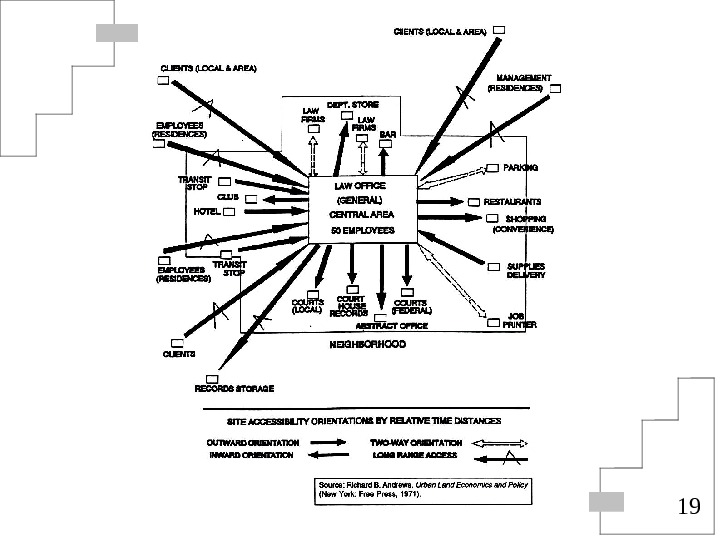
 12 Property Productivity: Location Determinants Linkages: Transportation linkages Movement of people, goods and services to and from the subject Utility linkages: gas pipelines, sewer, water, telephone, electricity Components Route: The established or directed course of travel between two spatially separate parcels of real estate Access: The ability to enter or pass to a site from a route, or to a route from a site. Examples are streets, curb cuts, sewer laterals Travel Mode: The locomotion method for traversing a route and gaining access. Examples are automobile, bus, train, truck, airplane, boats, etc. Route Orientation: A route may be oriented inward toward the subject, outward from the subject or dual directional. Example, a grocery store located on a busy street so that people returning from work can easily stop.


 15 Property Productivity: Location Determinants Exposure and Externalities May have positive or negative effects on the productivity of the site and its linkages Neighborhood Externalities neighborhood character — properties compatibility with each other Linkage Externalities impairment to the productivity of the land such as when a sewer has reached it’s capacity, but the neighborhood is only one-half developed or streets are too narrow and overcrowded. Classification of Externalities can be Positive or Negative, Natural or Man-made
 16 Property Productivity: Location Determinants Associations: Different types of property require different linkages and land use associations Housing must be linked to jobs, shopping and community facilities Retail uses need customers Office uses are supported by hotels, print shops and restaurants


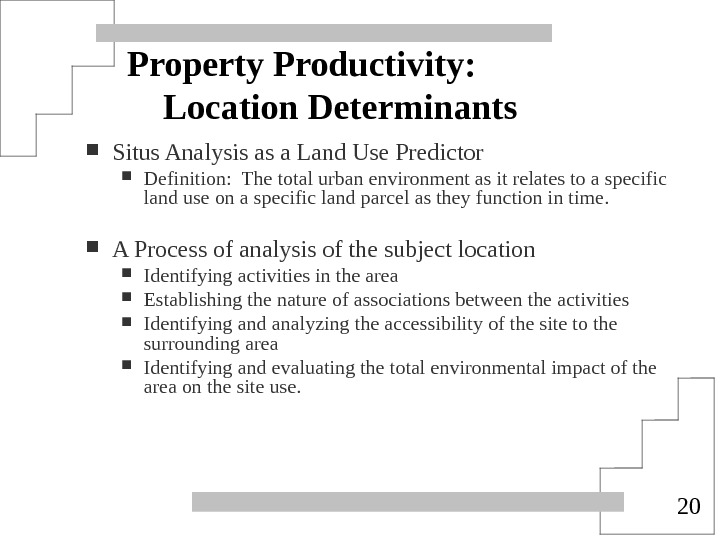
 20 Property Productivity: Location Determinants Situs Analysis as a Land Use Predictor Definition: The total urban environment as it relates to a specific land use on a specific land parcel as they function in time. A Process of analysis of the subject location Identifying activities in the area Establishing the nature of associations between the activities Identifying and analyzing the accessibility of the site to the surrounding area Identifying and evaluating the total environmental impact of the area on the site use.
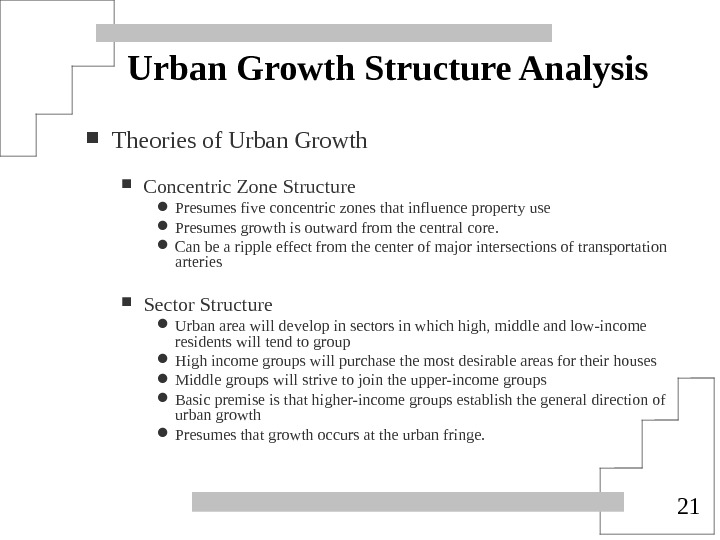
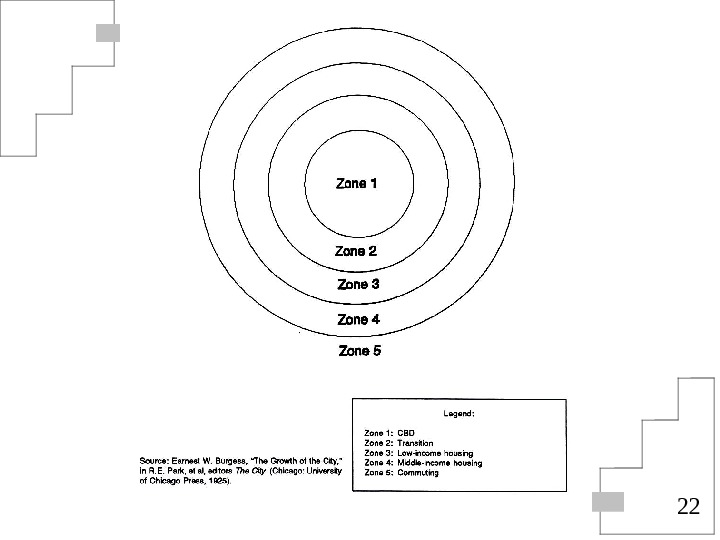
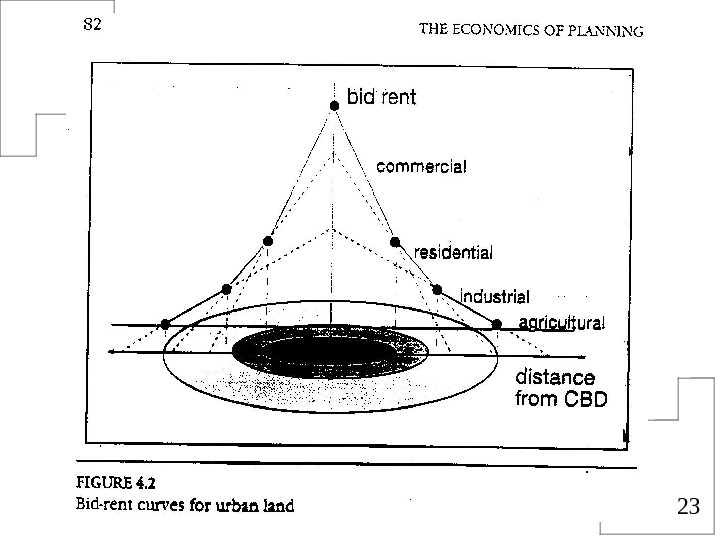
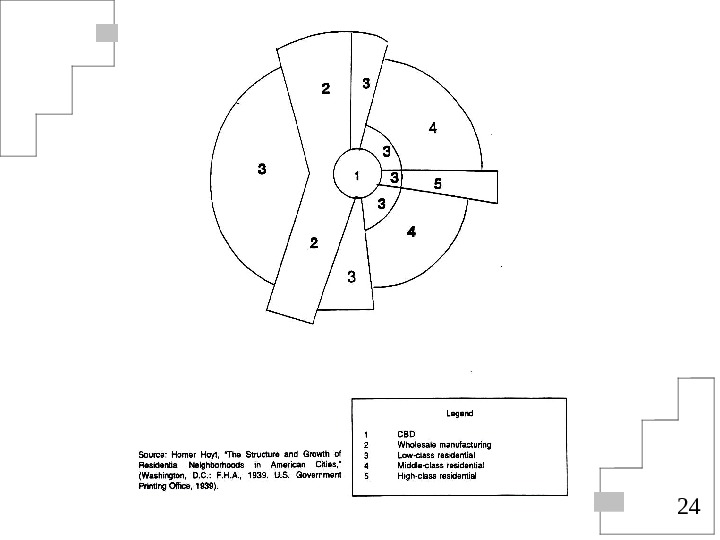
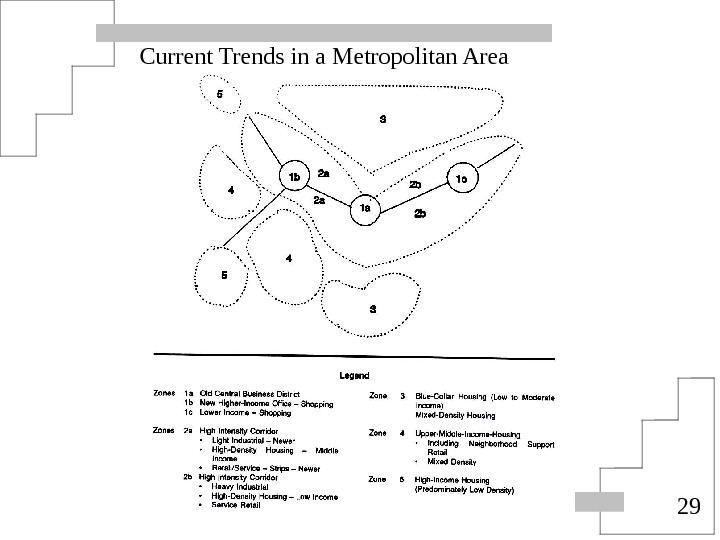
 21 Urban Growth Structure Analysis Theories of Urban Growth Concentric Zone Structure Presumes five concentric zones that influence property use Presumes growth is outward from the central core. Can be a ripple effect from the center of major intersections of transportation arteries Sector Structure Urban area will develop in sectors in which high, middle and low-income residents will tend to group High income groups will purchase the most desirable areas for their houses Middle groups will strive to join the upper-income groups Basic premise is that higher-income groups establish the general direction of urban growth Presumes that growth occurs at the urban fringe.


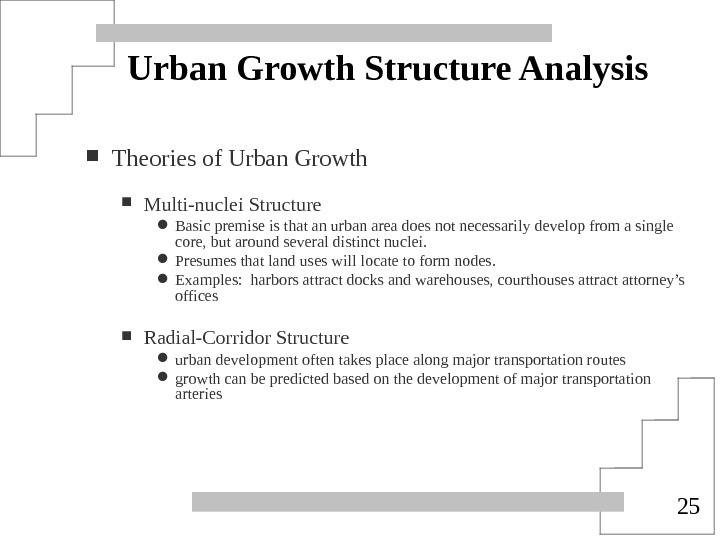
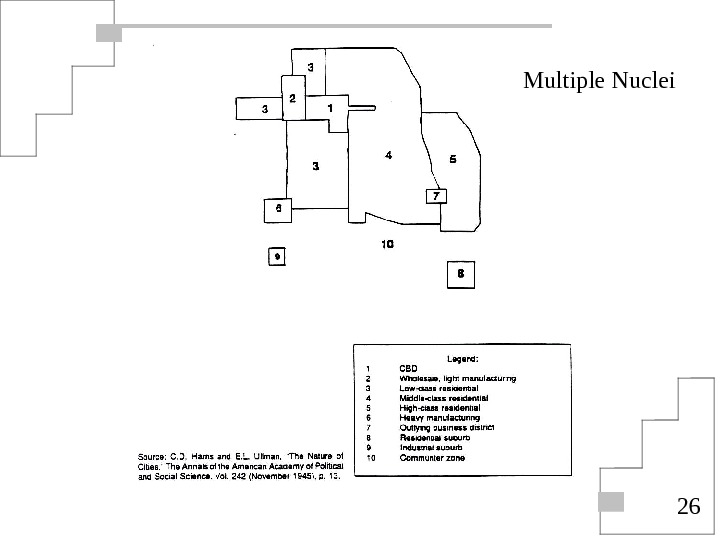
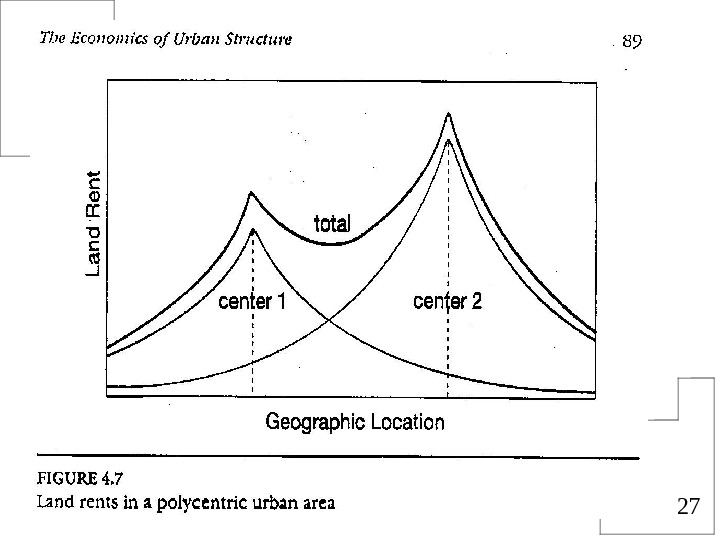
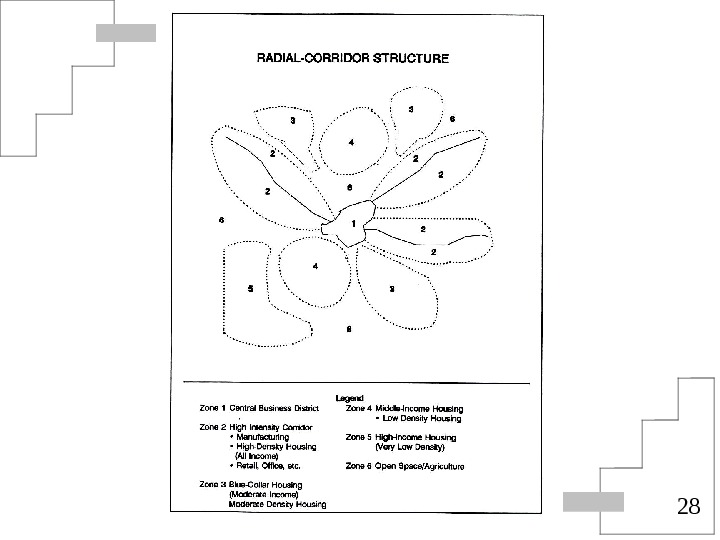
 25 Urban Growth Structure Analysis Theories of Urban Growth Multi-nuclei Structure Basic premise is that an urban area does not necessarily develop from a single core, but around several distinct nuclei. Presumes that land uses will locate to form nodes. Examples: harbors attract docks and warehouses, courthouses attract attorney’s offices Radial-Corridor Structure urban development often takes place along major transportation routes growth can be predicted based on the development of major transportation arteries
 26 Multiple Nuclei


 29 Current Trends in a Metropolitan Area
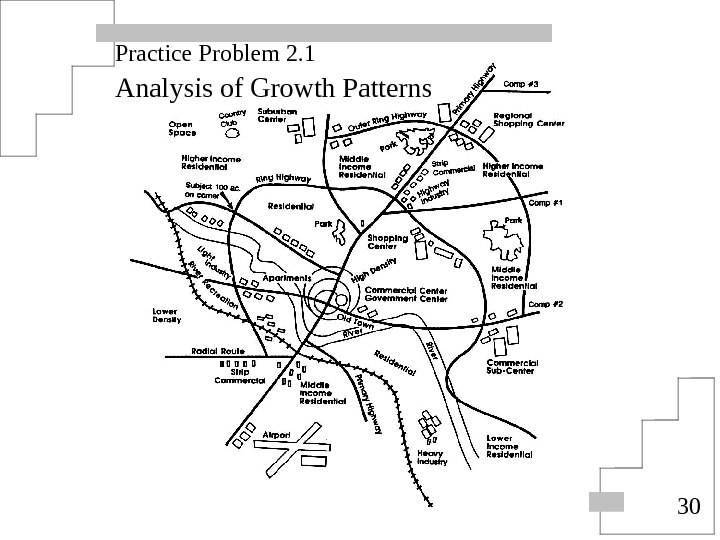
 30 Practice Problem 2. 1 Analysis of Growth Patterns
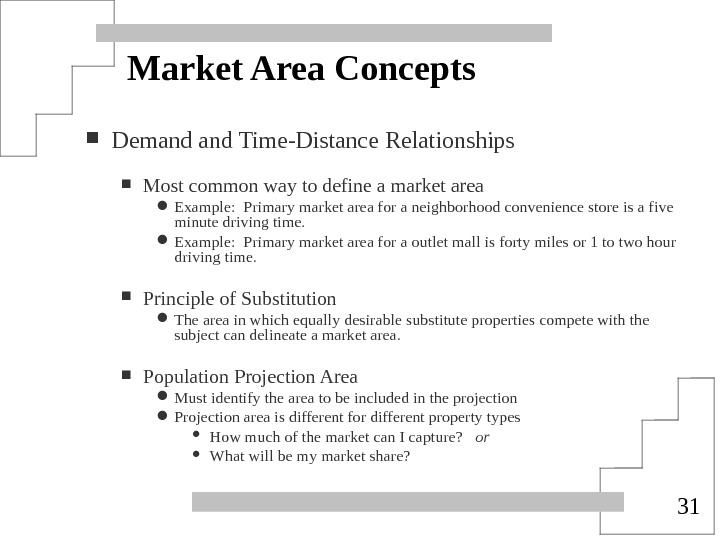
 31 Market Area Concepts Demand Time-Distance Relationships Most common way to define a market area Example: Primary market area for a neighborhood convenience store is a five minute driving time. Example: Primary market area for a outlet mall is forty miles or 1 to two hour driving time. Principle of Substitution The area in which equally desirable substitute properties compete with the subject can delineate a market area. Population Projection Area Must identify the area to be included in the projection Projection area is different for different property types How much of the market can I capture? or What will be my market share?
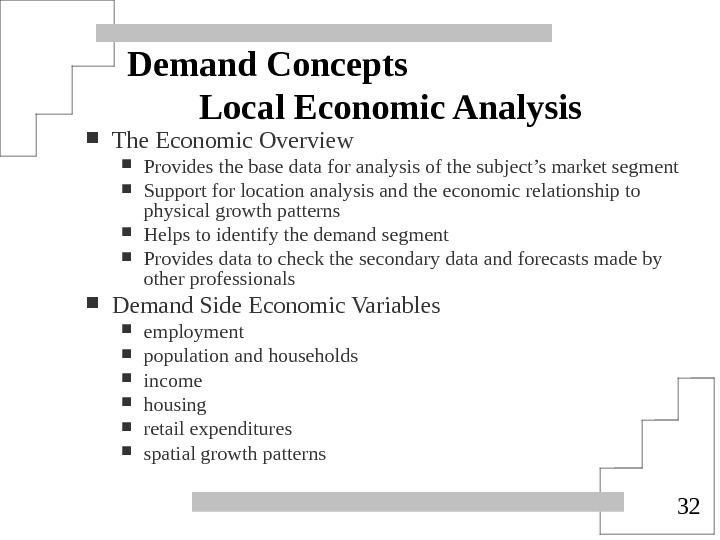
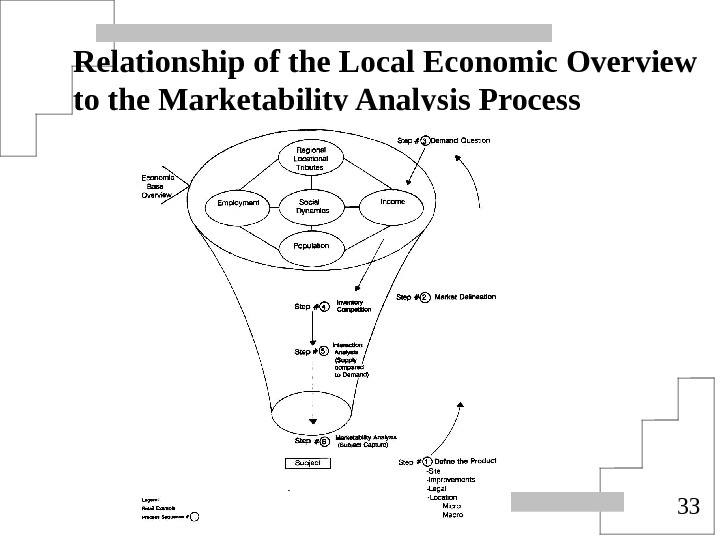
 32 Demand Concepts Local Economic Analysis The Economic Overview Provides the base data for analysis of the subject’s market segment Support for location analysis and the economic relationship to physical growth patterns Helps to identify the demand segment Provides data to check the secondary data and forecasts made by other professionals Demand Side Economic Variables employment population and households income housing retail expenditures spatial growth patterns
 33 Relationship of the Local Economic Overview to the Marketability Analysis Process
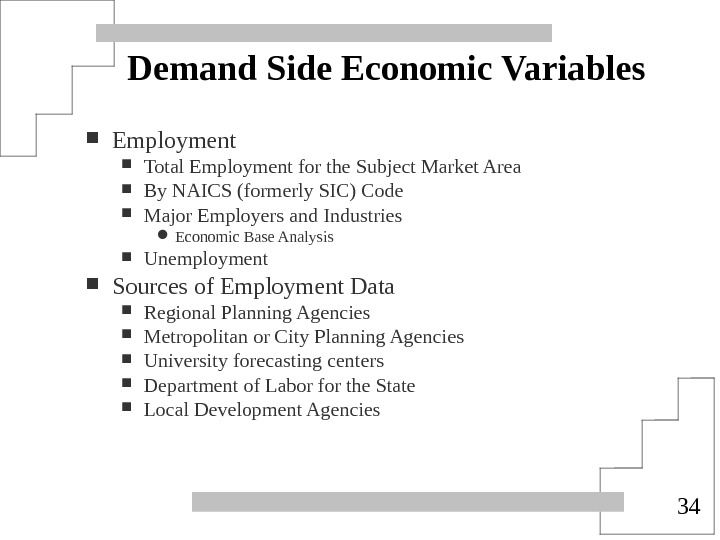
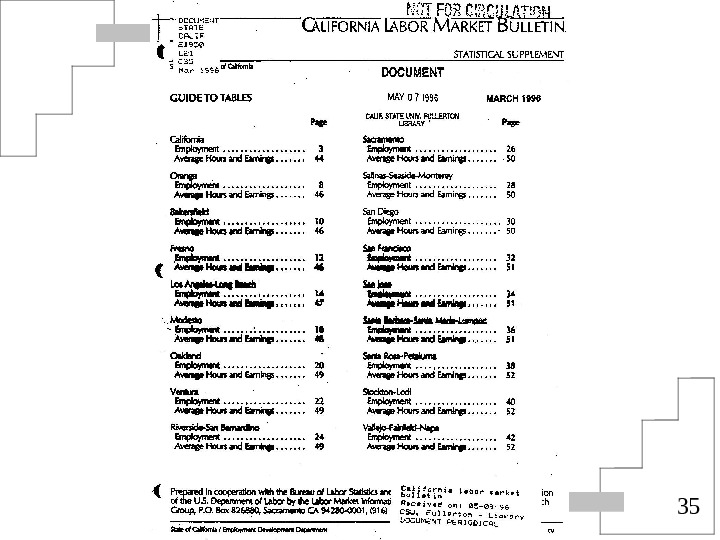
 34 Demand Side Economic Variables Employment Total Employment for the Subject Market Area By NAICS (formerly SIC) Code Major Employers and Industries Economic Base Analysis Unemployment Sources of Employment Data Regional Planning Agencies Metropolitan or City Planning Agencies University forecasting centers Department of Labor for the State Local Development Agencies

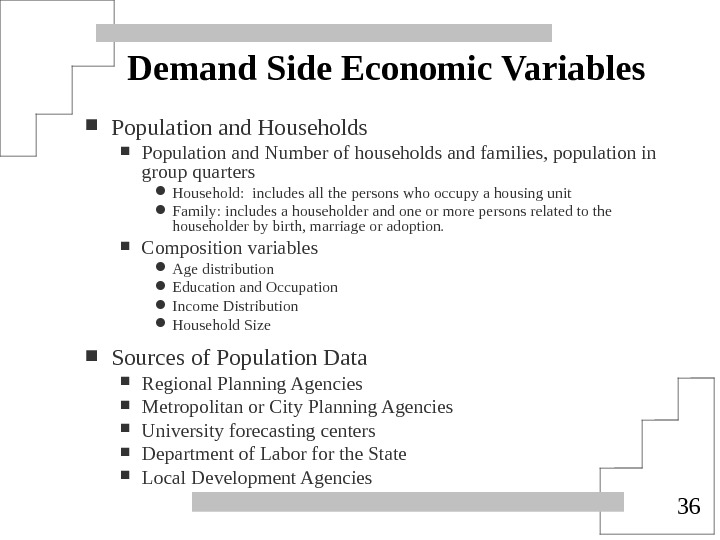
 36 Demand Side Economic Variables Population and Households Population and Number of households and families, population in group quarters Household: includes all the persons who occupy a housing unit Family: includes a householder and one or more persons related to the householder by birth, marriage or adoption. Composition variables Age distribution Education and Occupation Income Distribution Household Size Sources of Population Data Regional Planning Agencies Metropolitan or City Planning Agencies University forecasting centers Department of Labor for the State Local Development Agencies

 38 Demand Side Economic Variables Income Mean, Median and per Capita Income Distribution Data to Gather and Analyze Number of existing housing units New Construction Types of existing and newly constructed housing units Occupancy and vacancy data Price level Compositional data concerning the housing stock size, age, style, stories, etc. Mortgage interest rates and credit availability Demolitions and net conversions
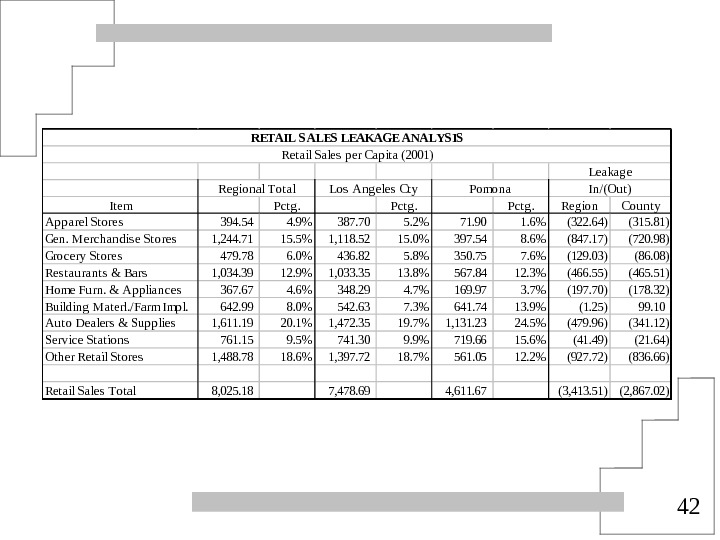
 39 Demand Side Economic Variables Retail Expenditures The retail SIC Codes (generally codes 44) Characteristics of and differences among convenience, neighborhood, community, regional and super-regional shopping centers Data to Gather and Analyze Sales by retail category or NAICS (SIC) code Typical sales volume per square foot of space for different retail establishments Tenant mix in successful shopping centers by type of center The percentage of income spent by consumers on different retail products or spent in different retail establishments Should prepare or obtain forecasts for expenditures by retail categories and changes in the purchasing power of the population in the study area


 42 Item. Pctg. Region. County Apparel Stores 394. 54 4. 9%387. 70 5. 2%71. 90 1. 6%(322. 64) (315. 81) Gen. Merchandis e Stores 1, 244. 71 15. 5%1, 118. 52 15. 0%397. 54 8. 6%(847. 17) (720. 98) Grocery Stores 479. 78 6. 0%436. 82 5. 8%350. 75 7. 6%(129. 03) (86. 08) Res taurants & Bars 1, 034. 39 12. 9%1, 033. 35 13. 8%567. 84 12. 3%(466. 55) (465. 51) Home Furn. & Appliances 367. 67 4. 6%348. 29 4. 7%169. 97 3. 7%(197. 70) (178. 32) Building Materl. /Farm Impl. 642. 99 8. 0%542. 63 7. 3%641. 74 13. 9%(1. 25) 99. 10 Auto Dealers & Supplies 1, 611. 19 20. 1%1, 472. 35 19. 7%1, 131. 23 24. 5%(479. 96) (341. 12) Service Stations 761. 15 9. 5%741. 30 9. 9%719. 66 15. 6%(41. 49) (21. 64) Other Retail Stores 1, 488. 78 18. 6%1, 397. 72 18. 7%561. 05 12. 2%(927. 72) (836. 66) Retail Sales Total 8, 025. 18 7, 478. 69 4, 611. 67 (3, 413. 51) (2, 867. 02) Los Angeles Cty. Pomona RETAIL S ALES LEAKAGE ANALYS IS Regional Total Leakage In/(Out) Retail Sales per Capita (2001)
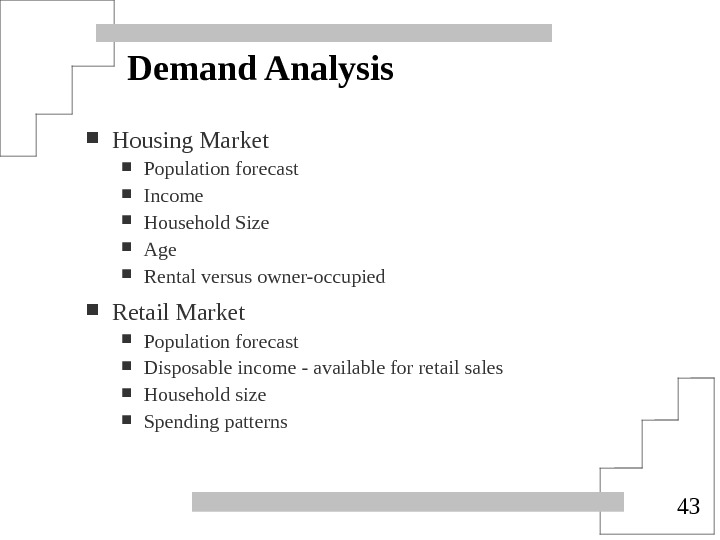
 43 Demand Analysis Housing Market Population forecast Income Household Size Age Rental versus owner-occupied Retail Market Population forecast Disposable income — available for retail sales Household size Spending patterns
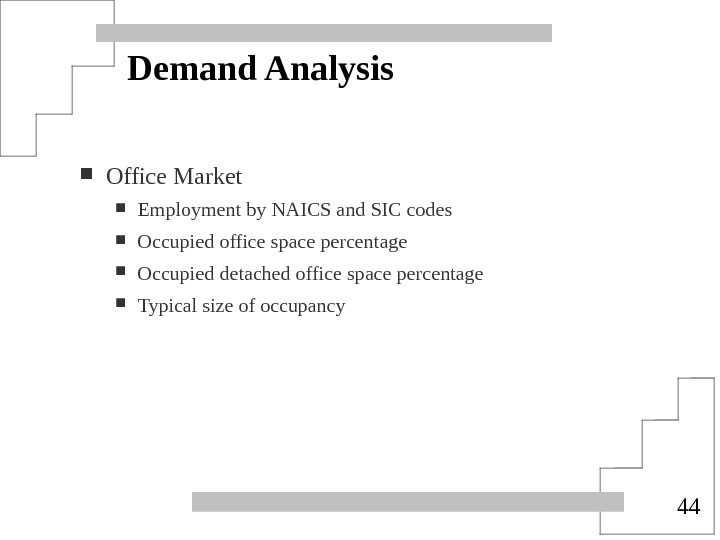
 44 Demand Analysis Office Market Employment by NAICS and SIC codes Occupied office space percentage Occupied detached office space percentage Typical size of occupancy
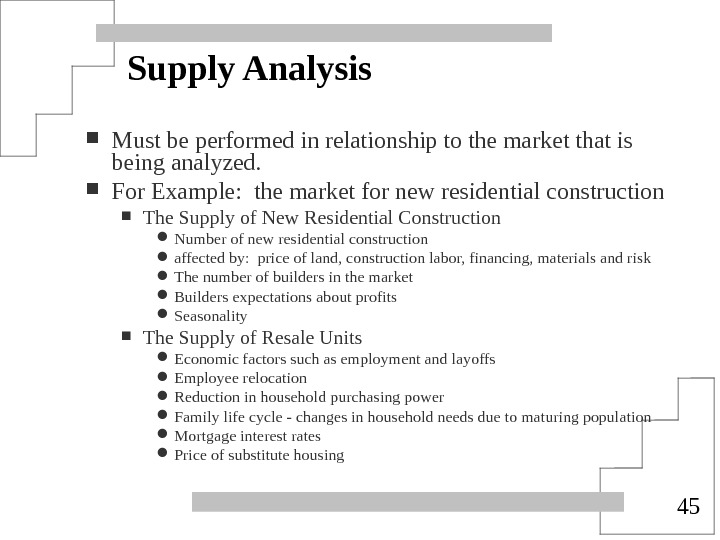
 45 Supply Analysis Must be performed in relationship to the market that is being analyzed. For Example: the market for new residential construction The Supply of New Residential Construction Number of new residential construction affected by: price of land, construction labor, financing, materials and risk The number of builders in the market Builders expectations about profits Seasonality The Supply of Resale Units Economic factors such as employment and layoffs Employee relocation Reduction in household purchasing power Family life cycle — changes in household needs due to maturing population Mortgage interest rates Price of substitute housing
 46 Supply and Demand Interaction Indicators of Oversupply or Excess Demand Vacancy (or occupancy) rates Absorption Rates Demand compared to supply that suggests an excess of supply (or demand) Rising (or declining) prices and/or rents Lack of Sale transactions Important Questions to Ask and Answer Do the current trends in absorption, vacancies etc. make sense and support the demand supply conditions? What is the current stage of the real estate cycle? How long might these observed conditions persist?
 47 Summary of the Basic Concepts Property Productivity Analysis Physical and market appeal attributes of the site and the structures Legal and Regulatory constraints Location attributes Urban Growth and the forces that influence them Market Area Concepts Time-distance relationships Market or Trade Area (population projection area) Demand Concepts Major economic variables Employment Population and Households Income Housing Retail Expenditures Spatial Growth paths
 48 Summary of the Basic Concepts Supply Concepts Stock of competitive properties Changes in the stock Influences on the supply of new construction Supply and Demand Interaction Concepts The significance of equilibrium analysis Indicators of disequilibrium Vacancy rates Absorption rates Residual demand/supply imbalance Price/Rent changes
 49 Demand Side Economic Variables Housing or Dwelling Unit versus Structure Housing Unit versus Household Single-family detached versus single-family attached Single-family versus multi-family structures Sources of Population Data Regional Planning Agencies Metropolitan or City Planning Agencies University forecasting centers Department of Labor for the State Local Development Agencies
 50 Feasibility Rent Definition: The rent (income) required to attract new construction for a specific property type. Rent can be expressed in either monthly or annual amounts.
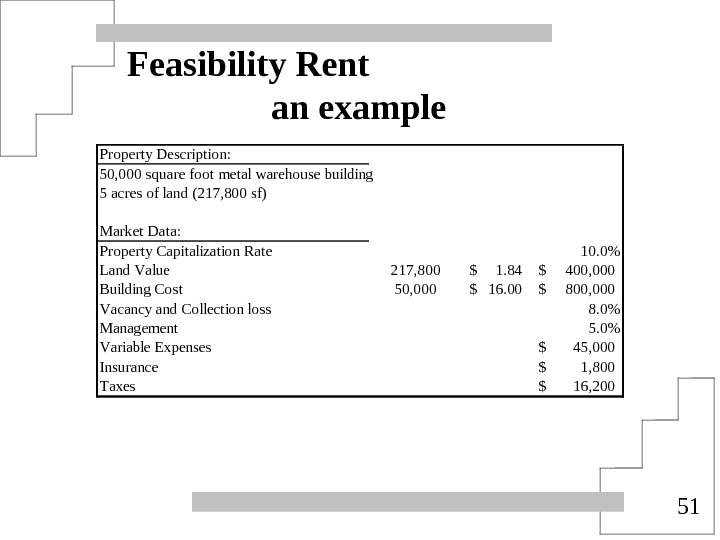
 51 Feasibility Rent an example Property Description: 50, 000 square foot metal warehouse building 5 acres of land (217, 800 sf) Market Data: Property Capitalization Rate 10. 0% Land Value 217, 800 1. 84$ 400, 000$ Building Cost 50, 000 16. 00$ 800, 000$ Vacancy and Collection loss 8. 0% Management 5. 0% Variable Expenses 45, 000$ Insurance 1, 800$ Taxes 16, 200$
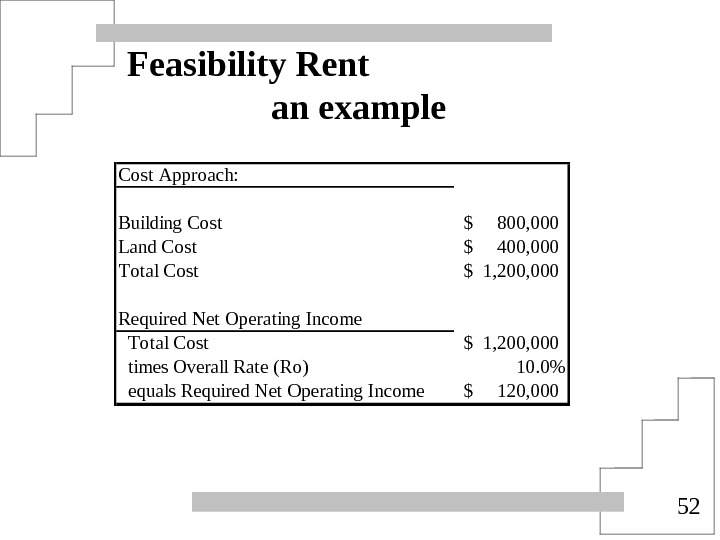
 52 Feasibility Rent an example Cost Approach: Building Cost 800, 000$ Land Cost 400, 000$ Total Cost 1, 200, 000$ Required Net Operating Income Total Cost 1, 200, 000$ times Overall Rate (Ro) 10. 0% equals Required Net Operating Income 120, 000$
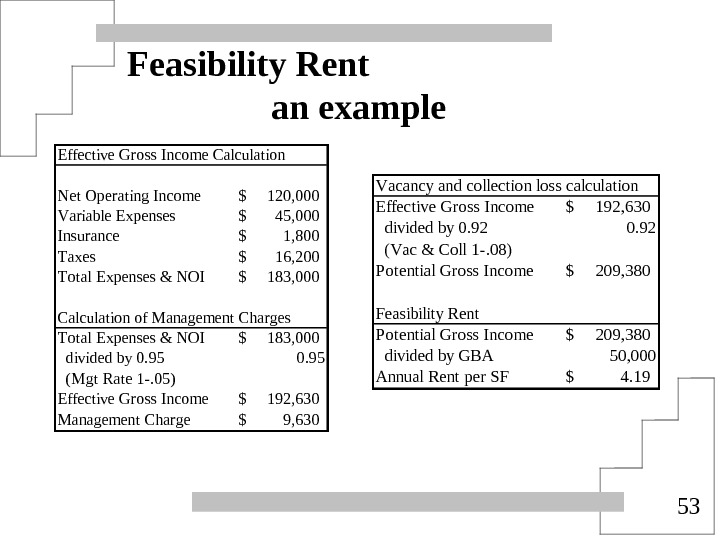
 53 Feasibility Rent an example Effective Gross Income Calculation Net Operating Income 120, 000$ Variable Expenses 45, 000$ Insurance 1, 800$ Taxes 16, 200$ Total Expenses & NOI 183, 000$ Calculation of Management Charges Total Expenses & NOI 183, 000$ divided by 0. 95 (Mgt Rate 1 -. 05) Effective Gross Income 192, 630$ Management Charge 9, 630$ Vacancy and collection loss calculation Effective Gross Income 192, 630$ divided by 0. 92 (Vac & Coll 1 -. 08) Potential Gross Income 209, 380$ Feasibility Rent Potential Gross Income 209, 380$ divided by GBA 50, 000 Annual Rent per SF 4. 19$
 54 So That’s Basic Concepts of Real Estate Marketability Analysis Wayne Foss, DBA, MAI, CRE, FRICS, Fullerton, CA USA Email: waynefoss@usa. net

