
1 — 11 Unit# 6 Product Design


- Размер: 1.4 Mегабайта
- Количество слайдов: 27
Описание презентации 1 — 11 Unit# 6 Product Design по слайдам
1 — 11 Unit# 6 Product Design
1 — 22 • Product Development Process • Economic Analysis of Development Projects • Designing for the Customer • Design for Manufacturability • Measuring Product Development Performance. OBJECTIVES
1 — 33 Typical Phases of Product Development: Example of Marketing Function • Planning – Articulate market opportunities – Define market segment • Concept Development – Collect customer needs – Identify lead users – Identify competitive products • System-Level design – Develop plan for product options & extended product family – Set target sales price points • Design Detail – Develop marketing plan • Testing and Refinement – Develop promotion & launch materials – Facilitate field testing • Production Ramp-up – Place early production with key customers
1 — 44 Economic Analysis of Project Development Costs • Using measurable factors to help determine: – Operational design and development decisions • should we outsource in order to save time? – Go/no-go milestones • should we develop to address new mkt opportunity? • Building a Base-Case Financial Model – Estimating time & amount of cash flow to determine Net Present Value of the cash flow – A financial model consisting of major cash flows • e. g costs: development, marketing & unit production – Sensitivity Analysis for “what if” questions • Calculate changes in NPV vs. changes in factors in model
1 — 55 Scope of product development team. Product Development System Scope for design and engineering teams Evaluation. Introduction. Test Market. Functional Specifications Design Review. Product Specifications. Customer Requirements. Ability. Ideas Figure 5.
1 — 66 Quality Function Deployment Identify customer wants Identify how the good/service will satisfy customer wants Relate customer wants to product hows Identify relationships between the firm ’s hows Develop importance ratings Evaluate competing products
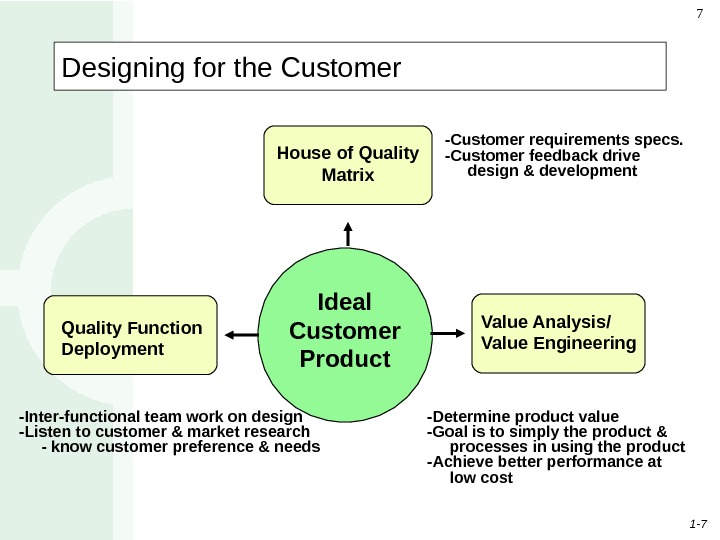
1 — 77 Designing for the Customer Quality Function Deployment Value Analysis/ Value Engineering. Ideal Customer Product House of Quality Matrix -Inter-functional team work on design -Listen to customer & market research — know customer preference & needs -Customer requirements specs. -Customer feedback drive design & development -Determine product value -Goal is to simply the product & processes in using the product -Achieve better performance at low cost
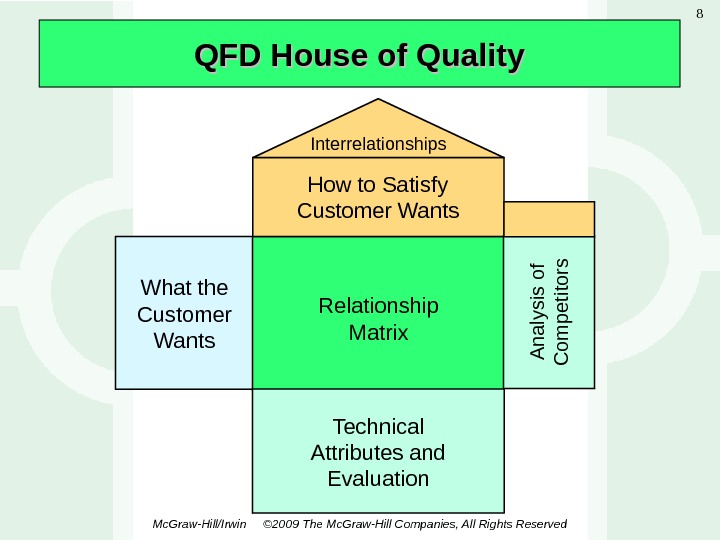
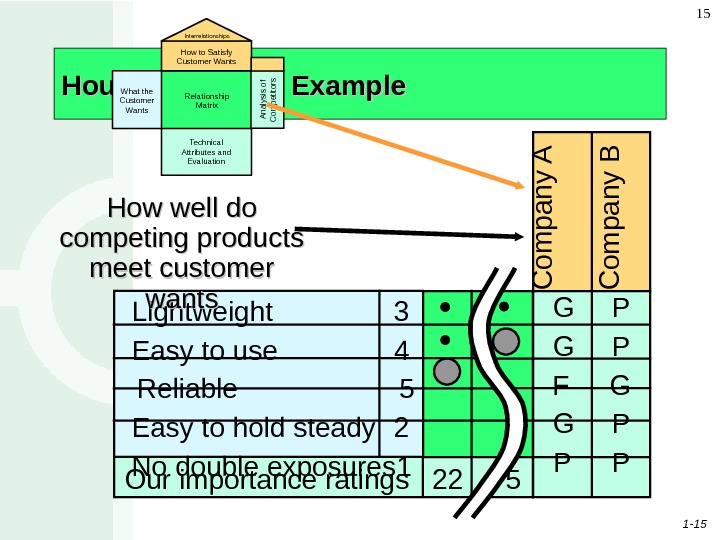
1 — 8 Mc. Graw-Hill/Irwin © 2009 The Mc. Graw-Hill Companies, All Rights Reserved 8 QFD House of Quality What the Customer Wants Relationship Matrix Technical Attributes and Evaluation. How to Satisfy Customer Wants Interrelationships. A n a ly sis o f C o m p e tito rs
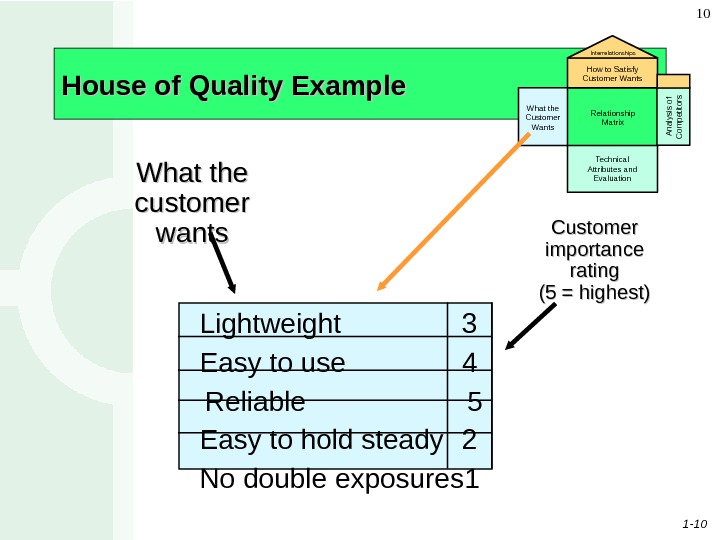
1 — 99 House of Quality Example Your team has been charged with designing a new camera for Great Cameras, Inc. The first action is to construct a House of Quality
1 — 10 10 House of Quality Example Customer importance rating (5 = highest) Lightweight 3 Easy to use 4 Reliable 5 Easy to hold steady 2 No double exposures 1 What the customer wants What the Customer Wants Relationship Matrix Technical Attributes and Evaluation. How to Satisfy Customer Wants Interrelationships. Analysis of Competitors
1 — 11 11 House of Quality Example What the Customer Wants Relationship Matrix Technical Attributes and Evaluation. How to Satisfy Customer Wants Interrelationships. Analysis of Competitors L o w e le c tric ity re q u ire m e n ts A lu m in u m c o m p o n e n ts A u to fo c u s A u to e x p o s u re A u to film a d v a n c e E rg o n o m ic d e s ig n How to Satisfy Customer Wants
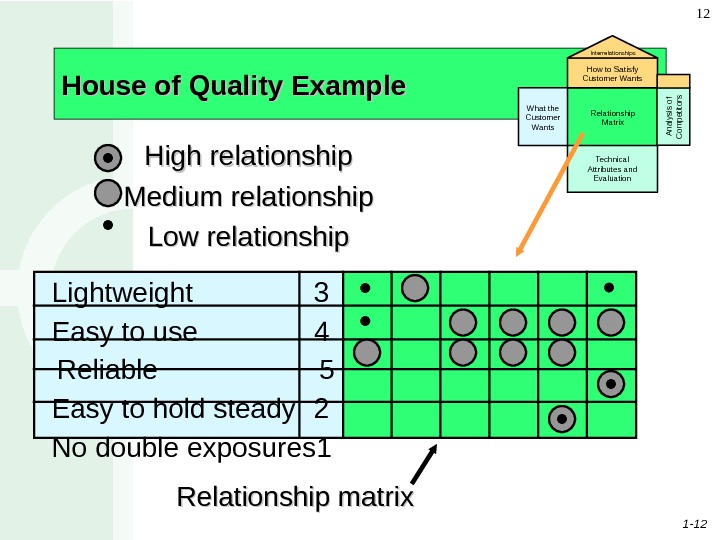
1 — 12 12 Lightweight 3 Easy to use 4 Reliable 5 Easy to hold steady 2 No double exposures 1 House of Quality Example What the Customer Wants Relationship Matrix Technical Attributes and Evaluation. How to Satisfy Customer Wants Interrelationships. Analysis of Competitors High relationship Medium relationship Low relationship Relationship matrix
1 — 13 13 House of Quality Example What the Customer Wants Relationship Matrix Technical Attributes and Evaluation. How to Satisfy Customer Wants Interrelationships. Analysis of Competitors L o w e le c tric ity re q u ire m e n ts A lu m in u m c o m p o n e n ts A u to fo c u s A u to e x p o s u re A u to film a d v a n c e E rg o n o m ic d e s ig n Relationships between the things we can dodo
1 — 14 14 House of Quality Example Weighted rating What the Customer Wants Relationship Matrix Technical Attributes and Evaluation. How to Satisfy Customer Wants Interrelationships. Analysis of Competitors Lightweight 3 Easy to use 4 Reliable 5 Easy to hold steady 2 No double exposures 1 Our importance ratings
1 — 15 15 House of Quality Example. C o m p a n y A C o m p a n y B G P F G G P P PLightweight 3 Easy to use 4 Reliable 5 Easy to hold steady 2 No double exposures 1 Our importance ratings 22 5 How well do competing products meet customer wants. What the Customer Wants Relationship Matrix Technical Attributes and Evaluation. How to Satisfy Customer Wants Interrelationships Analysis of Competitors
1 — 16 16 House of Quality Example What the Customer Wants Relationship Matrix Technical Attributes and Evaluation. How to Satisfy Customer Wants Interrelationships. Analysis of Competitors Technical attributes Technical evaluation Company A 0. 7 60% yes 1 ok G Company B 0. 6 50% yes 2 ok F Us 0. 5 75% yes 2 ok G 0. 5 A 7 5 % 2 ’ to ∞ 2 c irc u its F a ilu re 1 p e r 1 0 , 0 0 0 P a n e l ra n k in g
1 — 17 17 House of Quality Example Completed House of Quality
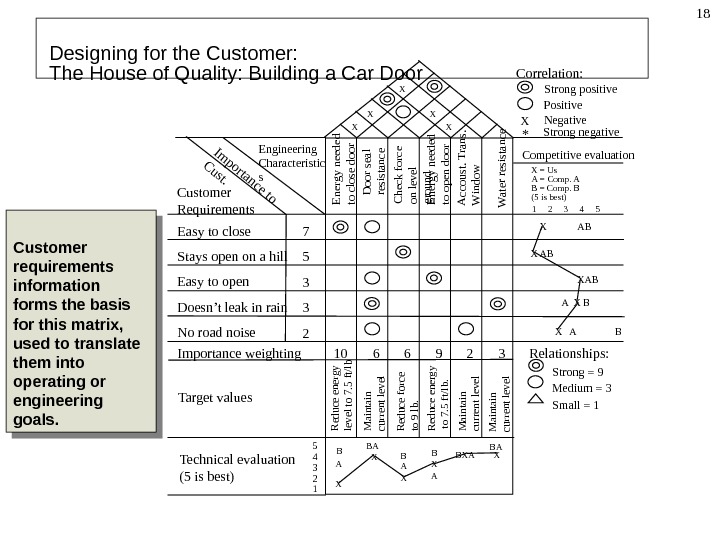
Designing for the Customer: The House of Quality: Building a Car Door Customer Requirements. Importance to Cust. Easy to close Stays open on a hill Easy to open Doesn ’t leak in rain No road noise Importance weighting Engineering Characteristic s Energy needed to close door Check force on level ground Energy needed to open door W ater resistance 10 6 6 9 2 37 5 3 3 2 X X X Correlation: Strong positive Positive Negative Strong negative. X * Competitive evaluation X = Us A = Comp. A B = Comp. B (5 is best) 1 2 3 4 5 X AB XAB A X B X A B Relationships: Strong = 9 Medium = 3 Small = 1 Target values Reduce energy level to 7. 5 ft/lb Reduce force to 9 lb. Reduce energy to 7. 5 ft/lb. Maintain current level Technical evaluation (5 is best) 5 4 3 2 1 B A X B X A BXA BA X Door seal resistance Accoust. Trans. W indow Maintain current level © The Mc. Graw-Hill Companies, Inc. , 2004 18 Customer requirements information forms the basis for this matrix, used to translate them into operating or engineering goals.
1 — 19 19 Product-by-Value Analysis Lists products in descending order of their individual dollar contribution to the firm Lists the total annual dollar contribution of the product Helps management evaluate alternative strategies
1 — 20 20 Product-by-Value Analysis Individual Contribution ($) Total Annual Contribution ($) Love Seat $102 $36, 720 Arm Chair $87 $51, 765 Foot Stool $12 $6, 240 Recliner $136 $51, 000 Sam. Sam ’s Furniture Factory
1 — 21 21 New Product Opportunities Brainstorming is a useful tool 1. 1. Understanding the customer 2. 2. Economic change 3. 3. Sociological and demographic change 4. 4. Technological change 5. 5. Political/legal change 6. 6. Market practice, professional standards, suppliers, distributors
1 — 22 22 Designing for the Customer: Value Analysis/Value Engineering Achieve equivalent or better performance at a lower cost while maintaining all functional requirements defined by the customer – Does the item have any design features that are not necessary? – Can two or more parts be combined into one? – How can we cut down the weight? – Are there nonstandard parts that can be eliminated?
1 — 23 23 Design for Manufacturability • Traditional Approach – “ We design it, you build it” or “Over the wall” • Concurrent Engineering – “ Let’s work together simultaneously”
1 — 24 24 Design for Manufacturing and Assembly Greatest improvements related to DFMA arise from simplification of the product by reducing the number of separate parts : 1. During the operation of the product, does the part move relative to all other parts already assembled? 2. Must the part be of a different material or be isolated from other parts already assembled? 3. Must the part be separate from all other parts to allow the disassembly of the product for adjustment or maintenance?
1 — 25 25 Designing Service Products Unlike manufacturing products, service products involves customer directly and can be complicated during its process, impacting both time and knowledge to serve customer Factors affecting service design: • Service Experience Fit : New service fit into currently provided services. E. g. Movie & Selling Pop-corns • Operational Fit : Collaborate with other operational skills in to service customer. E. g. Retail store & Home Delivery • Financial Fit : Is it financially justified ? May be necessary to retain customer.
1 — 26 26 Measuring Product Development Performance Measures • Freq. of new products introduced • Time to market introduction • Number stated and number completed • Actual versus plan • Percentage of sales from new products. Time-to-market Productivity Quality • Engineering hours per project • Cost of materials and tooling per project • Actual versus plan • Conformance-reliability in use • Design-performance and customer satisfaction • Yield-factory and field. Performance Dimension
1 — 27 27 End of Unit#