World Energy Market Optional Discipline Valentin K. Pospelov




8780-1st_subject_wem_2014.ppt
- Количество слайдов: 37
 World Energy Market Optional Discipline Valentin K. Pospelov Financial University under the Russian Government Moscow 2014
 Power Sector
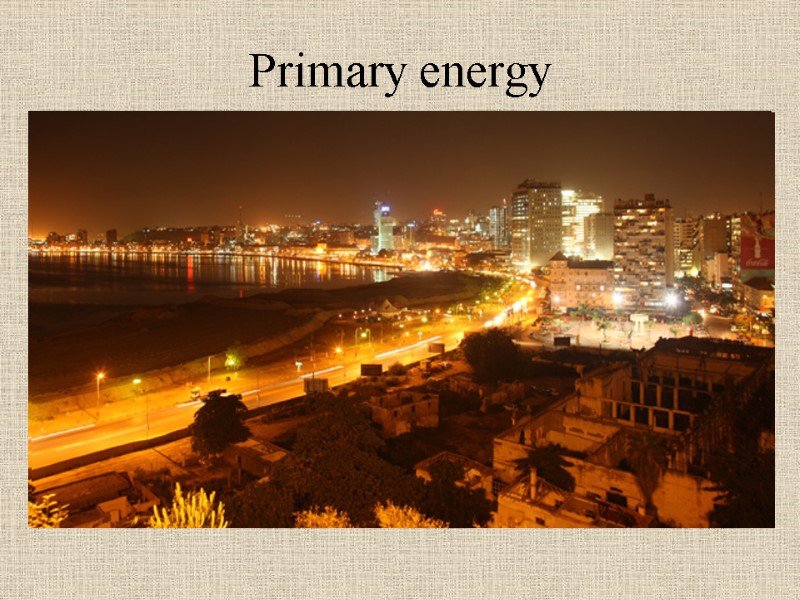
 Primary energy
 Subject 1 Main points: Why it is Important to Study the Developments in the World Energy Market The World Power Industry Resource base of the World Power Industry| General Trends in the World Power Industry Development Power sector
 Subject 1 Main points: Why it is Important to Study the Developments in the World Energy Market Power sector
 Our world runs on energy – it’s fundamental to our way of life and growing our economy Energy is essential for everything from fueling our cars to heating our homes to powering the appliances we depend on daily. But the world is changing An expanding population, economic growth, new technology development and changes in the nature and scope of regulations are all transforming the energy landscape We are becoming more energy-efficient and moving to cleaner fuels. At the same time, modern technology is developing new resources and making energy more affordable, all while creating new jobs and expanding trade around the world http://www.exxonmobil.com/Corporate/files/news_pub_eo.pdf
 It is Important to Study the Developments in the World Energy Market for a number of reasons 1.Energy is indispensable for socioeconomic development 2. Providing growing economies with energy is a global problem 3. The energy sector exerts substantial impact on global warming 4. World energy production and consumption distribution is highly inequitable 5. Export of energy resources is a major sources of foreign currency revenues
 Energy supply and demand is likely to represent the biggest challenge of the 21st century. More than any other issue, it is at the mercy of global economics, geopolitics, war, fiscal policy, and the battle between growth and sustainability. Beyond financial services, energy is probably the most global of industries and the industry with the broadest impact on others. All of these factors result in an uncertain and changeable future. http://www.ey.com/GL/en/Issues/Business-environment/Global-megatrends The rising economic importance of energy and commodities
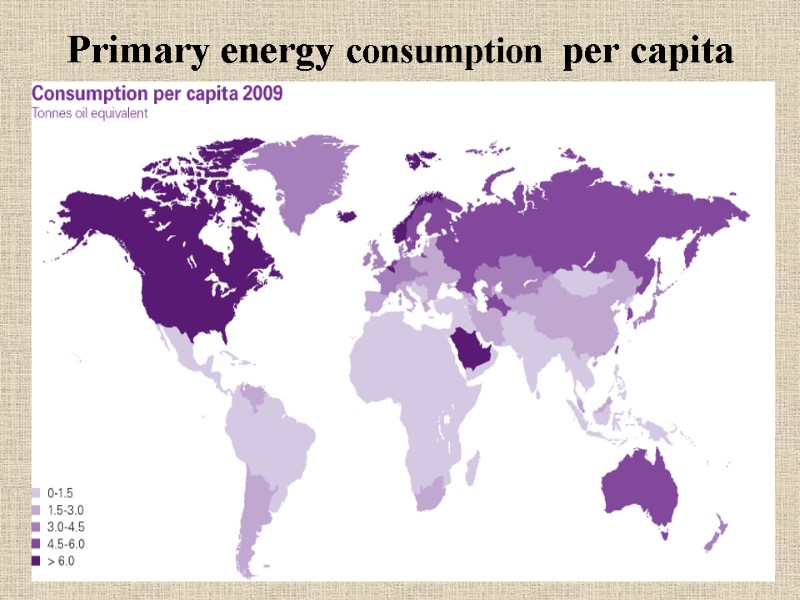
 Primary energy consumption per capita
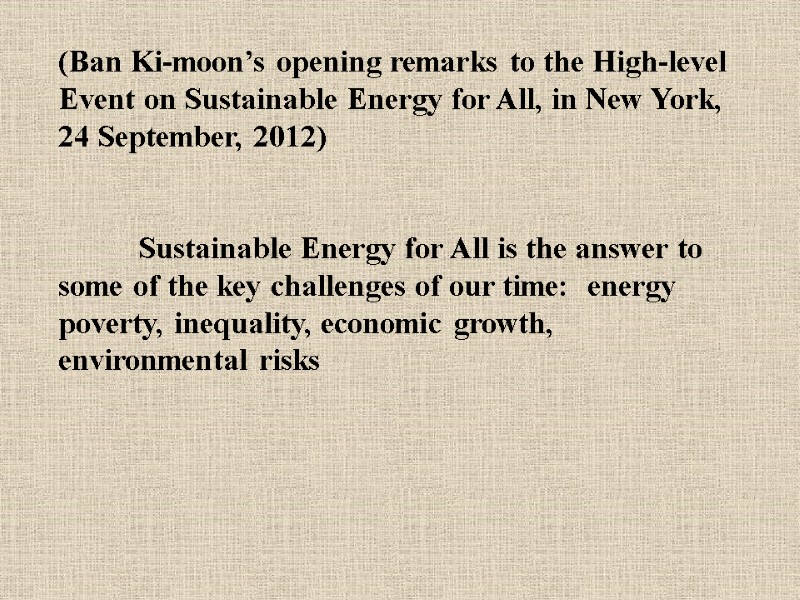
 (Ban Ki-moon’s opening remarks to the High-level Event on Sustainable Energy for All, in New York, 24 September, 2012) Sustainable Energy for All is the answer to some of the key challenges of our time: energy poverty, inequality, economic growth, environmental risks
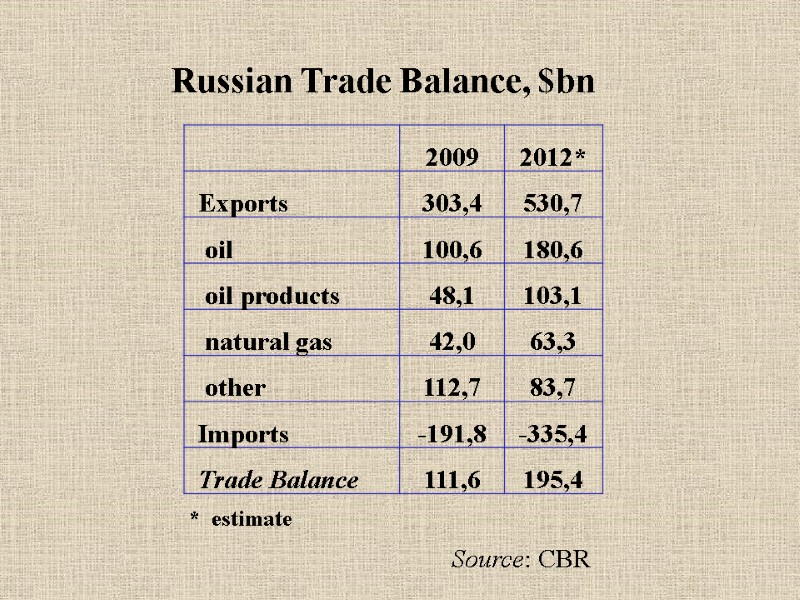
 Russian Trade Balance, $bn Source: CBR * estimate
 Subject 1 Main points: 2. The World Power Industry Power sector
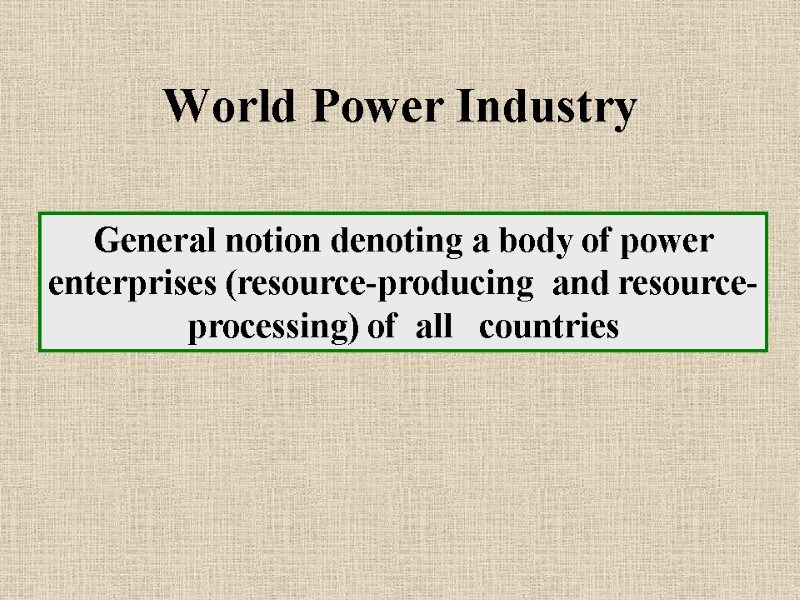
 World Power Industry General notion denoting a body of power enterprises (resource-producing and resource-processing) of all countries
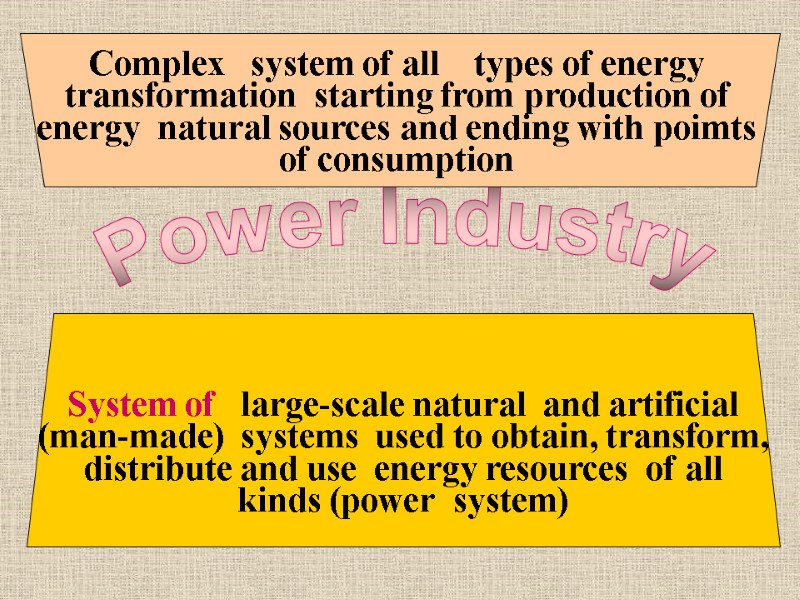
 Power Industry Complex system of all types of energy transformation starting from production of energy natural sources and ending with poimts of consumption System of large-scale natural and artificial (man-made) systems used to obtain, transform, distribute and use energy resources of all kinds (power system)
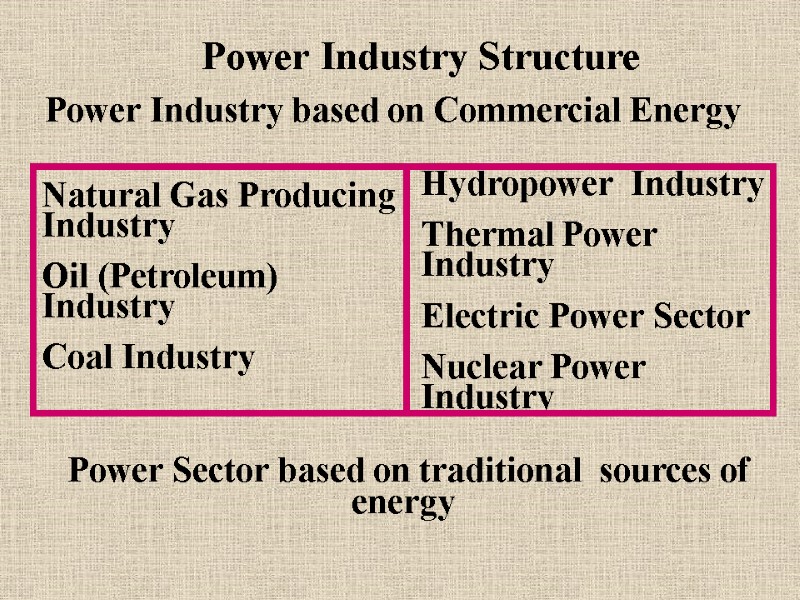
 Power Industry Structure Power Industry based on Commercial Energy Hydropower Industry Thermal Power Industry Electric Power Sector Nuclear Power Industry Natural Gas Producing Industry Oil (Petroleum) Industry Coal Industry Power Sector based on traditional sources of energy
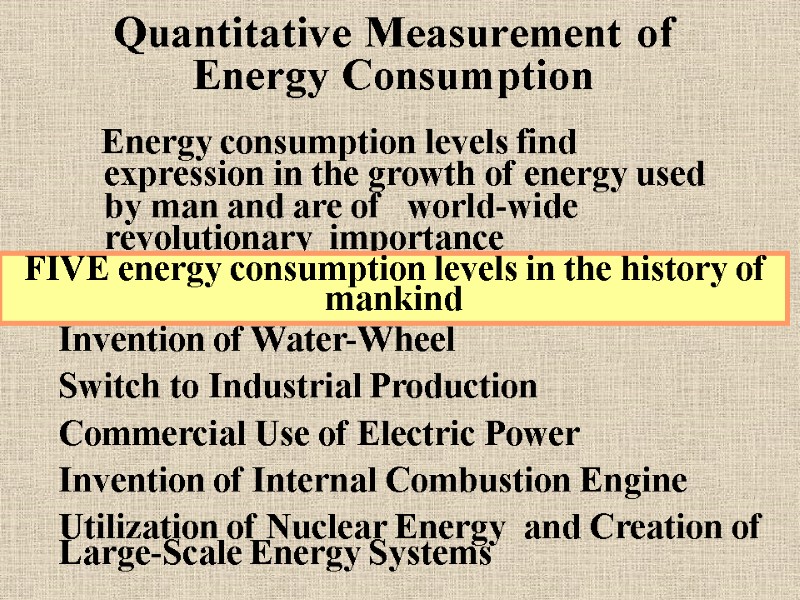
 Quantitative Measurement of Energy Consumption Energy consumption levels find expression in the growth of energy used by man and are of world-wide revolutionary importance FIVE energy consumption levels in the history of mankind Invention of Water-Wheel Switch to Industrial Production Commercial Use of Electric Power Invention of Internal Combustion Engine Utilization of Nuclear Energy and Creation of Large-Scale Energy Systems
 Subject 1 Main points: 3. Resource base of the World Power Industry| Power sector
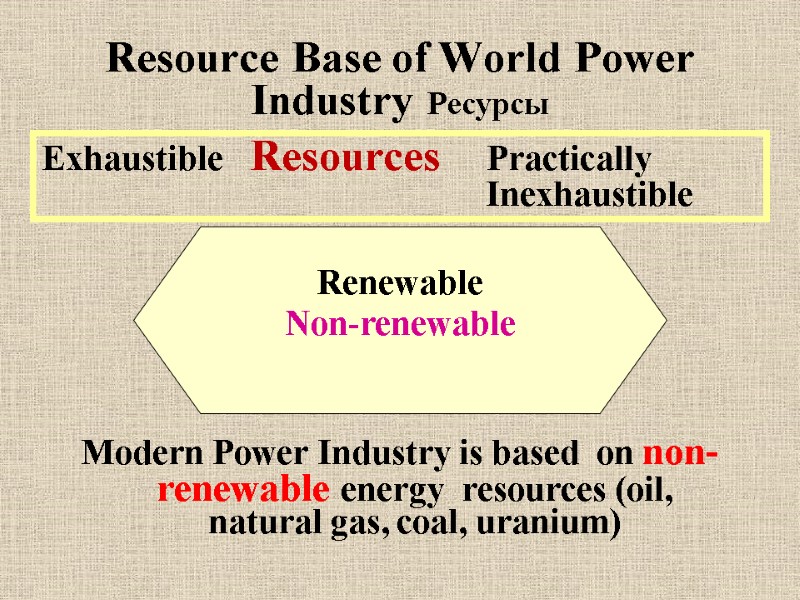
 Resource Base of World Power Industry Ресурсы Modern Power Industry is based on non-renewable energy resources (oil, natural gas, coal, uranium) Renewable Non-renewable Exhaustible Resources Practically Inexhaustible
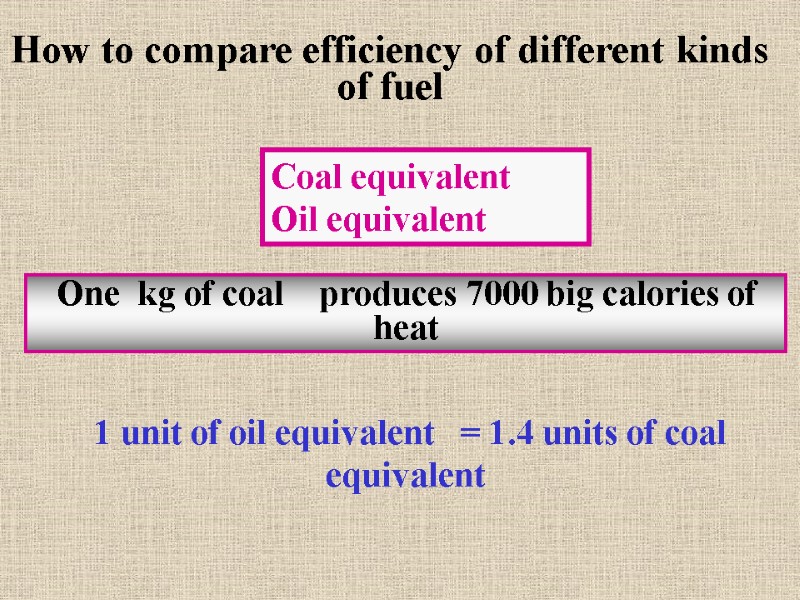
 One kg of coal produces 7000 big calories of heat How to compare efficiency of different kinds of fuel Coal equivalent Oil equivalent 1 unit of oil equivalent = 1.4 units of coal equivalent
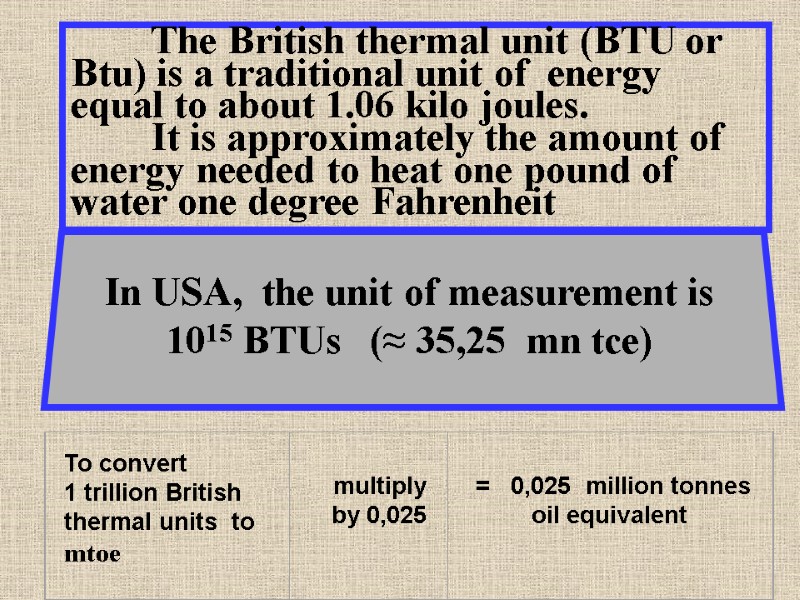
 The British thermal unit (BTU or Btu) is a traditional unit of energy equal to about 1.06 kilo joules. It is approximately the amount of energy needed to heat one pound of water one degree Fahrenheit In USA, the unit of measurement is 1015 BTUs (≈ 35,25 mn tce)
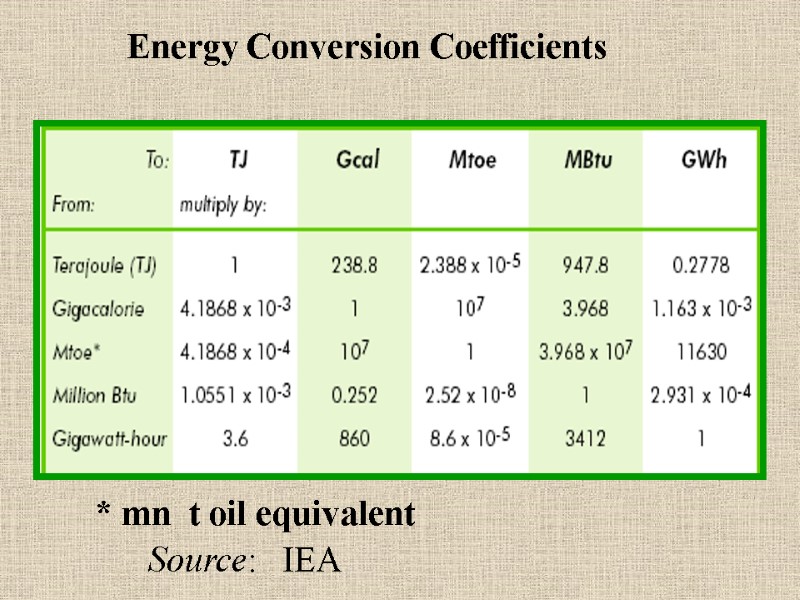
 Energy Conversion Coefficients * mn t oil equivalent Source: IEA
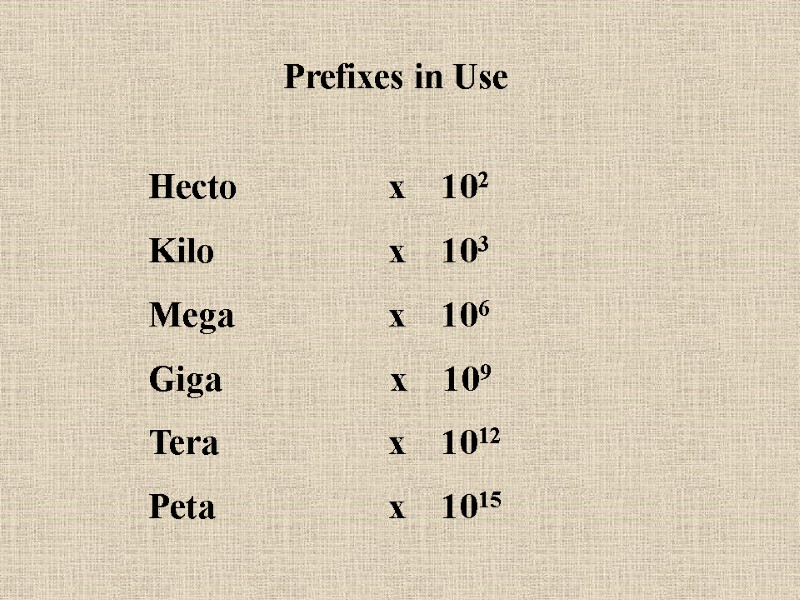
 Prefixes in Use Hecto x 102 Kilo x 103 Mega x 106 Giga x 109 Tera x 1012 Peta x 1015
 Subject 1 Main points: 4. General Trends in the World Power Industry Development Power sector
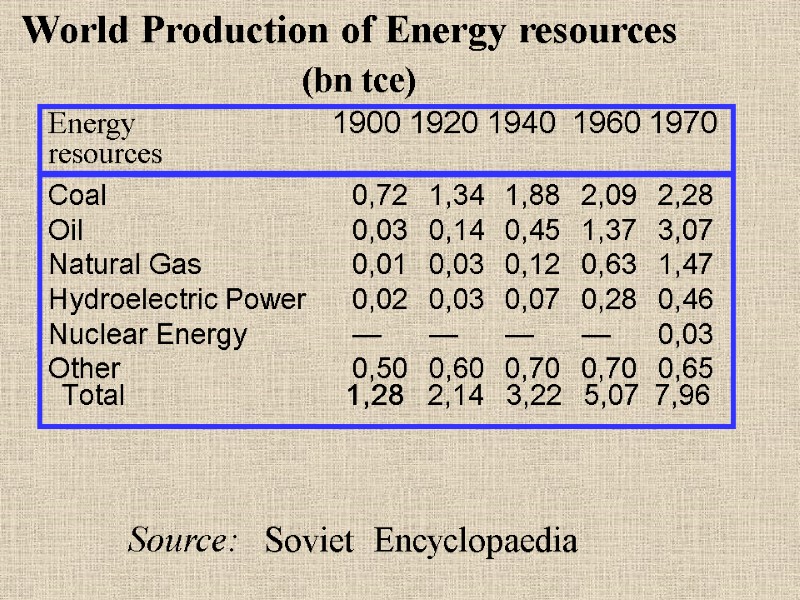
 Coal 0,72 1,34 1,88 2,09 2,28 Oil 0,03 0,14 0,45 1,37 3,07 Natural Gas 0,01 0,03 0,12 0,63 1,47 Hydroelectric Power 0,02 0,03 0,07 0,28 0,46 Nuclear Energy — — — — 0,03 Other 0,50 0,60 0,70 0,70 0,65 Energy 1900 1920 1940 1960 1970 resources Source: Soviet Encyclopaedia World Production of Energy resources (bn tce) Total 1,28 2,14 3,22 5,07 7,96
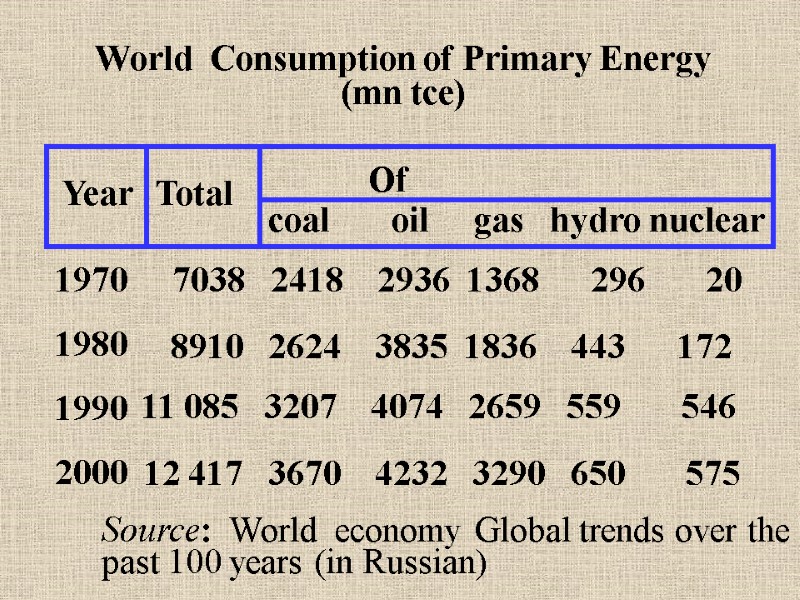
 World Consumption of Primary Energy (mn tce) Year Total Of coal oil gas hydro nuclear 1970 1980 1990 2000 7038 2418 2936 1368 296 20 8910 2624 3835 1836 443 172 11 085 3207 4074 2659 559 546 12 417 3670 4232 3290 650 575 Source: World economy Global trends over the past 100 years (in Russian)
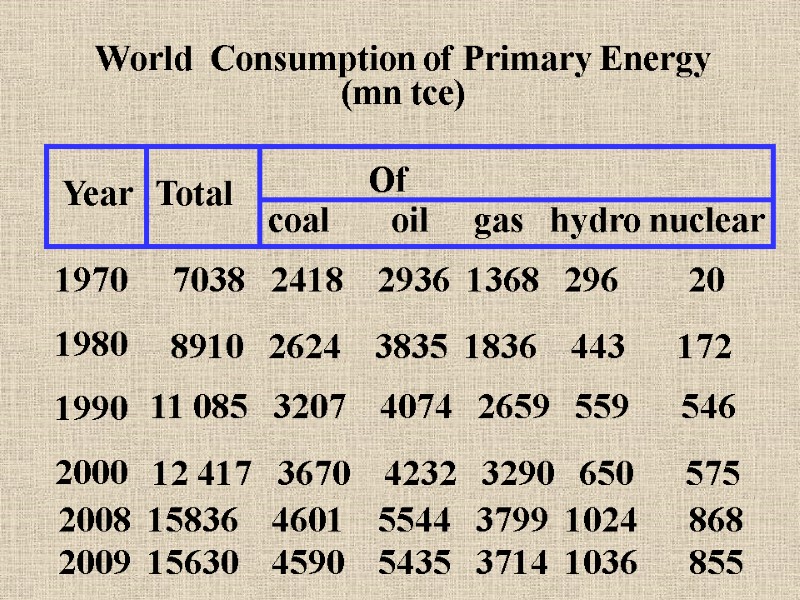
 World Consumption of Primary Energy (mn tce) Year Total Of coal oil gas hydro nuclear 1970 1980 1990 2000 7038 2418 2936 1368 296 20 8910 2624 3835 1836 443 172 11 085 3207 4074 2659 559 546 12 417 3670 4232 3290 650 575 2008 15836 4601 5544 3799 1024 868 2009 15630 4590 5435 3714 1036 855
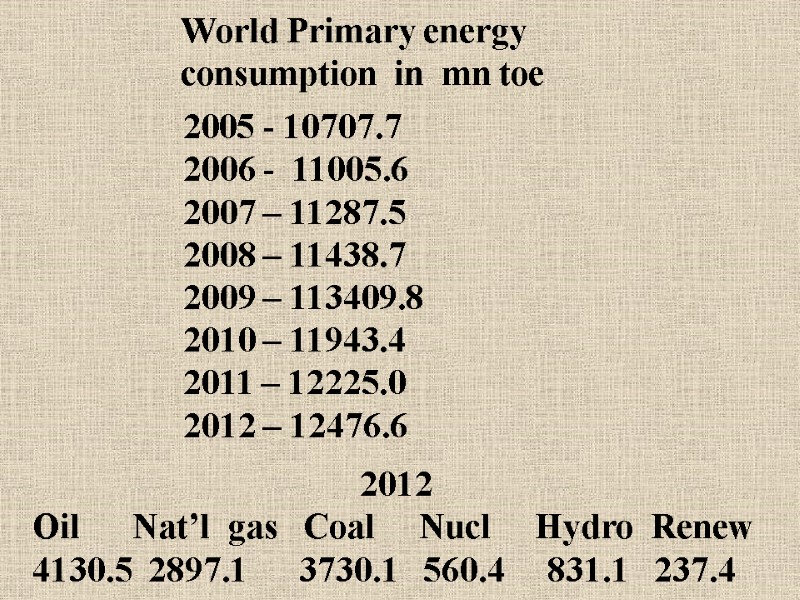
 - 10707.7 2006 - 11005.6 2007 – 11287.5 2008 – 11438.7 2009 – 113409.8 2010 – 11943.4 2011 – 12225.0 2012 – 12476.6 World Primary energy consumption in mn toe 2012 Oil Nat’l gas Coal Nucl Hydro Renew 4130.5 2897.1 3730.1 560.4 831.1 237.4
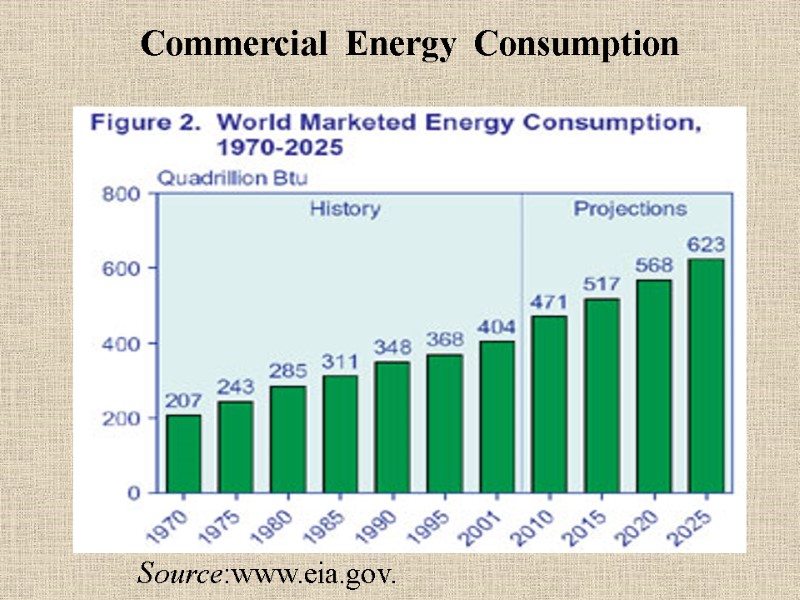
 Commercial Energy Consumption Source:www.eia.gov.
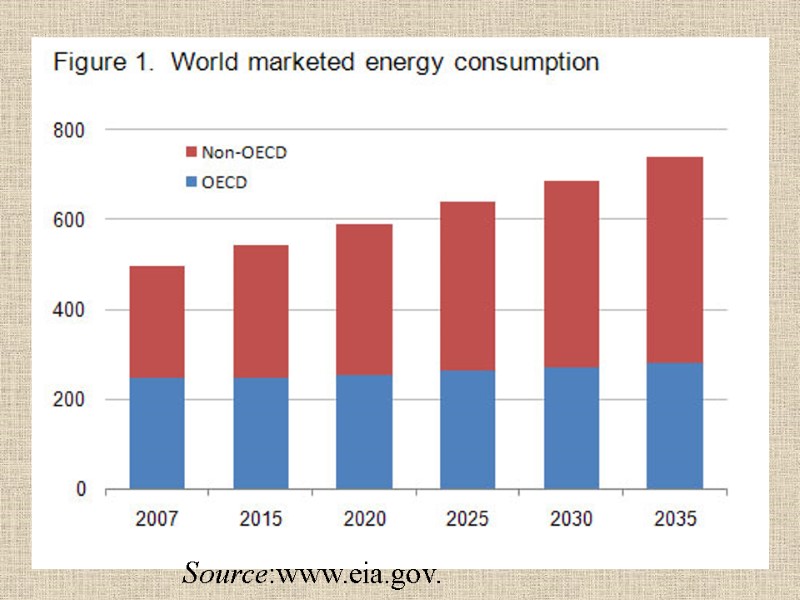
 Source:www.eia.gov.
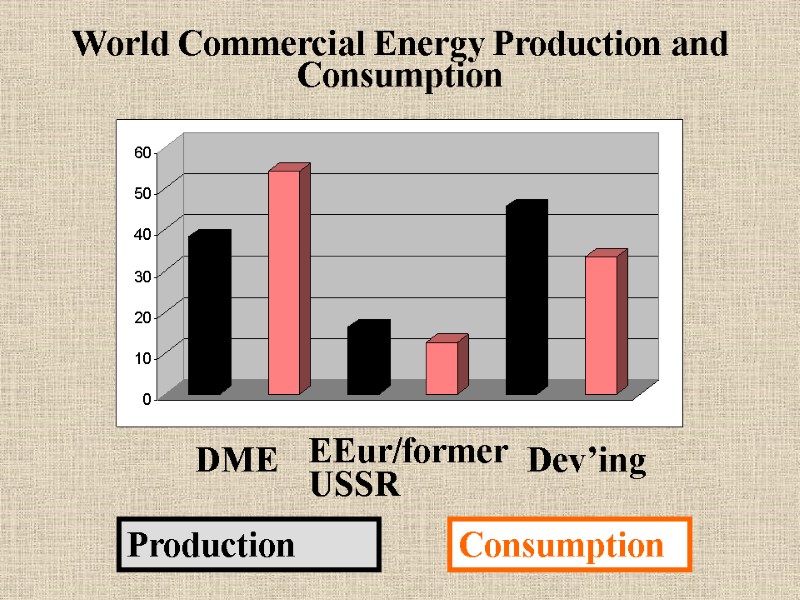
 DME EEur/former USSR Dev’ing World Commercial Energy Production and Consumption Production Consumption
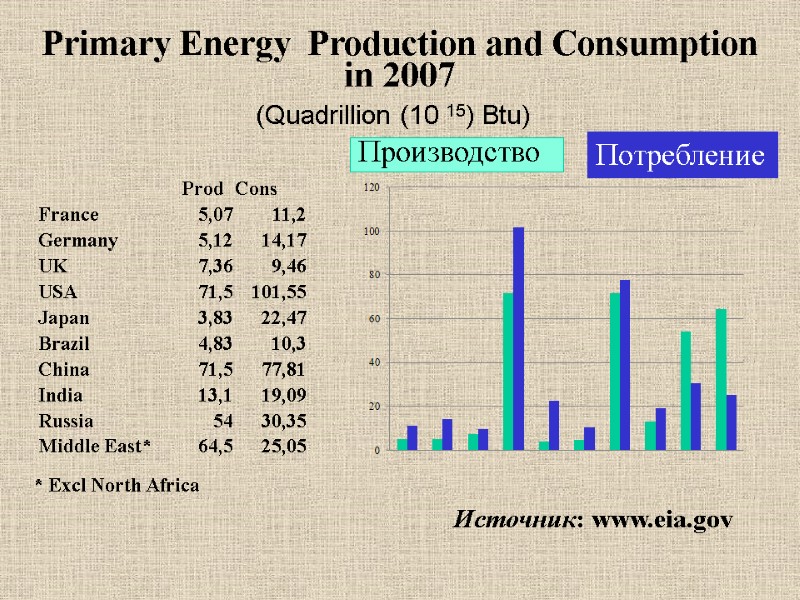
 Primary Energy Production and Consumption in 2007 (Quadrillion (10 15) Btu) Источник: www.eia.gov Производство Потребление * Excl North Africa
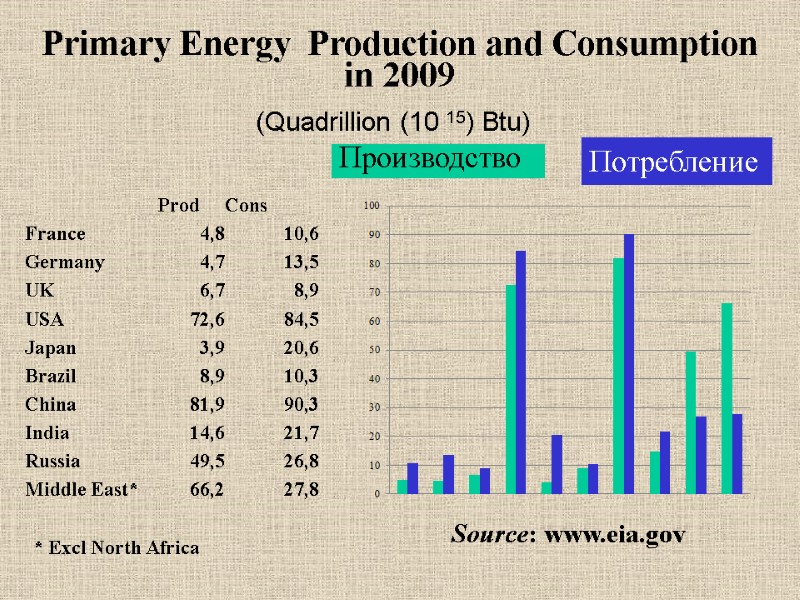
 Primary Energy Production and Consumption in 2009 (Quadrillion (10 15) Btu) * Excl North Africa Производство Потребление Source: www.eia.gov
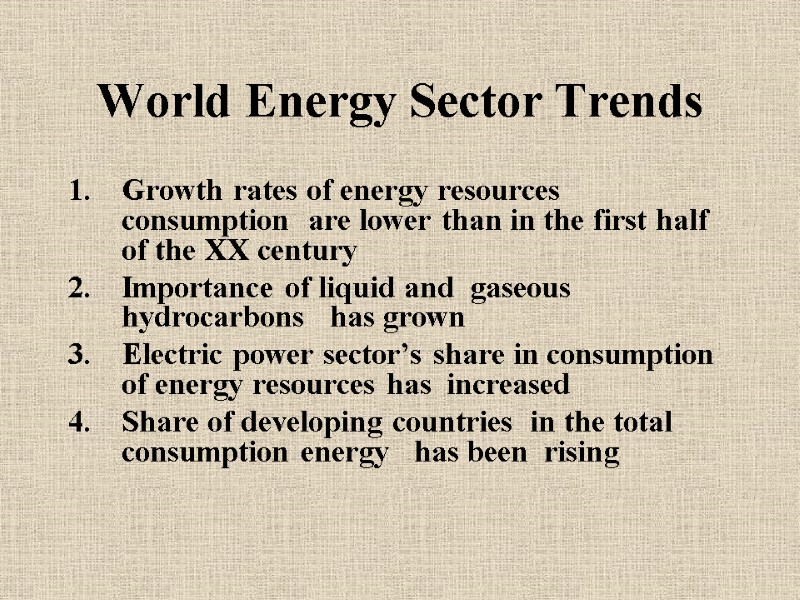
 World Energy Sector Trends Growth rates of energy resources consumption are lower than in the first half of the XX century Importance of liquid and gaseous hydrocarbons has grown Electric power sector’s share in consumption of energy resources has increased Share of developing countries in the total consumption energy has been rising
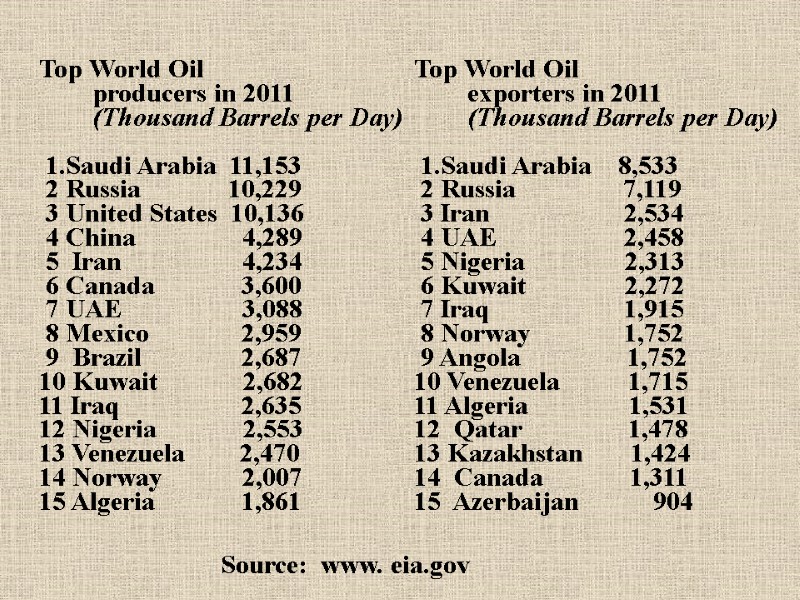
 Top World Oil producers in 2011 (Thousand Barrels per Day) 1.Saudi Arabia 11,153 2 Russia 10,229 3 United States 10,136 4 China 4,289 5 Iran 4,234 6 Canada 3,600 7 UAE 3,088 8 Mexico 2,959 9 Brazil 2,687 10 Kuwait 2,682 11 Iraq 2,635 12 Nigeria 2,553 13 Venezuela 2,470 14 Norway 2,007 15 Algeria 1,861 Top World Oil exporters in 2011 (Thousand Barrels per Day) 1.Saudi Arabia 8,533 2 Russia 7,119 3 Iran 2,534 4 UAE 2,458 5 Nigeria 2,313 6 Kuwait 2,272 7 Iraq 1,915 8 Norway 1,752 9 Angola 1,752 10 Venezuela 1,715 11 Algeria 1,531 12 Qatar 1,478 13 Kazakhstan 1,424 14 Canada 1,311 15 Azerbaijan 904 Source: www. eia.gov
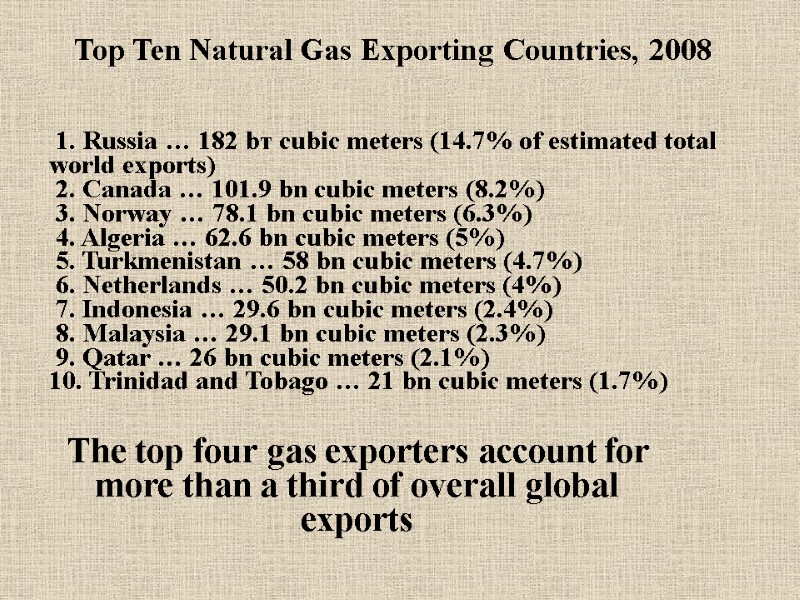
 1. Russia … 182 bт cubic meters (14.7% of estimated total world exports) 2. Canada … 101.9 bn cubic meters (8.2%) 3. Norway … 78.1 bn cubic meters (6.3%) 4. Algeria … 62.6 bn cubic meters (5%) 5. Turkmenistan … 58 bn cubic meters (4.7%) 6. Netherlands … 50.2 bn cubic meters (4%) 7. Indonesia … 29.6 bn cubic meters (2.4%) 8. Malaysia … 29.1 bn cubic meters (2.3%) 9. Qatar … 26 bn cubic meters (2.1%) 10. Trinidad and Tobago … 21 bn cubic meters (1.7%) Top Ten Natural Gas Exporting Countries, 2008 The top four gas exporters account for more than a third of overall global exports
 Home assignment Open my e-mail [email protected] Pass: 19431943v Assignments are attached to email.
 Thank you for attention!
