
WIUU BF-2 , Fall 2013, © A.


- Размер: 677 Кб
- Количество слайдов: 59
Описание презентации WIUU BF-2 , Fall 2013, © A. по слайдам
WIUU BF-2 , Fall 2013, © A. Zaporozhetz 1 Class Capital budgeting Methods (techniques): PBP, DPBP , IRR , NPV , PI. Initial cash outlay (ICO), Free Cash Flow (FCF). Capital rationing. RWJ: Ch. 6, 7, ( 8 optional)
WIUU BF-2 , Fall 2013, © A. Zaporozhetz 2 What is Capital Budgeting (CB)? The process of identifying, analyzing, and selecting investment projects whose cash flows are expected to extend beyond one year. CB is NOT the same as Budgeting (=preparing annual financial plans and proforma statements for a business company)
WIUU BF-2 , Fall 2013, © A. Zaporozhetz 3 The Capital Budgeting Process • Generate investment proposals consistent with the firm’s strategic objectives. • Estimate after-tax cash flows for the investment projects. • Evaluate project cash flows. • NB: CF, FCF – no unified methodology
WIUU BF-2 , Fall 2013, © A. Zaporozhetz 4 The Capital Budgeting Process • Select projects based on a value-maximizing acceptance criterion. • Reevaluate implemented investment projects continually and perform post-audits for completed projects.
WIUU BF-2 , Fall 2013, © A. Zaporozhetz 5 Investment Project Proposals 1. New products or product modifications 2. Replacement of existing equipment or buildings 3. Real estate: hotels, etc 4. R&D 5. Exploration 6. Other (e. g. , safety- or pollution-related)
WIUU BF-2 , Fall 2013, © A. Zaporozhetz 6 Estimating After-Tax Incremental Cash Flows Cash (not accounting income) flowsflows Excluding financing costs After-tax flows Incremental flows. Basic characteristics of relevant project flows
WIUU BF-2 , Fall 2013, © A. Zaporozhetz 7 Estimating After-Tax Incremental Cash Flows Ignore sunk costs Include project-driven changes in working capital Include effects of inflation. Principles that must be adhered to in the estimation
WIUU BF-2 , Fall 2013, © A. Zaporozhetz 8 Calculating the Incremental Cash Flows • Initial cash outflow — the initial net cash investment. • Interim incremental net cash flows — those net cash flows occurring after the initial cash investment but not including the final period’s cash flow. • Terminal-year incremental net cash flows — the final period’s net cash flow.
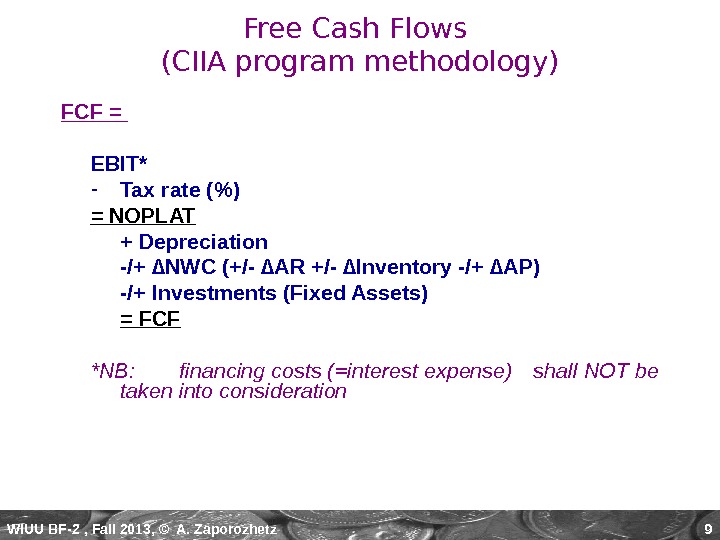
WIUU BF-2 , Fall 2013, © A. Zaporozhetz 9 FCF = EBIT* — Tax rate (%) = NOPLAT + Depreciation -/+ ∆ NWC (+/- ∆AR +/- ∆Inventory -/+ ∆AP) -/+ Investments (Fixed Assets) = FCF *NB: financing costs (=interest expense) shall NOT be taken into consideration Free Cash Flows (CIIA program methodology)
WIUU BF-2 , Fall 2013, © A. Zaporozhetz 10 Initial Cash Outflow, ICO a) Cost of “new” assets b) + Capitalized expenditures c) + (-) Increased (decreased) NWC d) — Net proceeds from sale of “old” asset(s) if replacement e) + (-) Taxes (savings) due to the sale of “old” asset(s) if replacement f) == Initial cash outflow
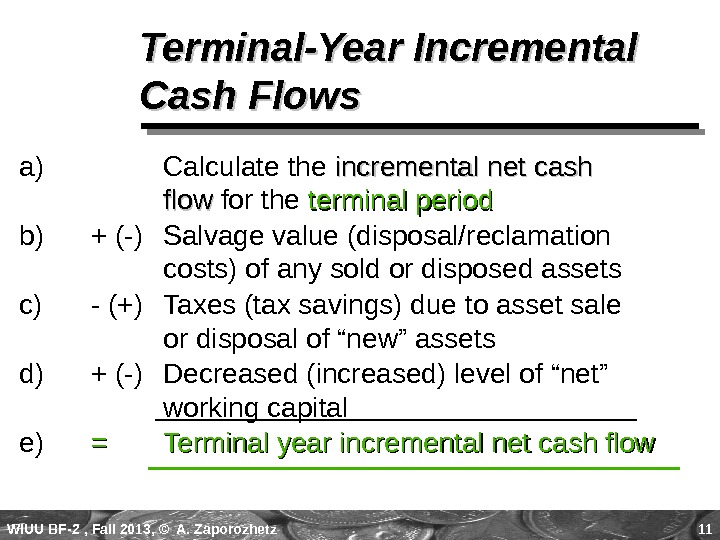
WIUU BF-2 , Fall 2013, © A. Zaporozhetz 11 Terminal-Year Incremental Cash Flows a) Calculate the incremental net cash flow for the terminal period b) + (-) Salvage value (disposal/reclamation costs) of any sold or disposed assets c) — (+) Taxes (tax savings) due to asset sale or disposal of “new” assets d) + (-) Decreased (increased) level of “net” working capital e) == Terminal year incremental net cash flow
WIUU BF-2 , Fall 2013, © A. Zaporozhetz 12 Project Evaluation: Alternative Methods Payback Period (PBP) Discounted PBP (DPBP) Internal Rate of Return (IRR) Net Present Value (NPV) – most popular ($) Profitability Index (PI) Other methods: ARR, MIRR, EAC…
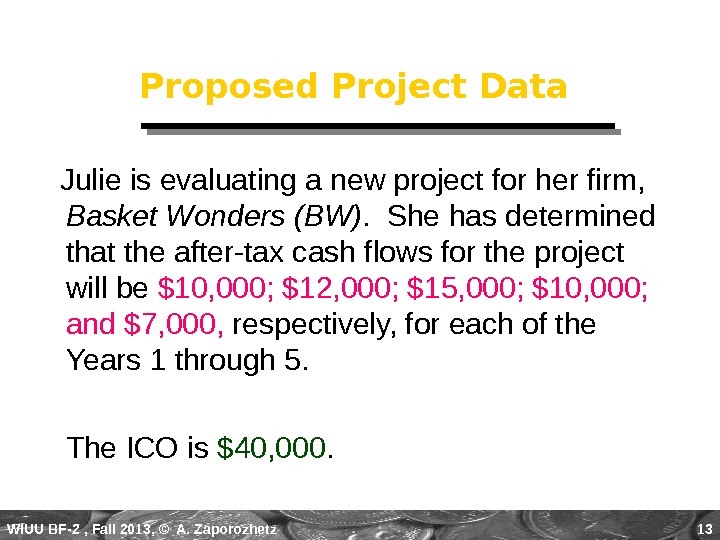
WIUU BF-2 , Fall 2013, © A. Zaporozhetz 13 Proposed Project Data Julie is evaluating a new project for her firm, Basket Wonders (BW). She has determined that the after-tax cash flows for the project will be $10, 000; $12, 000; $15, 000; $10, 000; and $7, 000, respectively, for each of the Years 1 through 5. The ICO is $40, 000.
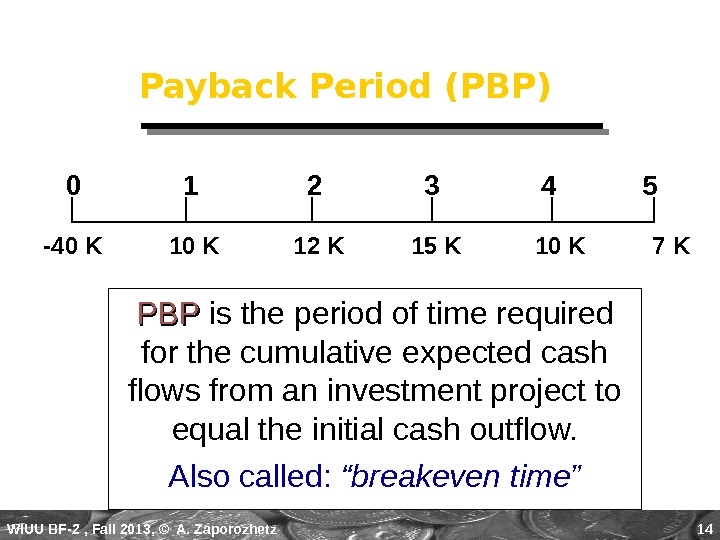
WIUU BF-2 , Fall 2013, © A. Zaporozhetz 14 Payback Period (PBP) PBPPBP is the period of time required for the cumulative expected cash flows from an investment project to equal the initial cash outflow. Also called: “breakeven time” 0 1 2 3 4 5 -40 K 10 K 12 K 15 K 10 K 7 K
WIUU BF-2 , Fall 2013, © A. Zaporozhetz 15(c) 10 K 22 K 37 K 47 K 54 KPayback Solution (#1) PBPPBP = a + ( b — c ) / d = 3 + (40 — 37) / 10 = 3 + (3 / 10) = 3. 30 Years 0 1 2 3 4 5 -40 K 12 K 15 K 10 K 7 K Cumulative Inflows (a) (-b) (d)
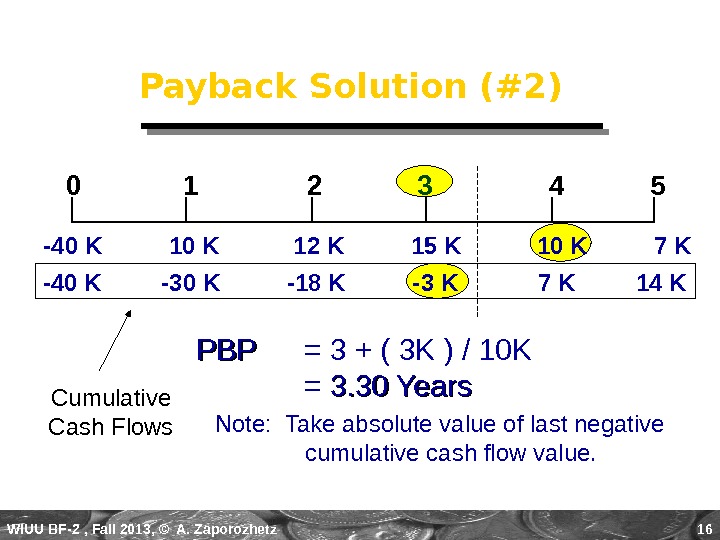
WIUU BF-2 , Fall 2013, © A. Zaporozhetz 16 Payback Solution (#2) PBPPBP = 3 + ( 3 K ) / 10 K = 3. 30 Years Note: Take absolute value of last negative cumulative cash flow value. Cumulative Cash Flows -40 K 10 K 12 K 15 K 10 K 7 K 0 1 2 3 4 5 -40 K -30 K -18 K -3 K 7 K 14 K
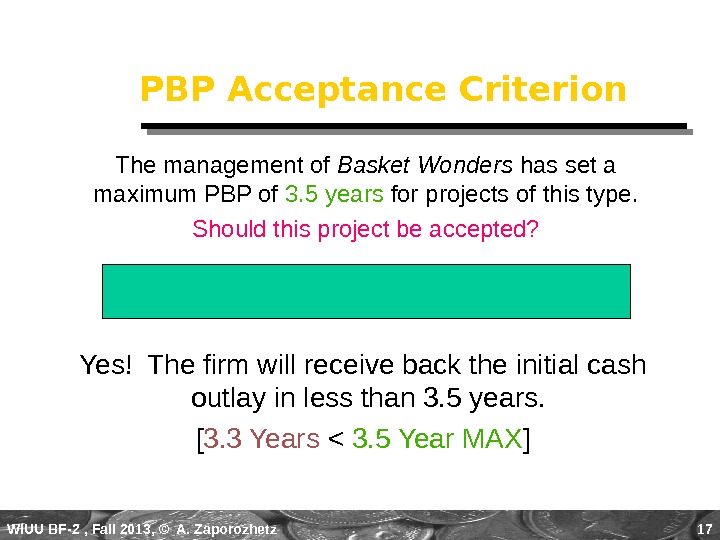
WIUU BF-2 , Fall 2013, © A. Zaporozhetz 17 PBP Acceptance Criterion Yes! The firm will receive back the initial cash outlay in less than 3. 5 years. [ 3. 3 Years < 3. 5 Year MAX ]The management of Basket Wonders has set a maximum PBP of 3. 5 years for projects of this type. Should this project be accepted?
WIUU BF-2 , Fall 2013, © A. Zaporozhetz 18 The PBP Method Strengths and Weaknesses Strengths : : Easy to use and understand Can be used as a measure of liquidity Easier to forecast short- term than long-term flows Weaknesses : : Does not account for TVM Does not consider cash flows after the PBP Cutoff period is often subjective/disputable Does not show absolute $$
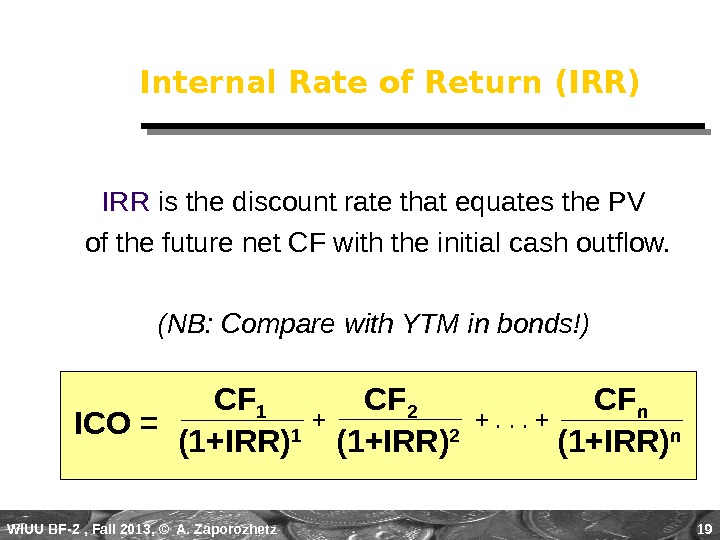
WIUU BF-2 , Fall 2013, © A. Zaporozhetz 19 Internal Rate of Return (IRR) IRR is the discount rate that equates the PV of the future net CF with the initial cash outflow. (NB: Compare with YTM in bonds!) CF 1 CF 2 CF n (1+IRR) 1 (1+IRR) 2 (1+IRR) n+. . . ++ ICO =
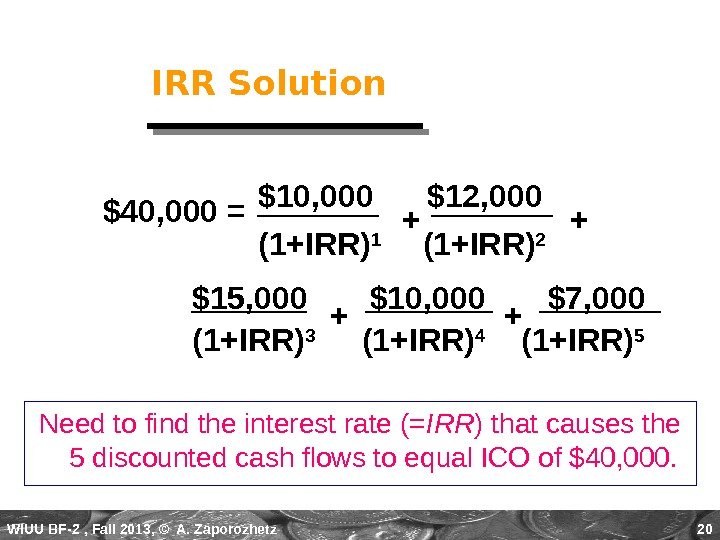
WIUU BF-2 , Fall 2013, © A. Zaporozhetz 20$15, 000 $10, 000 $7, 000 IRR Solution $10, 000 $12, 000 (1+IRR) 1 (1+IRR) 2 Need to find the interest rate (= IRR ) that causes the 5 discounted cash flows to equal ICO of $40, 000. + + ++$40, 000 = (1+IRR) 3 (1+IRR) 4 (1+IRR)
WIUU BF-2 , Fall 2013, © A. Zaporozhetz 21 IRR Solution (Try 10%) $40, 000 = $10, 000(PVIF 10%, 1 ) + $12, 000(PVIF 10%, 2 ) + $15, 000(PVIF 10%, 3 ) + $10, 000(PVIF 10%, 4 ) + $ 7, 000(PVIF 10%, 5 ) $40, 000 = $10, 000(. 909) + $12, 000(. 826) + $15, 000(. 751) + $10, 000(. 683) + $ 7, 000(. 621) $40, 000 = $9, 090 + $9, 912 + $11, 265 + $6, 830 + $4, 347 = $41, 444 [[ Rate is too low ]]
WIUU BF-2 , Fall 2013, © A. Zaporozhetz 22 IRR Solution (Try 15%) $40, 000 = $10, 000(PVIF 15%, 1 ) + $12, 000(PVIF 15%, 2 ) + $15, 000(PVIF 15%, 3 ) + $10, 000(PVIF 15%, 4 ) + $ 7, 000(PVIF 15%, 5 ) $40, 000 = $10, 000(. 870) + $12, 000(. 756) + $15, 000(. 658) + $10, 000(. 572) + $ 7, 000(. 497) $40, 000 = $8, 700 + $9, 072 + $9, 870 + $5, 720 + $3, 479 = $36, 841 [[ Rate is too high ]]
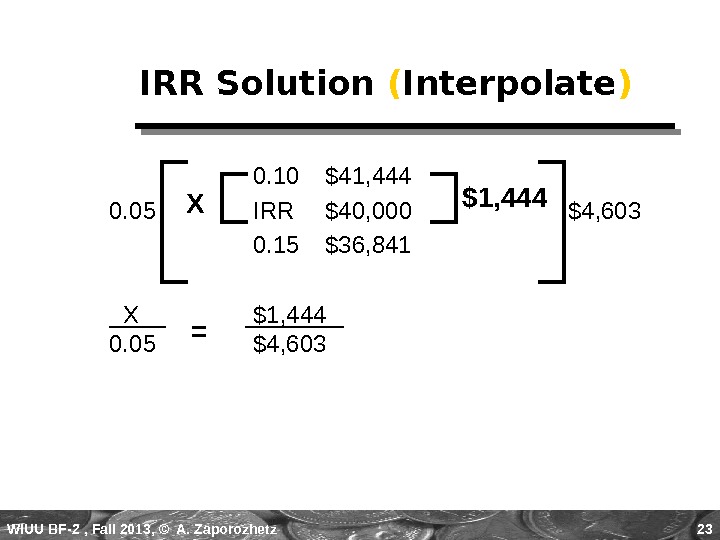
WIUU BF-2 , Fall 2013, © A. Zaporozhetz 230. 10 $41, 444 0. 05 IRR $40, 000 $4, 603 0. 15 $36, 841 X $1, 444 0. 05 $4, 603 IRR Solution ( Interpolate ) $1, 444 X =
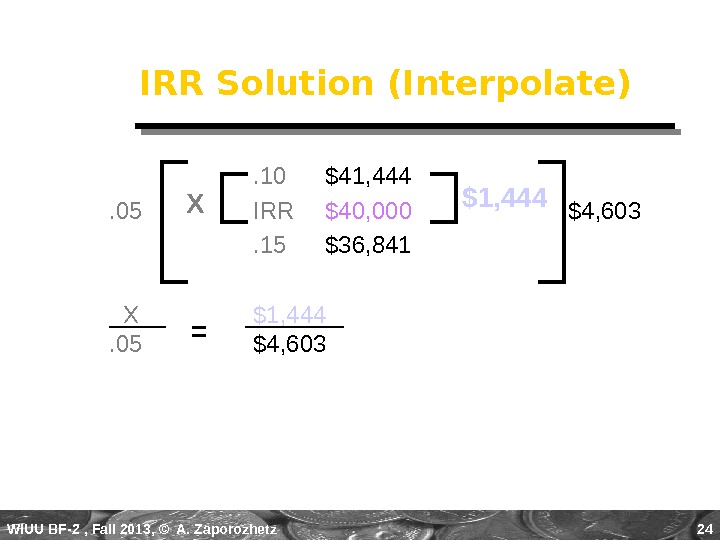
WIUU BF-2 , Fall 2013, © A. Zaporozhetz 24. 10 $41, 444. 05 IRR $40, 000 $4, 603. 15 $36, 841 X $1, 444. 05 $4, 603 IRR Solution (Interpolate) $1, 444 X =
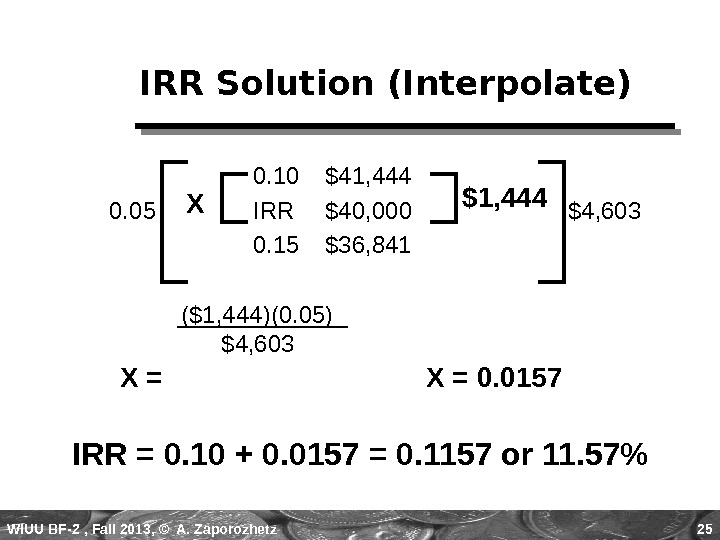
WIUU BF-2 , Fall 2013, © A. Zaporozhetz 250. 10 $41, 444 0. 05 IRR $40, 000 $4, 603 0. 15 $36, 841 ($1, 444)(0. 05) $4, 603 IRR Solution (Interpolate) $1, 444 X X = 0. 0157 IRR = 0. 10 + 0. 0157 = 0. 1157 or 11. 57%
WIUU BF-2 , Fall 2013, © A. Zaporozhetz 26 IRR Acceptance Criterion No! The firm will “receive” 11. 57% for each dollar “required” for this project at a cost of 13%. [ IRR < RRR, “Hurdle Rate” ] The management of Basket Wonders has determined that the hurdle rate is 13% for projects of this type. Should this project be accepted?
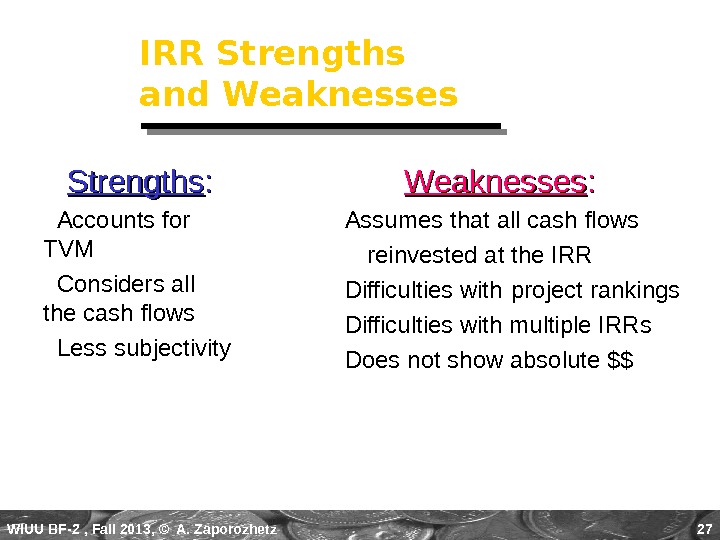
WIUU BF-2 , Fall 2013, © A. Zaporozhetz 27 IRR Strengths and Weaknesses Strengths : : Accounts for TVM Considers all the cash flows Less subjectivity Weaknesses : : Assumes that all cash flows reinvested at the IRR Difficulties with project rankings Difficulties with multiple IRRs Does not show absolute $$
WIUU BF-2 , Fall 2013, © A. Zaporozhetz 28 Net Present Value (NPV) NPV is the present value of an investment project’s net DCFs minus the project’s initial cash outflow. CF 1 CF 2 CF n (1+ k ) 1 (1+ k ) 2 (1+ k ) n+. . . ++ — ICOICO NPV =
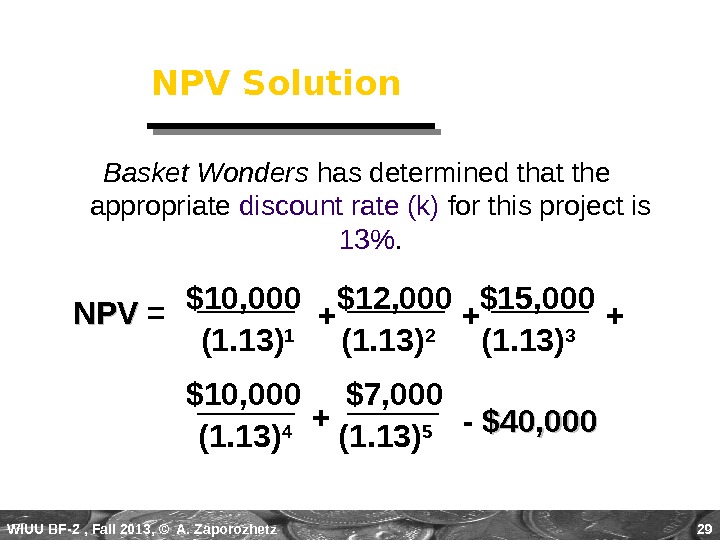
WIUU BF-2 , Fall 2013, © A. Zaporozhetz 29 Basket Wonders has determined that the appropriate discount rate (k) for this project is 13%. $10, 000 $7, 000 NPV Solution $10, 000 $12, 000 $15, 000 (1. 13) 1 (1. 13) 2 (1. 13) 3 + + + — $40, 000 (1. 13) 4 (1. 13) 5 NPVNPV = +
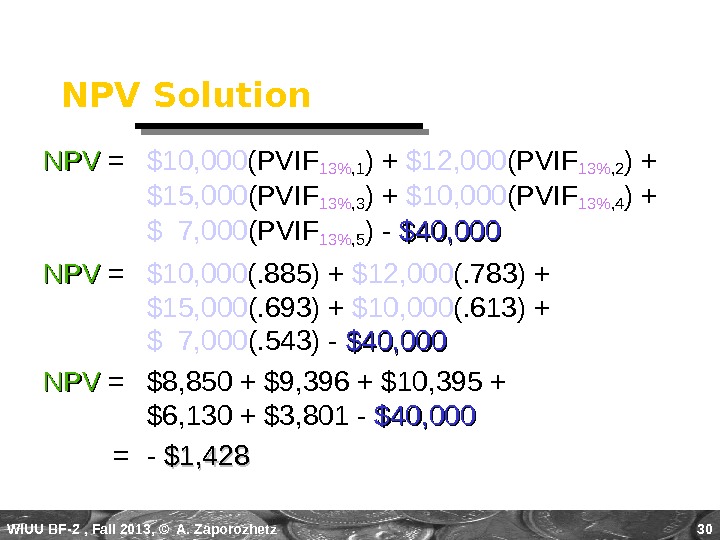
WIUU BF-2 , Fall 2013, © A. Zaporozhetz 30 NPV Solution NPVNPV = $10, 000 (PVIF 13%, 1 ) + $12, 000 (PVIF 13%, 2 ) + $15, 000 (PVIF 13%, 3 ) + $10, 000 (PVIF 13%, 4 ) + $ 7, 000 (PVIF 13%, 5 ) — $40, 000 NPVNPV = $10, 000 (. 885) + $12, 000 (. 783) + $15, 000 (. 693) + $10, 000 (. 613) + $ 7, 000 (. 543) — $40, 000 NPVNPV = $8, 850 + $9, 396 + $10, 395 + $6, 130 + $3, 801 — $40, 000 = — $1,
WIUU BF-2 , Fall 2013, © A. Zaporozhetz 31 NPV Acceptance Criterion No! The NPV is negative. This means that the project is reducing shareholder wealth. Reject if NPVNPV < 0. 0. The management of Basket Wonders has determined that the required rate is 13% for projects of this type. Should this project be accepted?
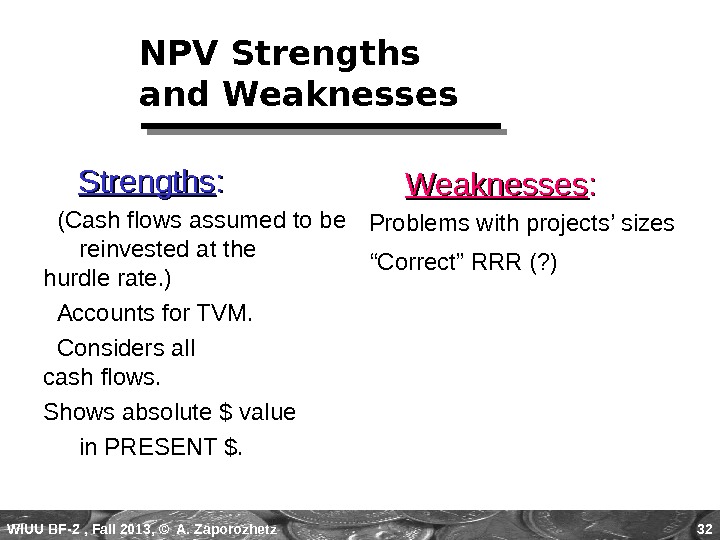
WIUU BF-2 , Fall 2013, © A. Zaporozhetz 32 NPV Strengths and Weaknesses Strengths : : (Cash flows assumed to be reinvested at the hurdle rate. ) Accounts for TVM. Considers all cash flows. Shows absolute $ value in PRESENT $. Weaknesses : : Problems with projects’ sizes “ Correct” RRR (? )
WIUU BF-2 , Fall 2013, © A. Zaporozhetz 33 Net Present Value Profile Discount Rate (%)0 3 6 9 12 15 IRR NPV@13%Sum of all CF’s Plot NPV for each discount rate. Three of these points are easy now! N e t P re s e n t V a lu e$000 s 15 10 5 0 —
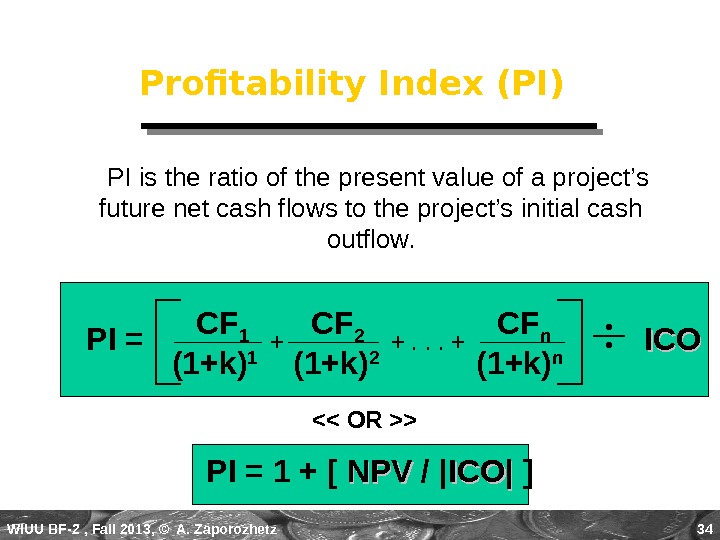
WIUU BF-2 , Fall 2013, © A. Zaporozhetz 34 Profitability Index (PI) PI is the ratio of the present value of a project’s future net cash flows to the project’s initial cash outflow. CF 1 CF 2 CF n (1+k) 1 (1+k) 2 (1+k) n+. . . ++ ICOICOPI = 1 + [ NPVNPV / | ICO| ]<>
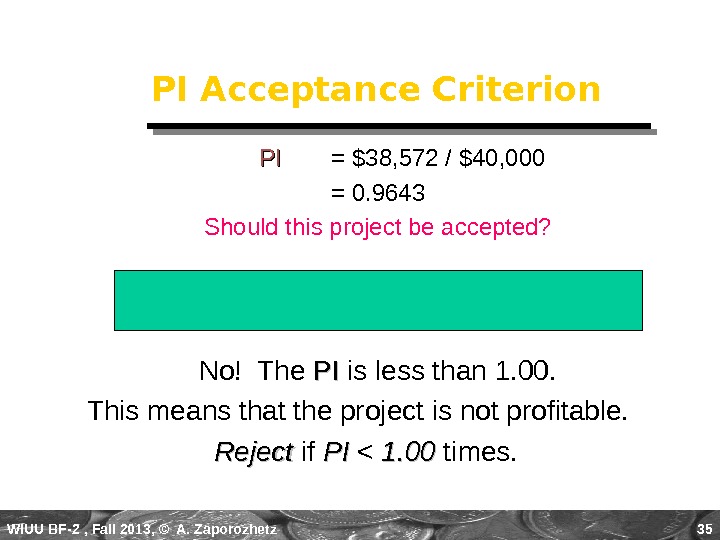
WIUU BF-2 , Fall 2013, © A. Zaporozhetz 35 PI Acceptance Criterion No! The PIPI is less than 1. 00. This means that the project is not profitable. Reject if PIPI < 1. 00 times. PIPI = $38, 572 / $40, 000 = 0. 9643 Should this project be accepted?
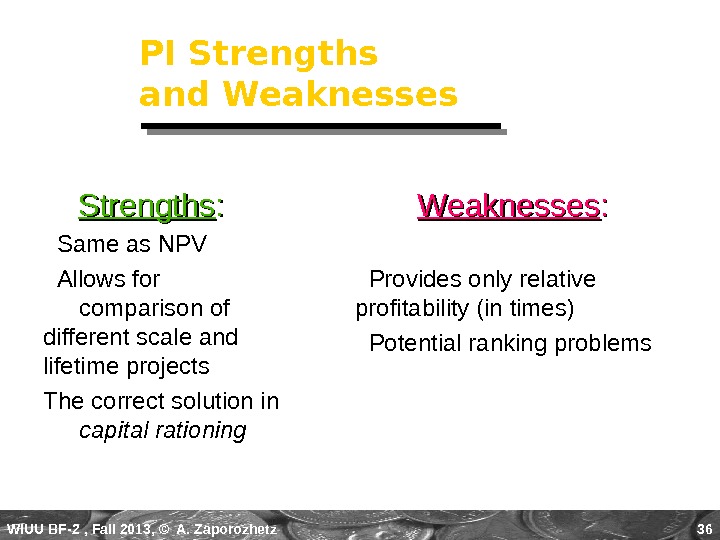
WIUU BF-2 , Fall 2013, © A. Zaporozhetz 36 PI Strengths and Weaknesses Strengths : : Same as NPV Allows for comparison of different scale and lifetime projects The correct solution in capital rationing Weaknesses : : Provides only relative profitability (in times) Potential ranking problems
WIUU BF-2 , Fall 2013, © A. Zaporozhetz 37 Evaluation Summary Basket Wonders Independent Project
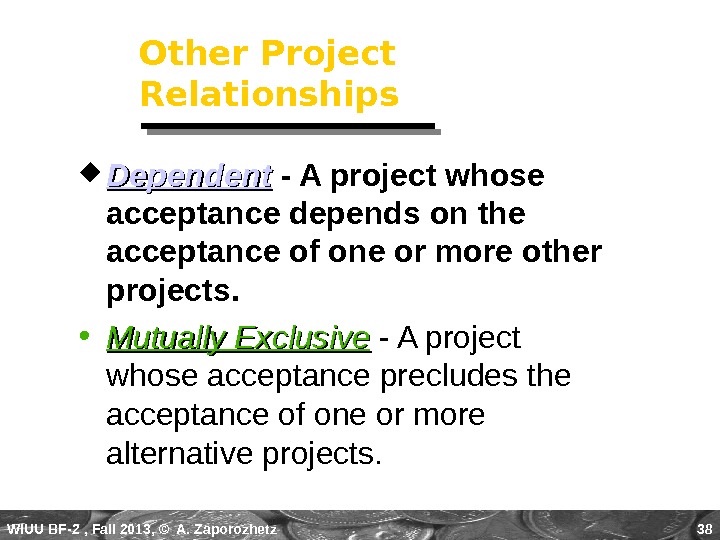
WIUU BF-2 , Fall 2013, © A. Zaporozhetz 38 Other Project Relationships • Mutually Exclusive — A project whose acceptance precludes the acceptance of one or more alternative projects. Dependent — A project whose acceptance depends on the acceptance of one or more other projects.
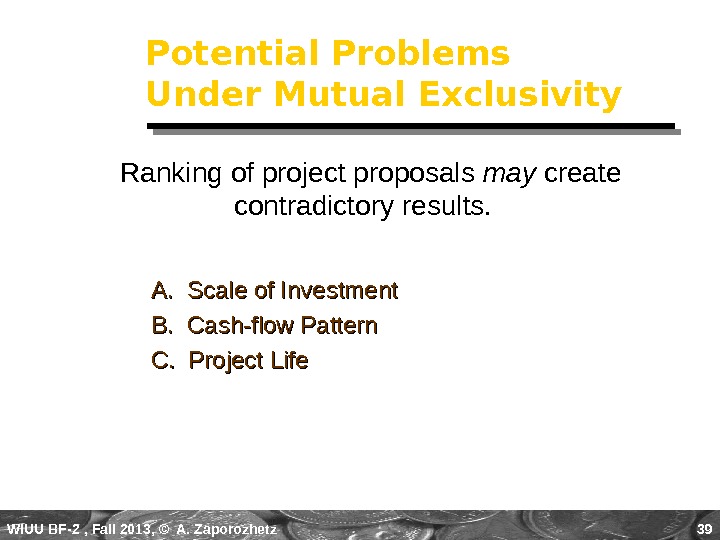
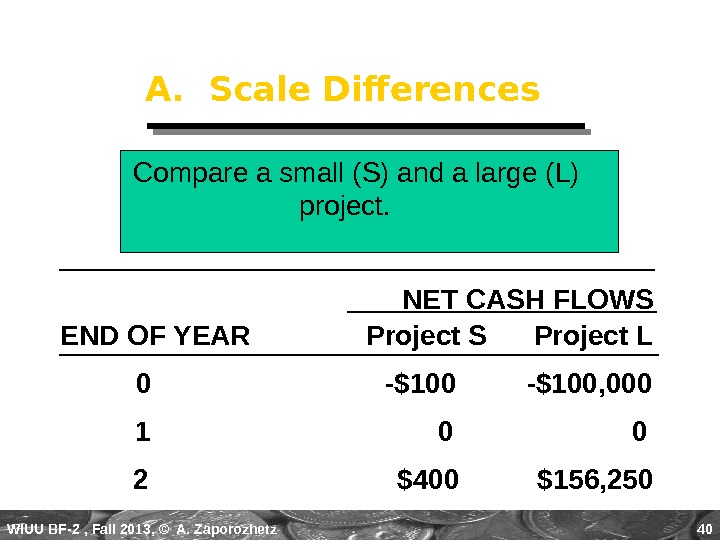
WIUU BF-2 , Fall 2013, © A. Zaporozhetz 39 Potential Problems Under Mutual Exclusivity A. Scale of Investment B. Cash-flow Pattern C. Project Life Ranking of project proposals may create contradictory results.
WIUU BF-2 , Fall 2013, © A. Zaporozhetz 40 A. Scale Differences Compare a small (S) and a large (L) project. NET CASH FLOWS Project LEND OF YEAR 0 -$100, 000 1 0 2 $400 $156,
WIUU BF-2 , Fall 2013, © A. Zaporozhetz 41 A. Scale Differences Calculate the PBP, IRR, NPV@10%, and PI@10%. Which project is preferred? Why? Project IRR NPV PI S 100% $ 231 3. 31 L 25% $29, 132 1.
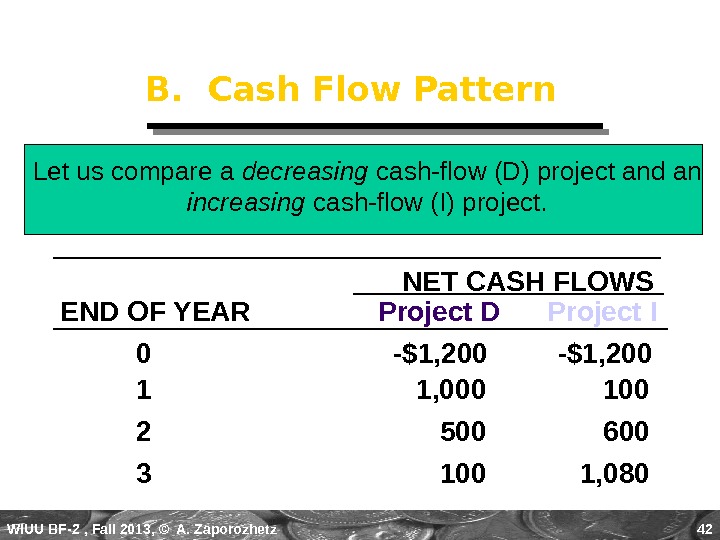
WIUU BF-2 , Fall 2013, © A. Zaporozhetz 42 B. Cash Flow Pattern Let us compare a decreasing cash-flow (D) project and an increasing cash-flow (I) project. NET CASH FLOWS Project D Project IEND OF YEAR 0 -$1, 200 1 1, 000 100 2 500 600 3 100 1,
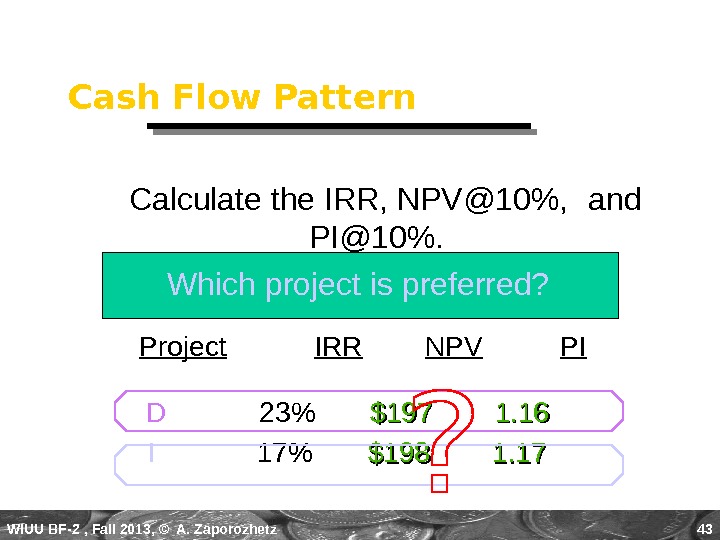
WIUU BF-2 , Fall 2013, © A. Zaporozhetz 43 D 23% $197 1. 16 I 17% $198 1. 17 Cash Flow Pattern Calculate the IRR, NPV@10%, and PI@10%. Which project is preferred? Project IRR NPV PI
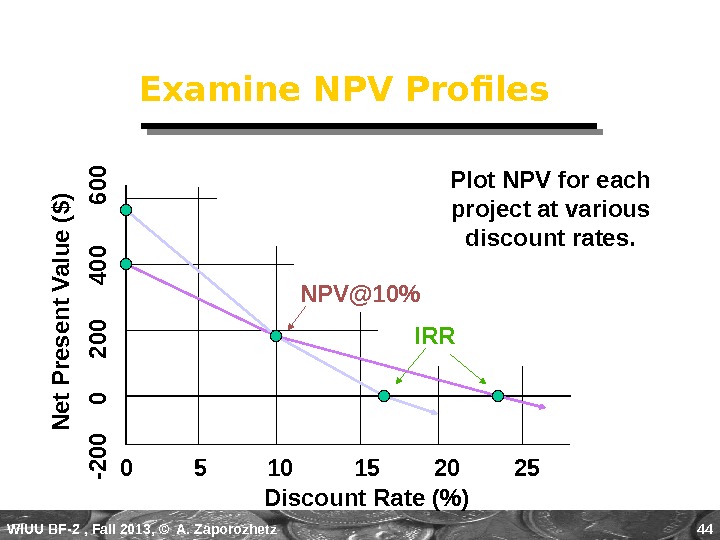
WIUU BF-2 , Fall 2013, © A. Zaporozhetz 44 Examine NPV Profiles Discount Rate (%)0 5 10 15 20 25 -2 0 0 0 2 0 0 4 0 0 6 0 0 IRRNPV@10% Plot NPV for each project at various discount rates. N e t P re s e n t V a lu e ($ )
WIUU BF-2 , Fall 2013, © A. Zaporozhetz 45 Fisher’s Rate of Intersection Discount Rate ($)0 5 10 15 20 25 -2 0 0 0 2 0 0 4 0 0 6 0 0 N e t P re s e n t V a lu e ($ )At k10%, D is better
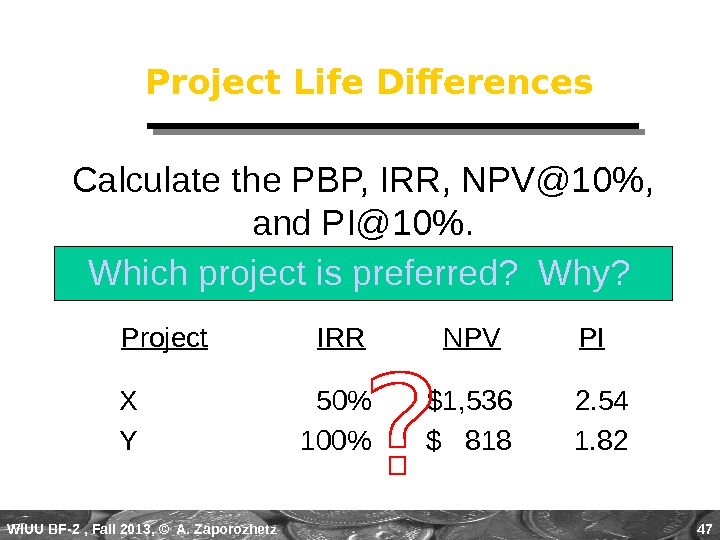
WIUU BF-2 , Fall 2013, © A. Zaporozhetz 46 C. Project Life Differences Let us compare a long life (X) project and a short life (Y) project. NET CASH FLOWS Project X Project YEND OF YEAR 0 -$1, 000 1 0 2, 000 2 0 3 3,
WIUU BF-2 , Fall 2013, © A. Zaporozhetz 47 X 50% $1, 536 2. 54 Y 100% $ 818 1. 82 Project Life Differences Calculate the PBP, IRR, NPV@10%, and PI@10%. Which project is preferred? Why? Project IRR NPV PI
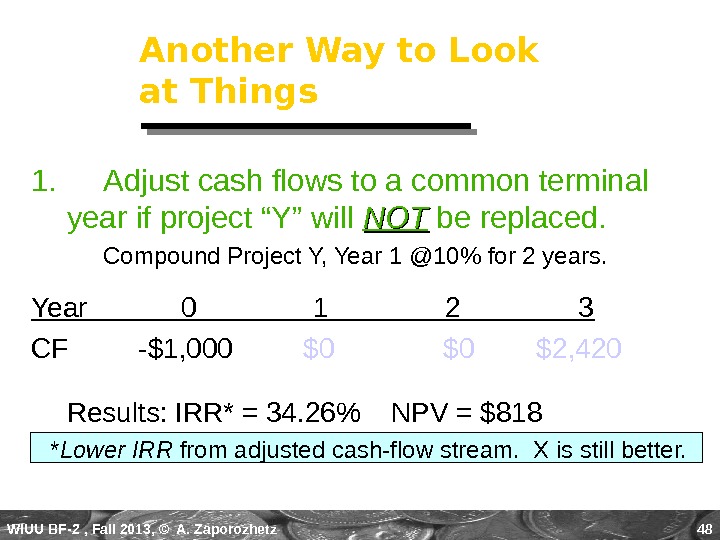
WIUU BF-2 , Fall 2013, © A. Zaporozhetz 48 Another Way to Look at Things 1. Adjust cash flows to a common terminal year if project “Y” will NOTNOT be replaced. Compound Project Y, Year 1 @10% for 2 years. Year 0 1 2 3 CF -$1, 000 $0 $2, 420 Results: IRR* = 34. 26% NPV = $818 * Lower IRR from adjusted cash-flow stream. X is still better.
WIUU BF-2 , Fall 2013, © A. Zaporozhetz 49 Replacing Projects with Identical Projects 2. Use Replacement Chain Approach (Appendix B) when project “Y” will be replaced. 0 1 2 3 -$1, 000 $2, 000 -1, 000 $2, 000 -1, 000 $2, 000 -$1, 000 $1, 000 $2, 000 Results: IRR* = 100% NPV* = $2, 238. 17 * Higher NPV, but the same IRR. Y is better.
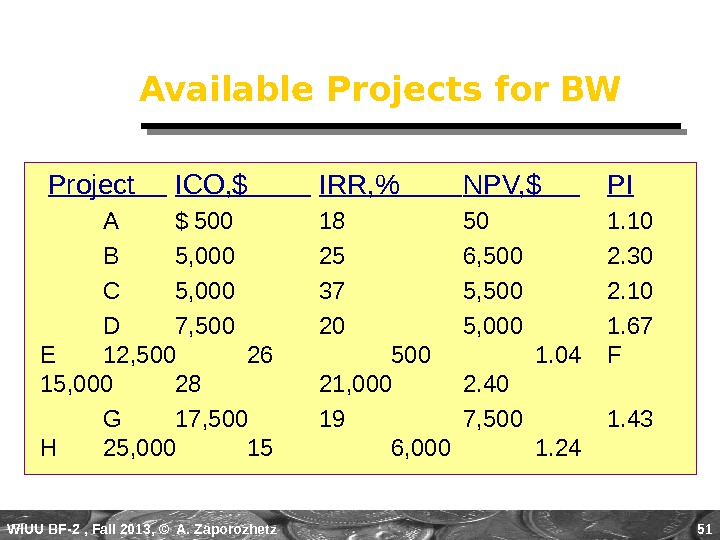
WIUU BF-2 , Fall 2013, © A. Zaporozhetz 50 Capital Rationing occurs when a constraint (or budget ceiling) is placed on the total size of capital expenditures during a particular period. Example : Julie Miller must determine what investment opportunities to undertake for Basket Wonders (BW). She is limited to a maximum expenditure of $32, 500 only for this capital budgeting period.
WIUU BF-2 , Fall 2013, © A. Zaporozhetz 51 Available Projects for BW Project ICO, $ IRR, % NPV, $ PI A $ 500 18 50 1. 10 B 5, 000 25 6, 500 2. 30 C 5, 000 37 5, 500 2. 10 D 7, 500 20 5, 000 1. 67 E 12, 500 26 500 1. 04 F 15, 000 28 21, 000 2. 40 G 17, 500 19 7, 500 1. 43 H 25, 000 15 6, 000 1.
WIUU BF-2 , Fall 2013, © A. Zaporozhetz 52 Choosing by IRRs for BW Project ICO IRR NPV PI C $5, 000 37% $5, 500 2. 10 F 15, 000 28 21, 000 2. 40 E 12, 500 26 500 1. 04 B 5, 000 25 6, 500 2. 30 Projects C, F, and E have three largest IRRs. The resulting increase in shareholder wealth is $27, 000 with a $32, 500 outlay.
WIUU BF-2 , Fall 2013, © A. Zaporozhetz 53 Choosing by NPVs for BW Project ICO IRR NPV PI F $15, 000 28% $21, 000 2. 40 G 17, 500 19 7, 500 1. 43 B 5, 000 25 6, 500 2. 30 Projects F and G have the two largest NPVs. The resulting increase in shareholder wealth is $28, 500 with a $32, 500 outlay.
WIUU BF-2 , Fall 2013, © A. Zaporozhetz 54 Choosing by PIs for BW Project ICO IRR NPV PI F $15, 000 28% $21, 000 2. 40 B 5, 000 25 6, 500 2. 30 C 5, 000 37 5, 500 2. 10 D 7, 500 20 5, 000 1. 67 G 17, 500 19 7, 500 1. 43 Projects F, B, C, and D have the four largest PIs. The resulting increase in shareholder wealth is $38, 000 with a $32, 500 outlay.
WIUU BF-2 , Fall 2013, © A. Zaporozhetz 55 Summary of Comparison Method Projects Accepted Value Added PI F, B, C, and D $38, 000 NPV F and G $28, 500 IRR C, F, and E $27, 000 PIPI generates the greatest increase in shareholder wealth when a limited capital budget exists for a single period.
WIUU BF-2 , Fall 2013, © A. Zaporozhetz 56 Post-Completion Audit: Usus Magister Est Optimus Post-completion Audit A formal comparison of the actual costs and benefits of a project with original estimates. Identify any project weaknesses Develop a possible set of corrective actions Provide appropriate feedback Result: Making better future decisions!
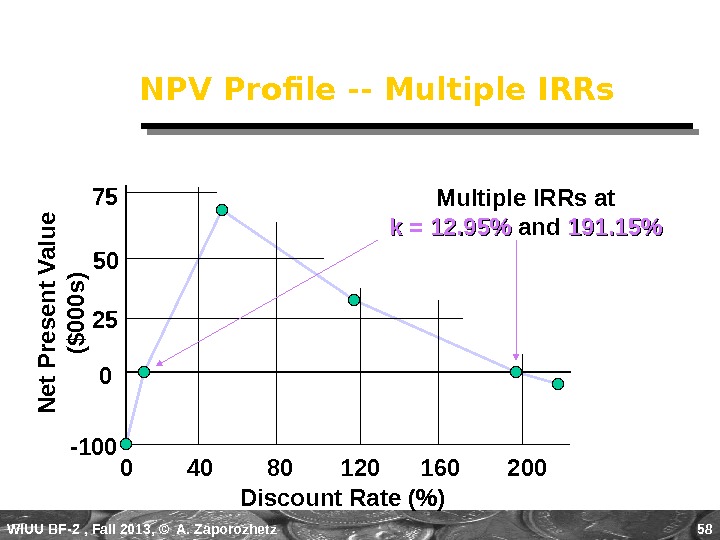
WIUU BF-2 , Fall 2013, © A. Zaporozhetz 57 Multiple IRR Problem Two!! There as many potential IRRs as there are sign changes. Let us assume the following cash flow pattern for a project for Years 0 to 4: -$100 +$900 -$1, 000 How many potential IRRs could this project have?
WIUU BF-2 , Fall 2013, © A. Zaporozhetz 58 NPV Profile — Multiple IRRs Discount Rate (%)0 40 80 120 160 200 N e t P re s e n t V a lu e ($ 0 0 0 s ) Multiple IRRs at k k = 12. 95% and 191. 15%75 50 25 0 —
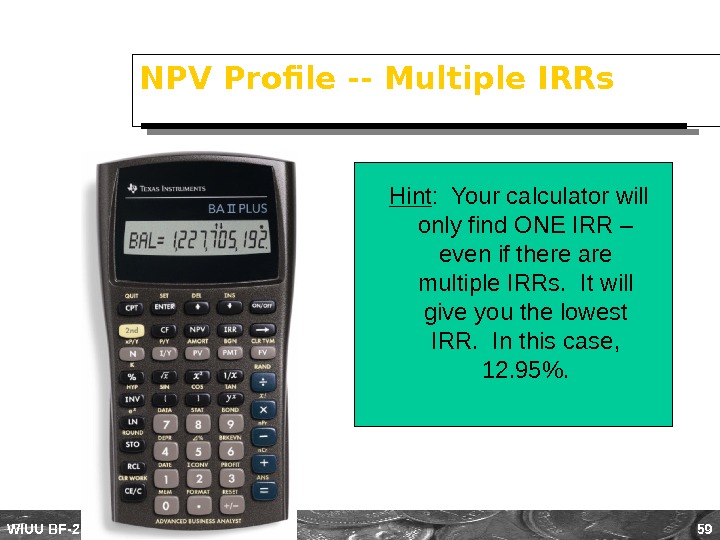
WIUU BF-2 , Fall 2013, © A. Zaporozhetz 59 NPV Profile — Multiple IRRs Hint : Your calculator will only find ONE IRR – even if there are multiple IRRs. It will give you the lowest IRR. In this case, 12. 95%.