
Studying Pathogenesis of Hodgkin Lymphomas Sibrand Poppema Department


the_pathology_of_hd.ppt
- Размер: 18.9 Mегабайта
- Количество слайдов: 68
Описание презентации Studying Pathogenesis of Hodgkin Lymphomas Sibrand Poppema Department по слайдам
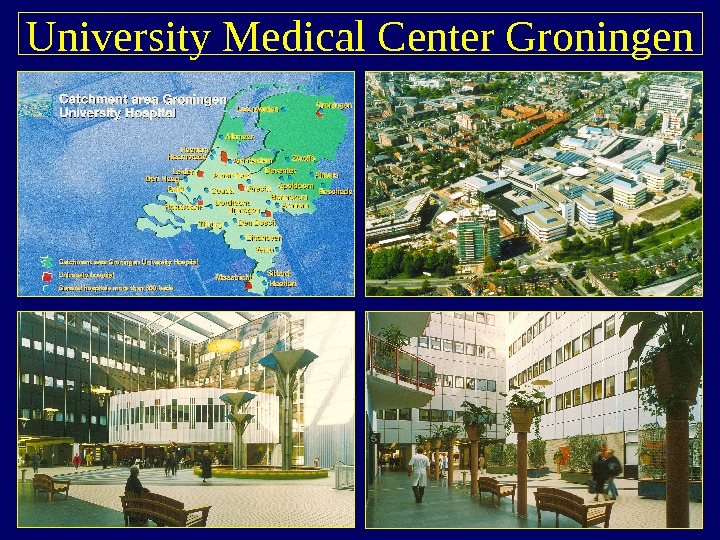
Studying Pathogenesis of Hodgkin Lymphomas Sibrand Poppema Department of Pathology & Laboratory Medicine University Medical Center Groningen
University Medical Center Groningen
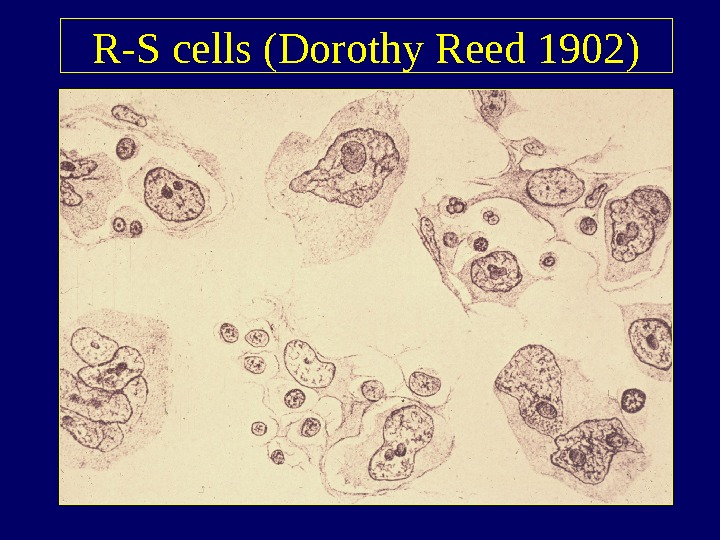
R-S cells (Dorothy Reed 1902)
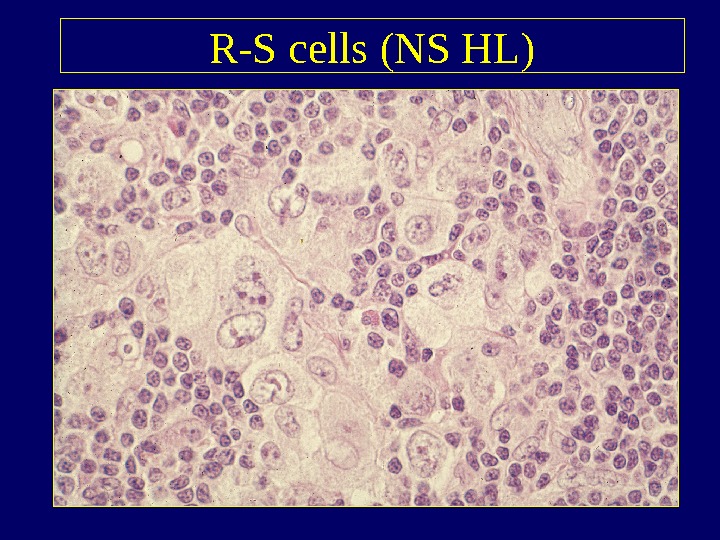
R-S cells (NS HL)
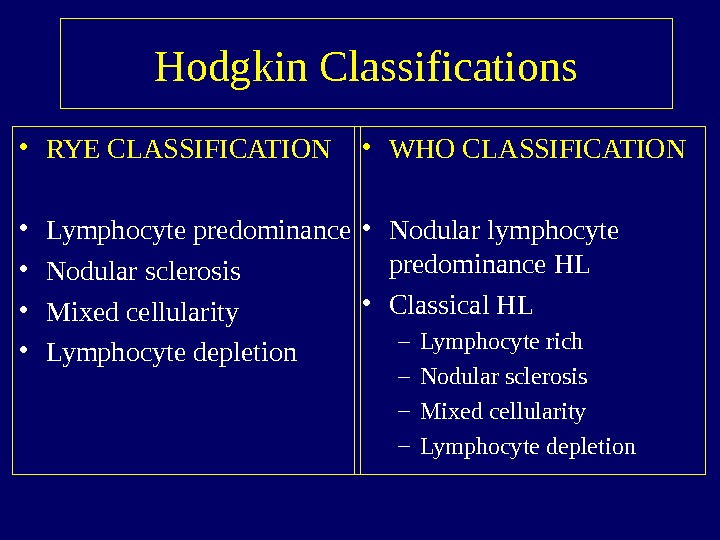
Hodgkin Classifications • RYE CLASSIFICATION • Lymphocyte predominance • Nodular sclerosis • Mixed cellularity • Lymphocyte depletion • WHO CLASSIFICATION • Nodular lymphocyte predominance HL • Classical HL – Lymphocyte rich – Nodular sclerosis – Mixed cellularity – Lymphocyte depletion
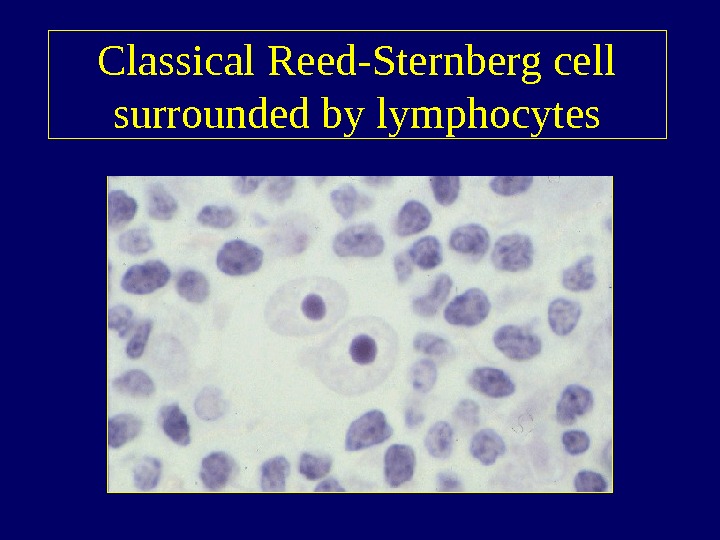
Classical Reed-Sternberg cell surrounded by lymphocytes
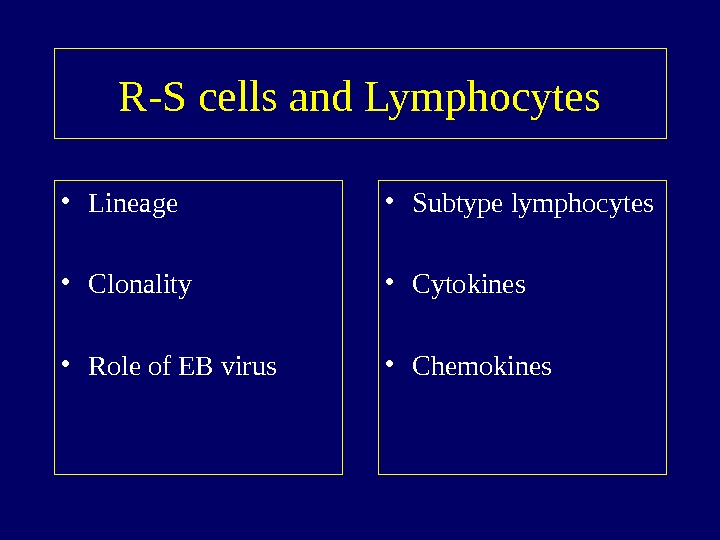
R-S cells and Lymphocytes • Lineage • Clonality • Role of EB virus • Subtype lymphocytes • Cytokines • Chemokines
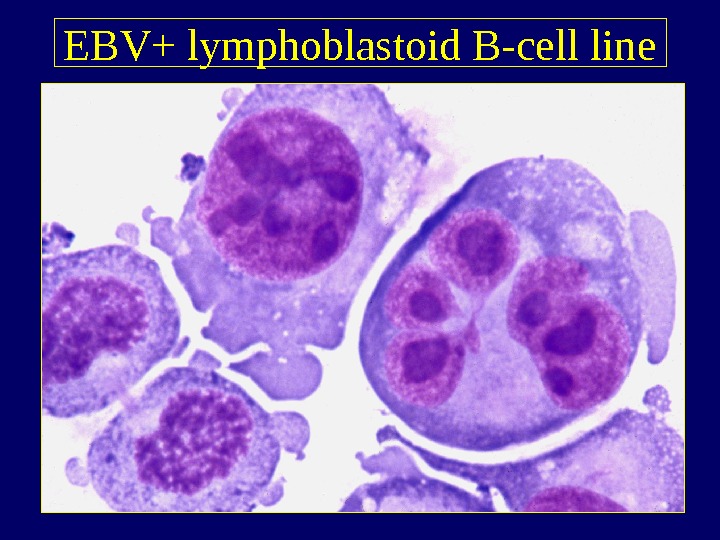
EBV+ lymphoblastoid B-cell line
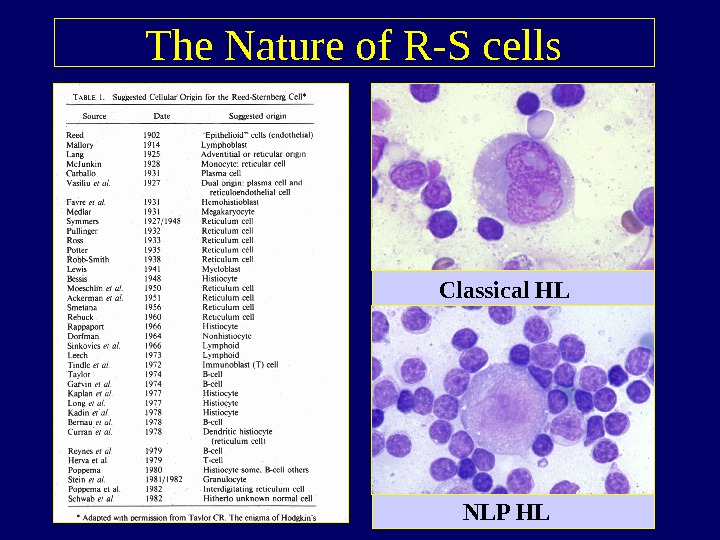
The Nature of R-S cells Classical HL NLP HL
B-cell origin of L&H Reed-Sternberg cells in NLPHL • L&H type R-S cells have Ig gene rearrangement, express Oct 1 (transcription factor) and BOB 1 (co-activator), m. RNA and Immunoglobulin. • The V regions show somatic hypermutation with also ongoing mutations. • Thus, L&H cells are GC B-cells
B-cell origin of classical Reed-Sternberg cells • The R-S cells usually have clonal Ig gene rearrangements with somatic hypermutations, no ongoing mutations, sometimes stop codons. • Frequently not expressing B-cell transcription factors like Oct 2 and BOB 1, Ig m. RNA and Immunoglobulin. • Thus, classical R-S cells are of (post) GC origin • Note 1: only 3 T cell cases reported in literature ! • Note 2: expression of T cell transcription factors!
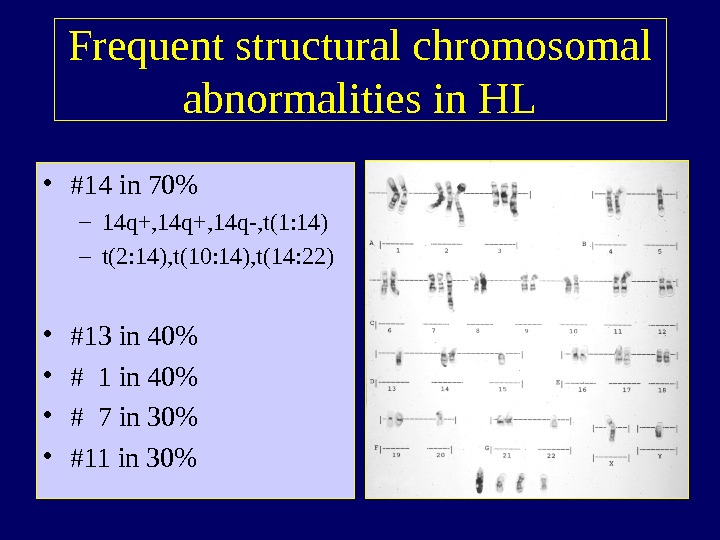
Frequent structural chromosomal abnormalities in HL • #14 in 70% – 14 q+, 14 q-, t(1: 14) – t(2: 14), t(10: 14), t(14: 22) • #13 in 40% • # 1 in 40% • # 7 in 30% • #11 in 30%
Some questions on HL • Why is there an immune response? • Do R-S cells produce cytokines/chemokines? • Is an antigen involved? • Why is the immune response not effective? • Is the T-cell activation inappropriate? • Is there a problem with antigen presentation? • Is there a bias in T-cell attraction? • Do R-S cells produce immunosuppressive factors?
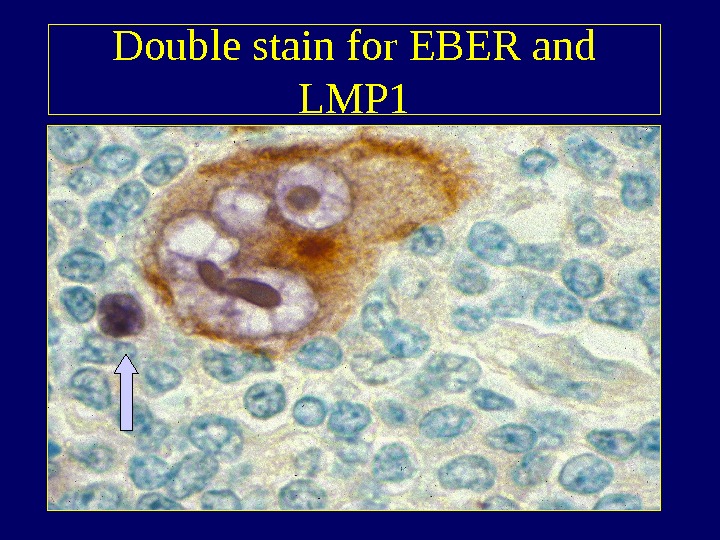
Double stain for EBER and LMP
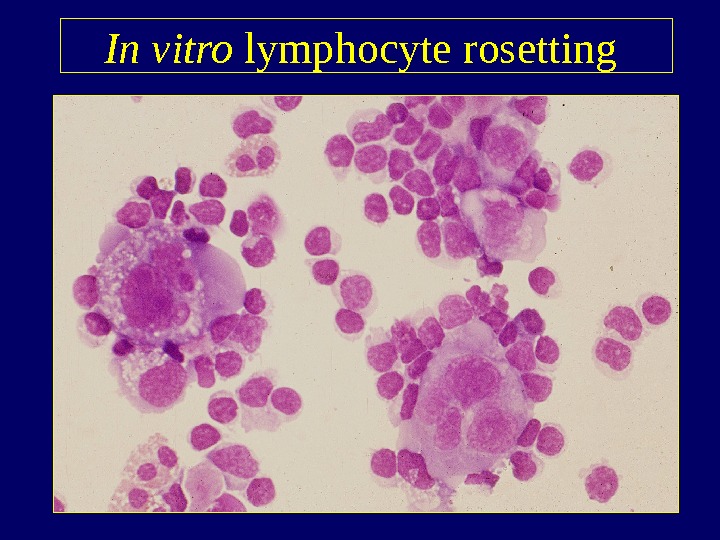
In vitro lymphocyte rosetting
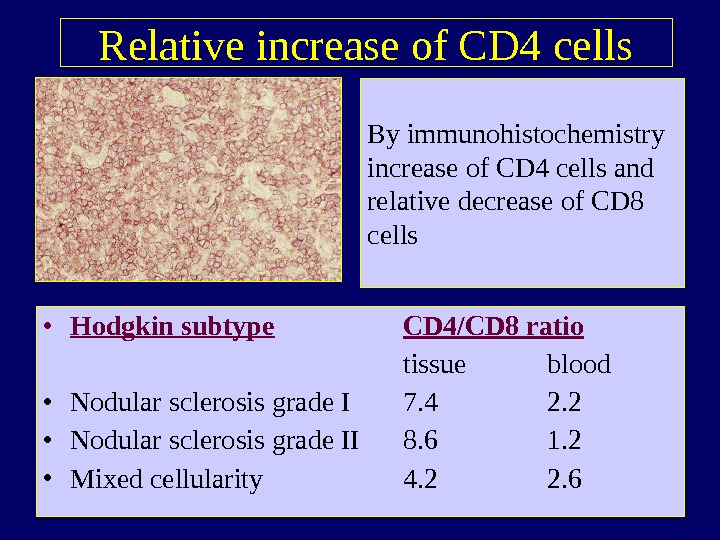
Relative increase of CD 4 cells • Hodgkin subtype CD 4/CD 8 ratio tissue blood • Nodular sclerosis grade I 7. 4 2. 2 • Nodular sclerosis grade II 8. 6 1. 2 • Mixed cellularity 4. 2 2. 6 By immunohistochemistry increase of CD 4 cells and relative decrease of CD 8 cells
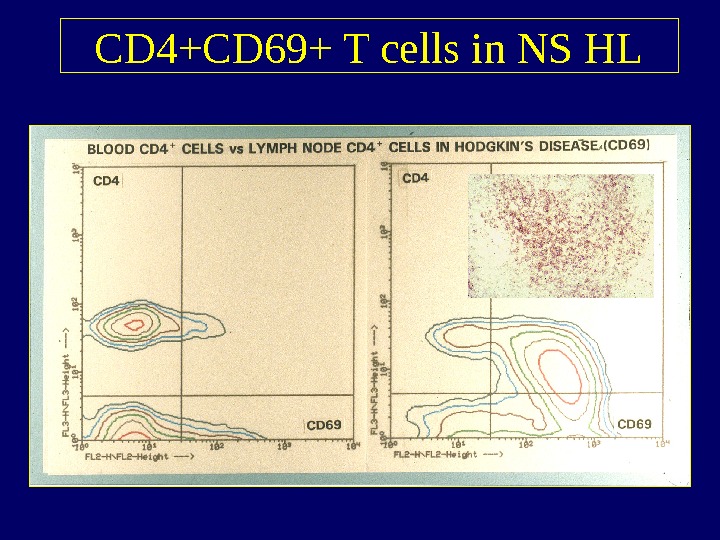
CD 4+CD 69+ T cells in NS HL
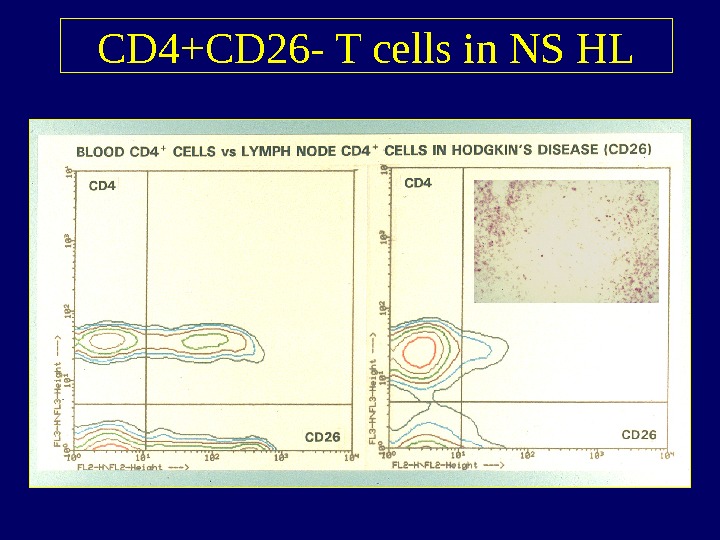
CD 4+CD 26 — T cells in NS HL
CD 26 dipeptidyl peptidase IV • Expressed in subset CD 4 and CD 8 cells • Upregulated upon T cell activation • Co-activator molecule on T cells • Associates with ADA and CD 45 R 0 • Inactivates several chemokines by its peptidase activity • Expressed on Th 1 and not on Th 2 cells
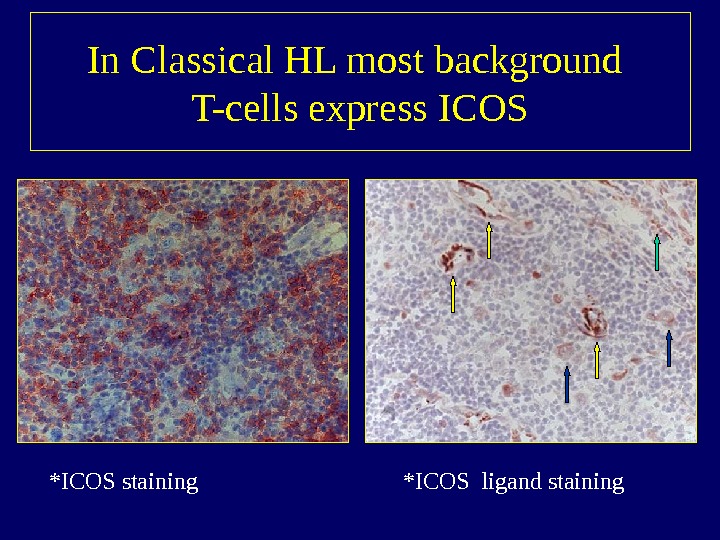
Nature of the lymphocytes in classical Hodgkin lymphomas • CD 3/TCR +, CD 45 R 0+, CD 45 RBdim • LFA 1+, LFA 2+ • CD 28+, CTLA 4+ , ICOS+ , CD 27+, CD 40 L+ • CCR 4+ • CD 38+, CD 69+, CD 26 neg • Phenotype suggests activated Th 2 cells
Co-stimulation • Co-stimulation via CTLA-4 may inhibit T-cell activation. • Co-stimulation via ICOS may lead to TH 2 type cytokine production
In Classical HL most background T-cells express ICOS *ICOS staining *ICOS ligand staining
Cytokine production (pg/ml) by Ho LN cells (PMA/ionomycin activation) 02004006008001000 Ho 31 Ho 32 Ho 28 Ho 31 848 717 Ho 32 662 49 Ho 28 611 119 IFNg IL 4 Th 1 Th
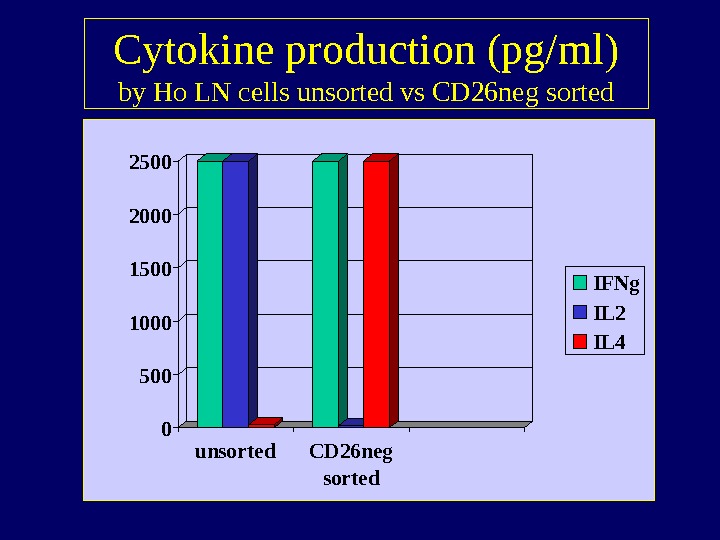
Cytokine production (pg/ml) by Ho LN cells unsorted vs CD 26 neg sorted 05001000150020002500 unsorted CD 26 neg sorted IFNg IL 2 IL
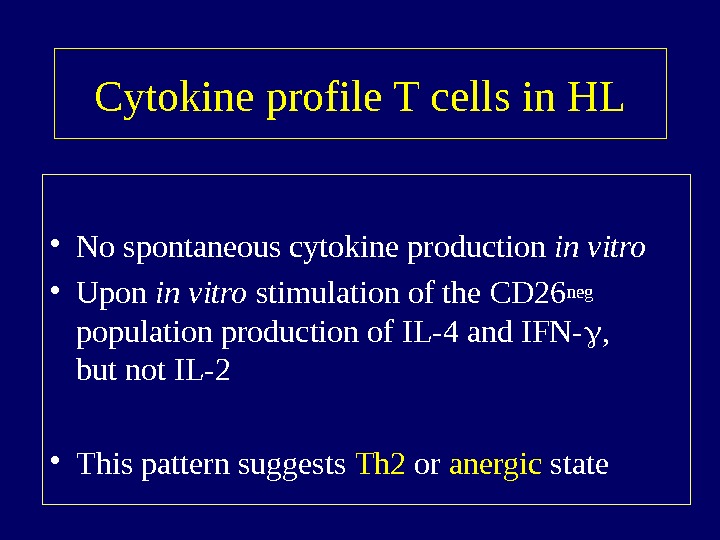
Cytokine profile T cells in HL • No spontaneous cytokine production in vitro • Upon in vitro stimulation of the CD 26 neg population production of IL-4 and IFN- , but not IL-2 • This pattern suggests Th 2 or anergic state
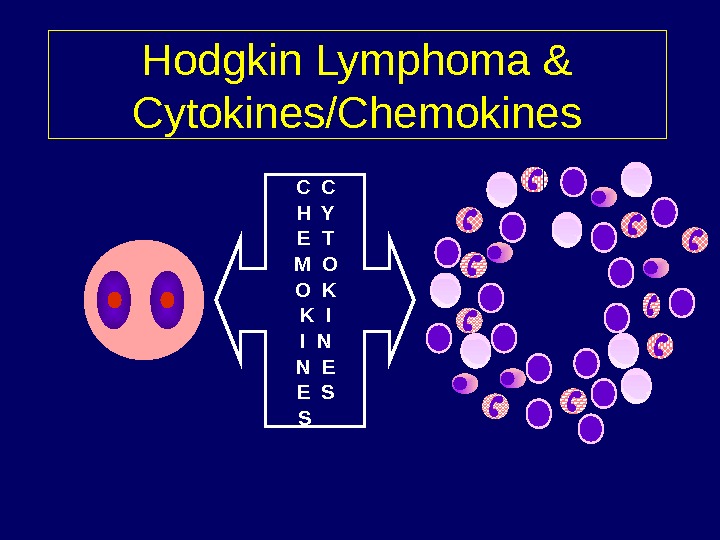
Hodgkin Lymphoma & Cytokines/Chemokines C C H Y E T M O O K K I I N N E E S S
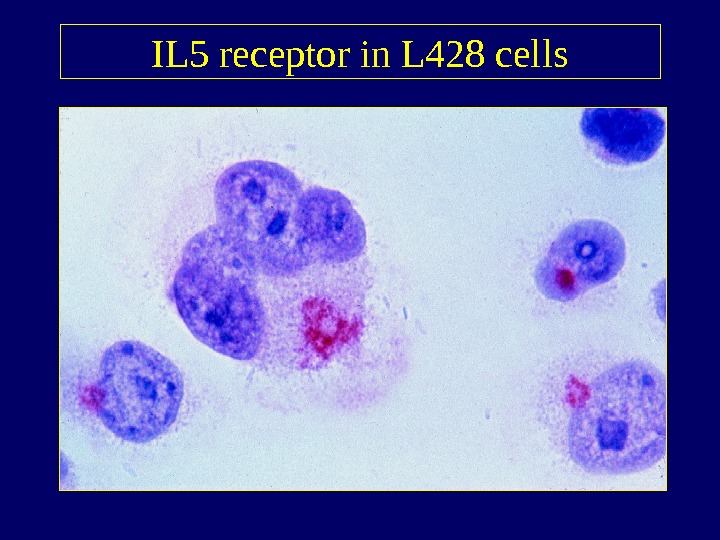
Cytokines and cytokine receptors expressed by R-S cells • IL-1, IL-3, IL-5, IL-6, IL-7, IL-9, IL-10 , IL 13, LT , TGF • IL-2 r , IL-5 r, IL-6 r, IL 9 r, IL-13 r
IL 5 receptor in L 428 cells
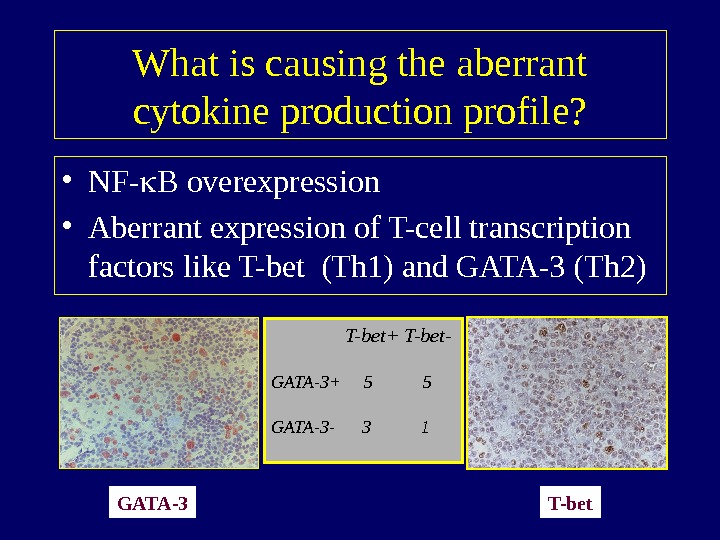
What is causing the aberrant cytokine production profile? • NF- B overexpression • Aberrant expression of T-cell transcription factors like T-bet (Th 1) and GATA-3 (Th 2) GATA-3 T-bet T-bet+ T-bet- GATA-3+ 5 5 GATA-3 —
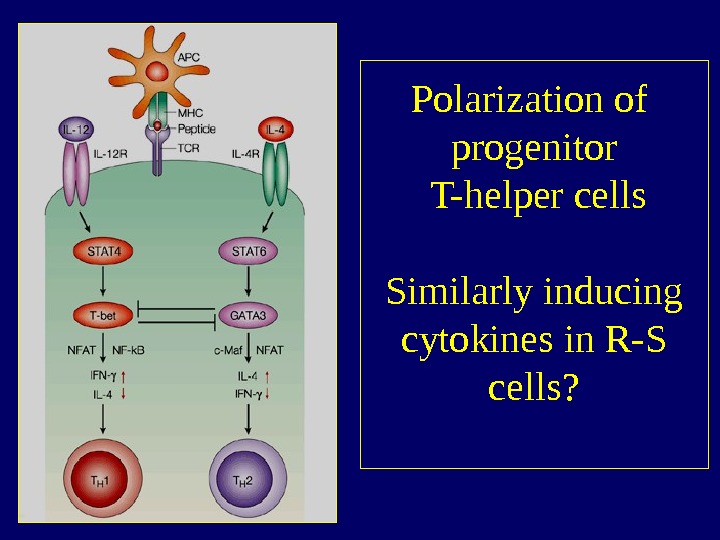
Polarization of progenitor T-helper cells Similarly inducing cytokines in R-S cells?
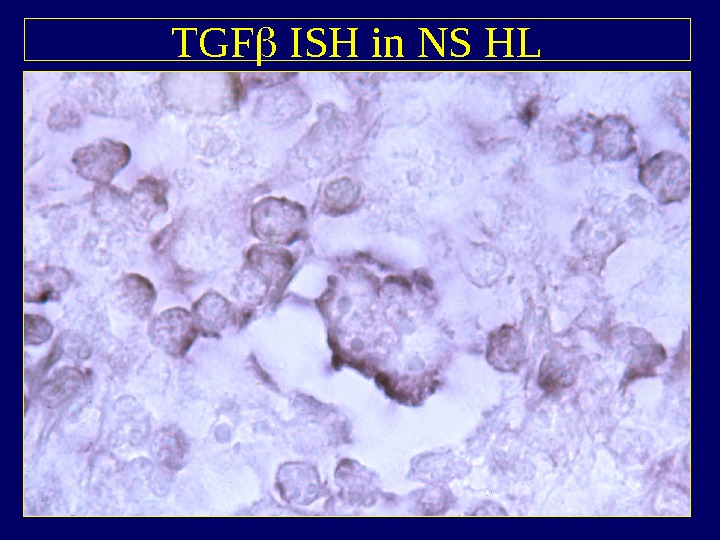
Potential immunosuppressive factors in classical HL • Transforming Growth Factor – produced in active form by R-S cells (high MW) – Inhibits IL-2 production and IL-2 receptor expression on T-cells (arrest in G 1) – also promotes fibrosis • Interleukin-10 – especially in EBV+ cases (v. IL-10 and h. IL-10) – shifts response away from Th 1 towards Th 2 or anergy and supports B-cells
TGF ISH in NS HL
Steps in development of the characteristic infiltrate of HL • Rosetting around R-S cells • Activation of the T lymphocytes • Suppression/immunomodulation • Attraction of lymphocytes into the tissue
Gene expression studies in HL derived cell lines • To identify genes involved in the malignant transformation of R-S precursor cell • To identify genes responsible for the characteristic phenotype of Hodgkin lymphoma • To obtain complete expression profile of classical and L&H type R-S cells (10, 000 tags) • Employing the SAGE technique
HL derived cell lines • L 428: Classical Hodgkin lymphoma (Nodular Sclerosis EBV negative) • L 1236: Classical Hodgkin lymphoma • (Mixed Cellularity EBV negative) • DEV: Nodular lymphocyte predominant Hodgkin lymphoma • RAY: EBV transformed lymphoblastoid B- cell line
Gene expression in Hodgkin cell lines • Genes expressed in – DEV, L 428 asnd L 1236, but not RAY – DEV and RAY, but not L 428, L 1236 – DEV, but not L 428, L 1236 and RAY – L 428, L 1236 but not DEV and RAY – etc
Differentially expressed genes • “ Known tags” highly expressed in HL – Fascin – Restin – CD 30 – NF- B • “ Unknown tags” highly expressed in HL – TARC occurred at frequency 1. 0% – Unknown tag occurred at a frequency of 0. 1% Bic
TARC (CCL 17) • In a gene expression study by serial analysis of gene expression (SAGE) on Hodgkin cell line L 428 approx. 1% of all tags was found to be TARC • TARC = Thymus and Activation Regulated Chemokine • Normal expression: Antigen presenting cells (dendritic cells) • Attracts: Th 2 — like T cells with CCR 4 receptor
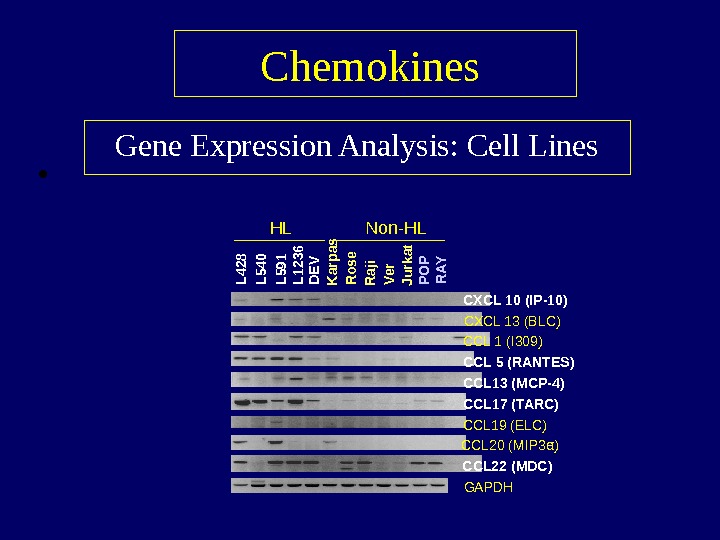
• Chemokines Gene Expression Analysis: Cell Lines α )CXCL 10 (IP-10) CXCL 13 (BLC) CCL 1 (I 309) CCL 5 (RANTES) CCL 13 (MCP-4) CCL 17 (TARC) CCL 19 (ELC) CCL 20 (MIP 3 a) CCL 22 (MDC) GAPDHL 428 L 540 L 591 L 1236 D EV K arpas R ose R aji Ver Jurkat PO P R AYHL Non-HL
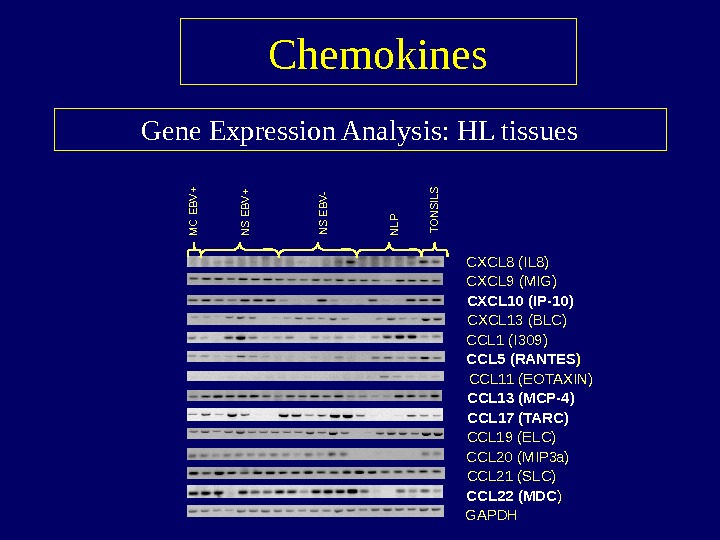
Gene Expression Analysis: HL tissues Chemokines CXCL 8 (IL 8) CXCL 9 (MIG) CXCL 10 (IP-10) CXCL 13 (BLC) CCL 1 (I 309) CCL 5 (RANTES ) CCL 11 (EOTAXIN) CCL 13 (MCP-4) CCL 17 (TARC) CCL 19 (ELC) CCL 20 (MIP 3 a ) CCL 21 (SLC) CCL 22 (MDC ) GAPDHMC EBV+ NS EBV- NLP TONSILS
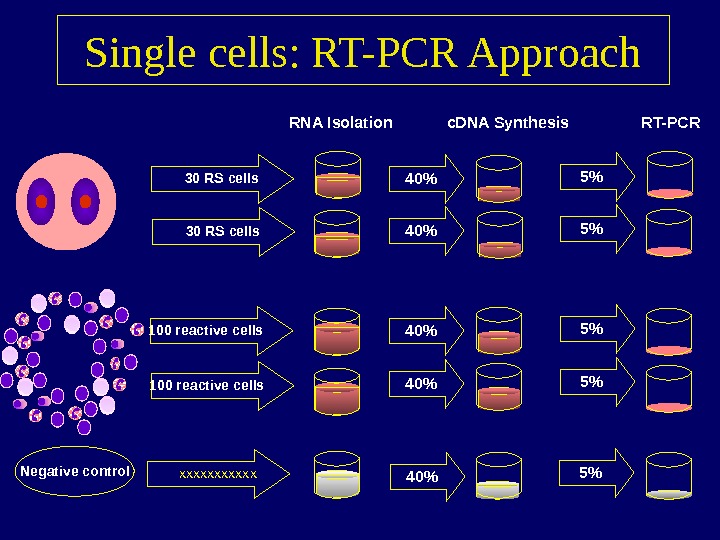
Single cells: RT-PCR Approach 30 RS cells 100 reactive cells RNA Isolation 40% 40% c. DNA Synthesis 5% 5% RT-PCR Negative control xxxxxx 40% 5%
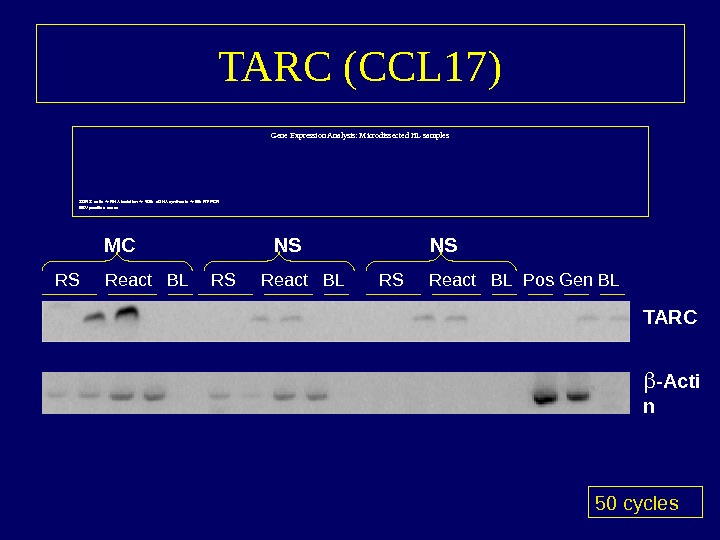
TARC (CCL 17) Gene Expression Analysis: Microdissected HL samples 30 RS cells RNA isolation 40% c. DNA synthesis 5% RT-PCR EBV positive cases 50 cycles. RS React BL Pos Gen BLMC NS -Acti n. TARCNS RS React BL
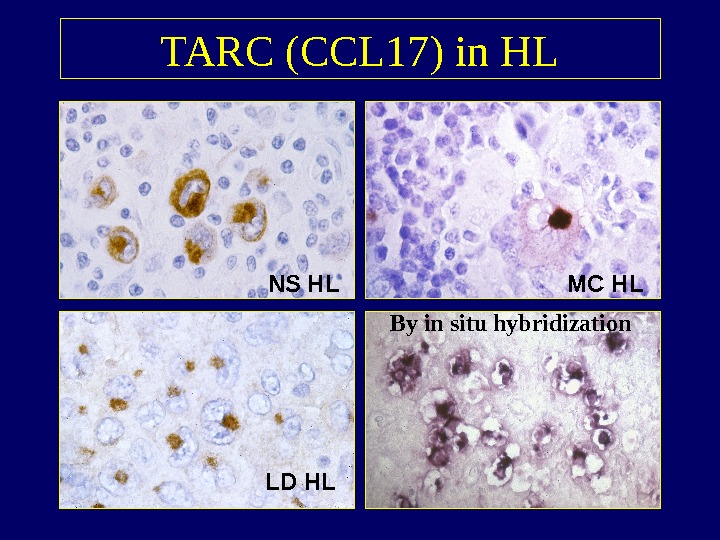
TARC (CCL 17) in HL NS HL LD HL MC HL By in situ hybridization
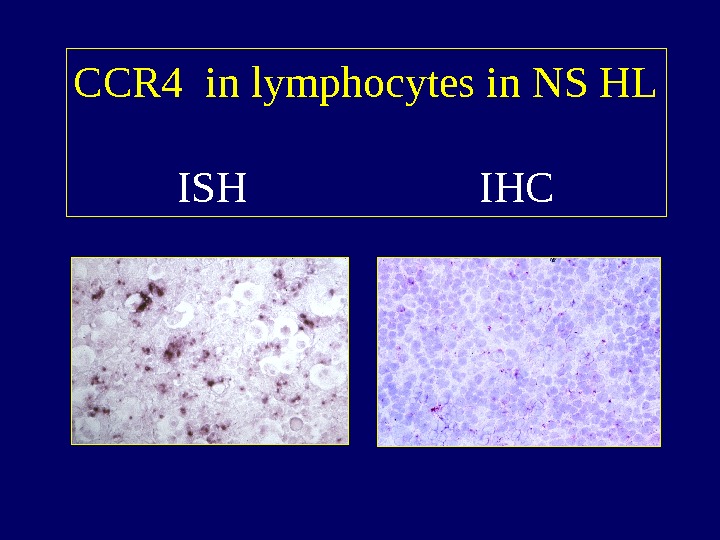
CCR 4 in lymphocytes in NS HL ISH IH
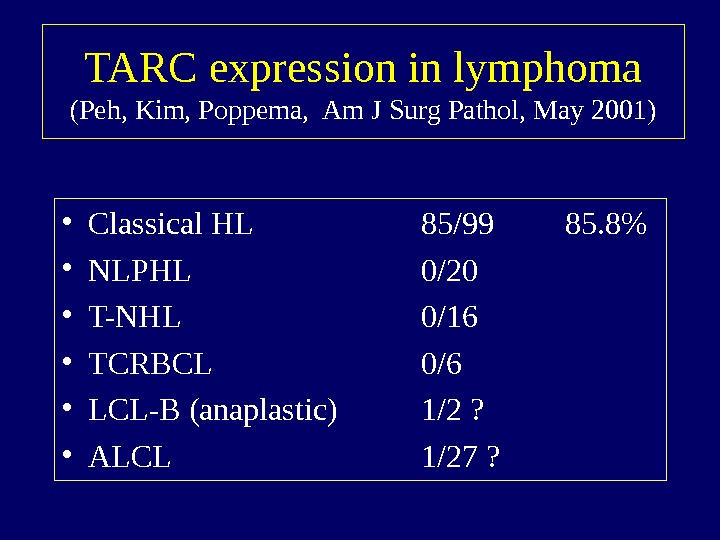
TARC expression in lymphoma (Peh, Kim, Poppema, Am J Surg Pathol, May 2001) • Classical HL 85/99 85. 8% • NLPHL 0/20 • T-NHL 0/16 • TCRBCL 0/6 • LCL-B (anaplastic) 1/2 ? • ALCL 1/27 ?
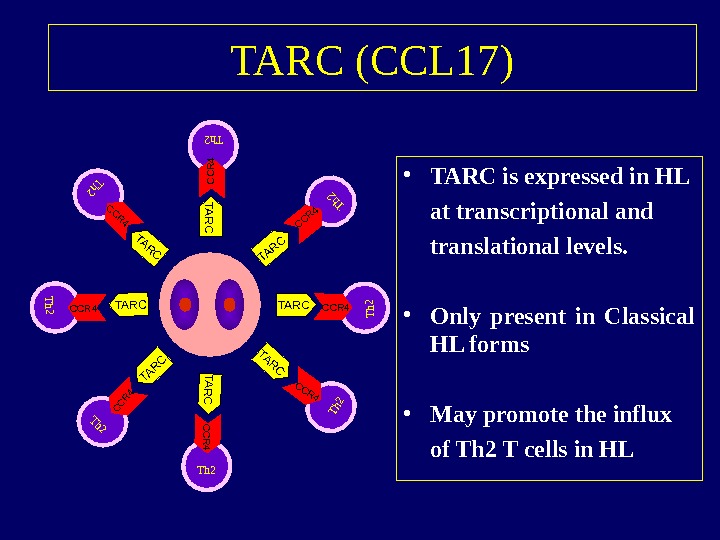
TARC (CCL 17) • TARC is expressed in HL at transcriptional and translational levels. • Only present in Classical HL forms • May promote the influx of Th 2 T cells in HLTh 2 CCR 4 TARC TARC Th 2 CCR 4 Th 2 CCR 4 Th 2 CCR
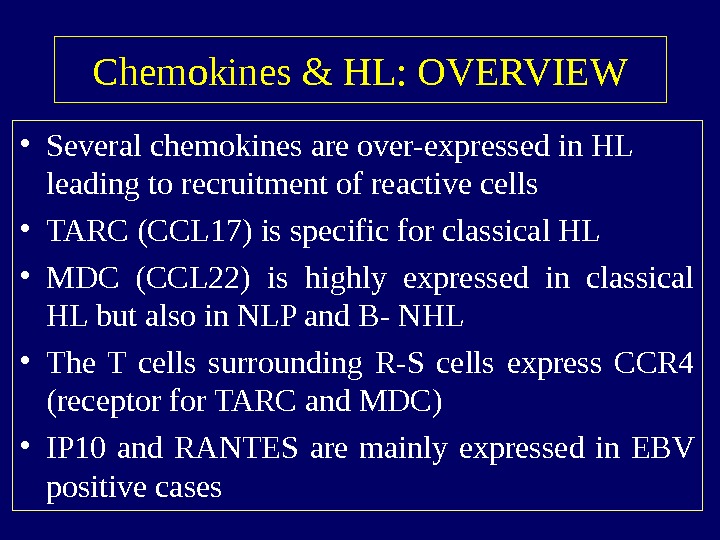
Chemokines & HL: OVERVIEW • Several chemokines are over-expressed in HL leading to recruitment of reactive cells • TARC (CCL 17) is specific for classical HL • MDC (CCL 22) is highly expressed in classical HL but also in NLP and B- NHL • The T cells surrounding R-S cells express CCR 4 (receptor for TARC and MDC) • IP 10 and RANTES are mainly expressed in EBV positive cases
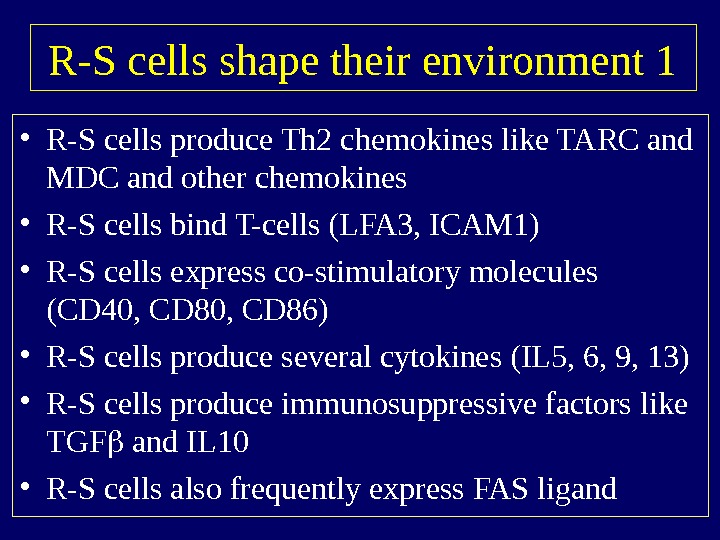
R-S cells shape their environment 1 • R-S cells produce Th 2 chemokines like TARC and MDC and other chemokines • R-S cells bind T-cells (LFA 3, ICAM 1) • R-S cells express co-stimulatory molecules (CD 40, CD 86) • R-S cells produce several cytokines (IL 5, 6, 9, 13) • R-S cells produce immunosuppressive factors like TGF and IL 10 • R-S cells also frequently express FAS ligand
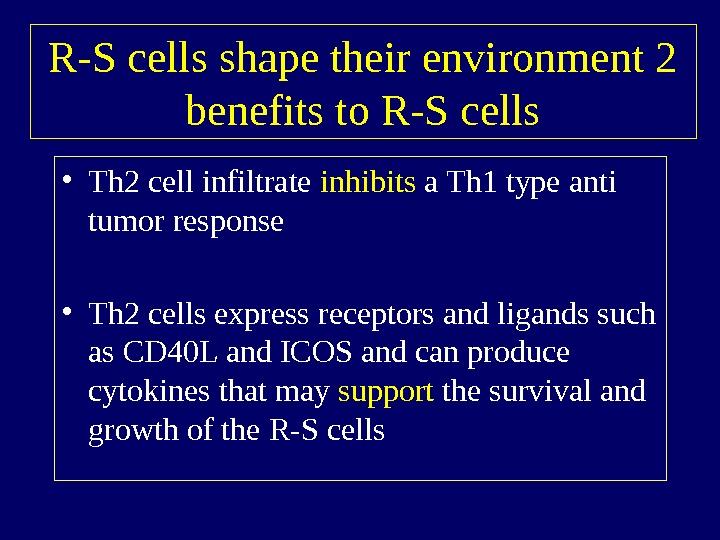
R-S cells shape their environment 2 benefits to R-S cells • Th 2 cell infiltrate inhibits a Th 1 type anti tumor response • Th 2 cells express receptors and ligands such as CD 40 L and ICOS and can produce cytokines that may support the survival and growth of the R-S cells
Bic, a noncoding m. RNA molecule highly expressed in R-S cells • Identified by SAGE in Hodgkin cell lines • Question: • Is this gene of relevance?
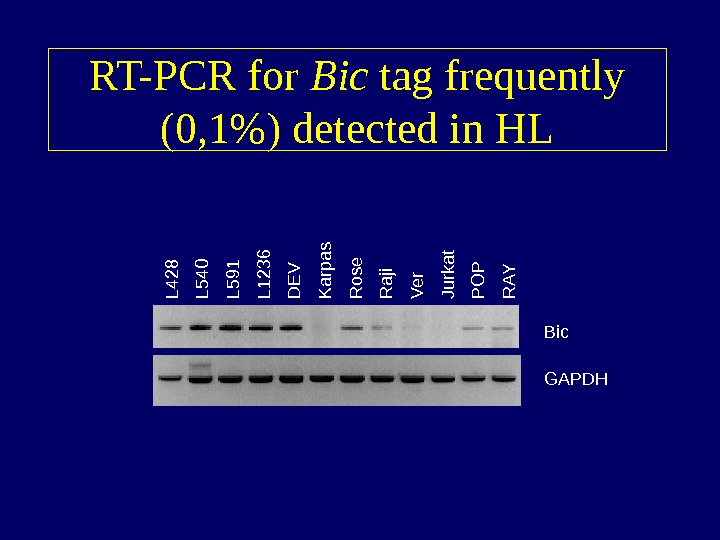
RT-PCR for Bic tag frequently (0, 1%) detected in HLL 4 2 8 L 5 40 L 5 91 L 12 36 D E V K arpas R ose R a ji V e r Jurkat P O P R A Y Bic GAPDH
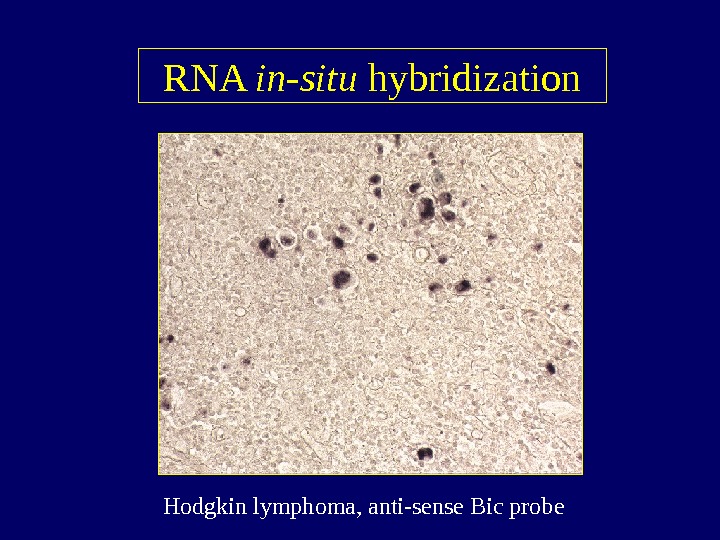
RNA in-situ hybridization Hodgkin lymphoma, anti-sense Bic probe
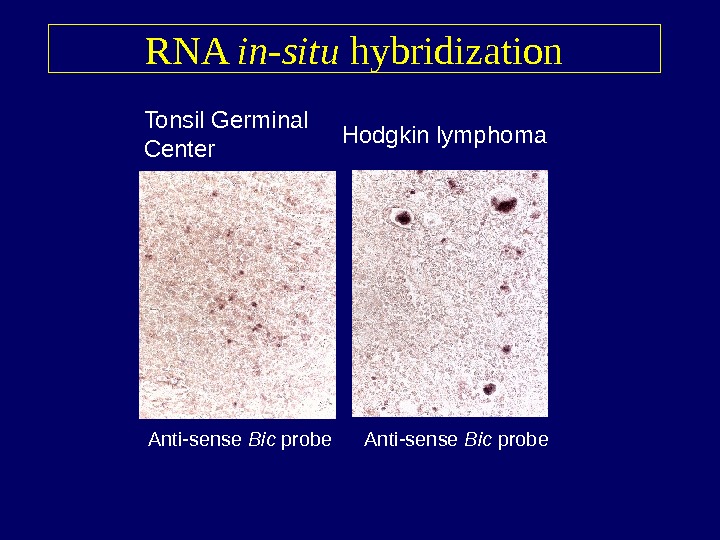
RNA in-situ hybridization Tonsil Germinal Center Hodgkin lymphoma Anti-sense Bic probe
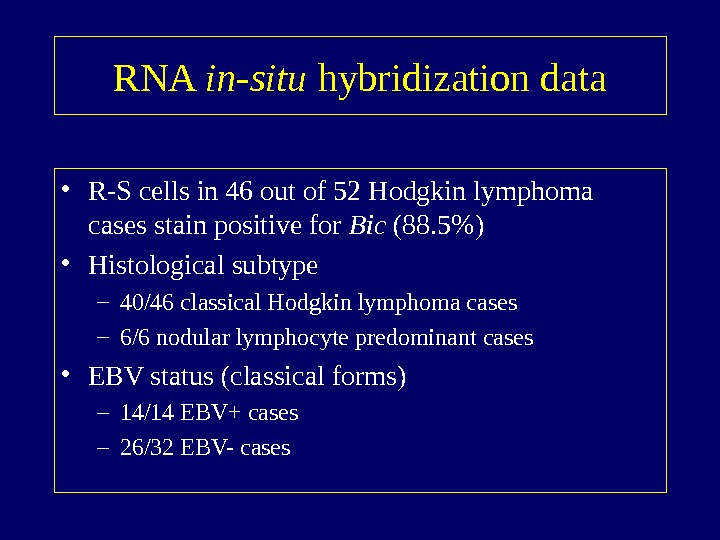
RNA in-situ hybridization data • R-S cells in 46 out of 52 Hodgkin lymphoma cases stain positive for Bic (88. 5%) • Histological subtype – 40/46 classical Hodgkin lymphoma cases – 6/6 nodular lymphocyte predominant cases • EBV status (classical forms) – 14/14 EBV+ cases – 26/32 EBV- cases
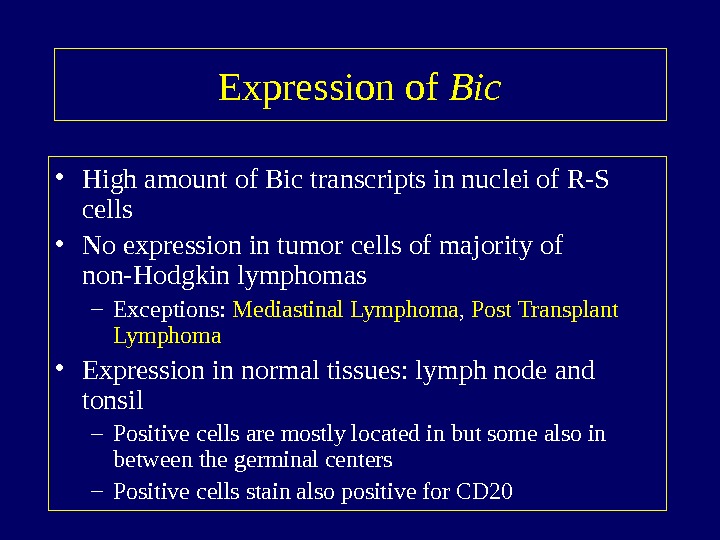
Expression of Bic • High amount of Bic transcripts in nuclei of R-S cells • No expression in tumor cells of majority of non-Hodgkin lymphomas – Exceptions: Mediastinal Lymphoma , Post Transplant Lymphoma • Expression in normal tissues: lymph node and tonsil – Positive cells are mostly located in but some also in between the germinal centers – Positive cells stain also positive for
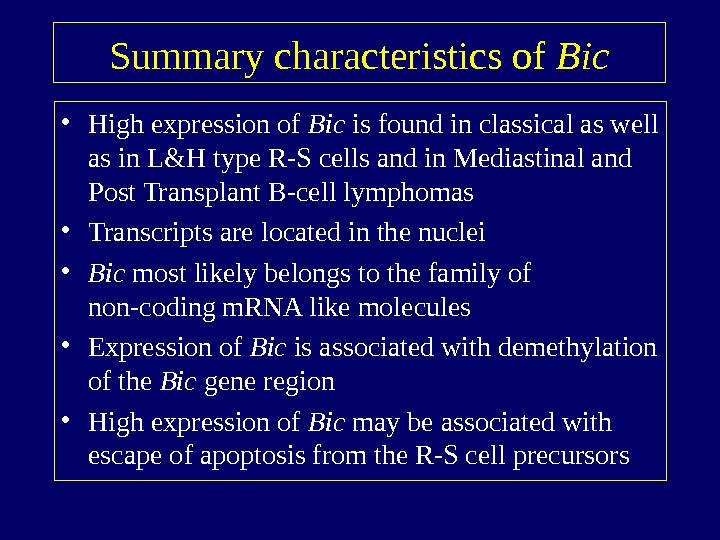
Summary characteristics of Bic • High expression of Bic is found in classical as well as in L&H type R-S cells and in Mediastinal and Post Transplant B-cell lymphomas • Transcripts are located in the nuclei • Bic most likely belongs to the family of non-coding m. RNA like molecules • Expression of Bic is associated with demethylation of the Bic gene region • High expression of Bic may be associated with escape of apoptosis from the R-S cell precursors
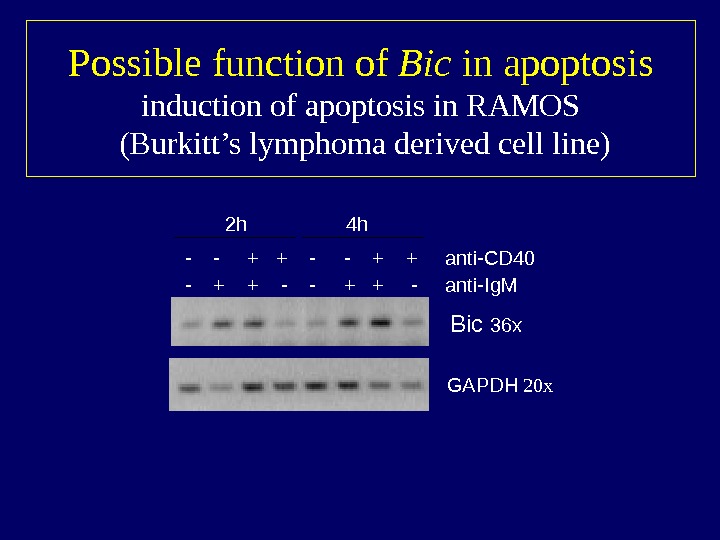
Possible function of Bic in apoptosis induction of apoptosis in RAMOS (Burkitt’s lymphoma derived cell line) Bic 36 x GAPDH 20 x- — + + — — + + anti-CD 40 — + + — — + + — anti-Ig. M 2 h 4 h
What is the goal? • To take advantage of the weak points of the R-S cells! – Dependence on Th 2 cells – Inherent apoptotic nature • But how to test?
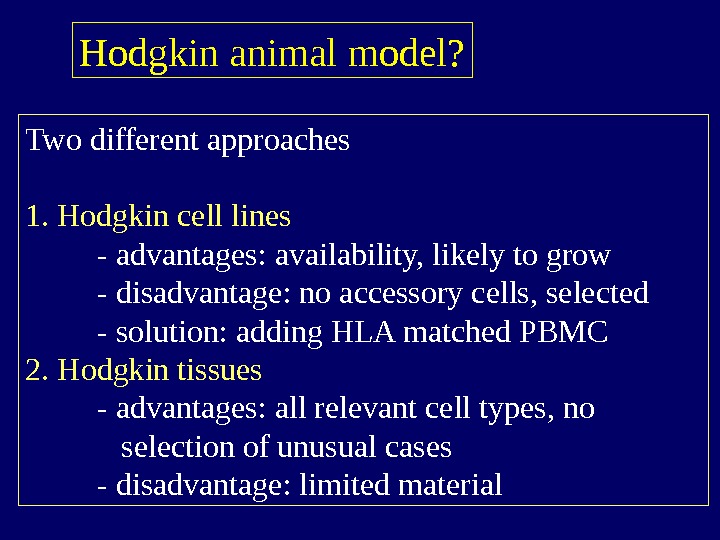
Hodgkin animal model? Two different approaches 1. Hodgkin cell lines — advantages: availability, likely to grow — disadvantage: no accessory cells, selected — solution: adding HLA matched PBMC 2. Hodgkin tissues — advantages: all relevant cell types, no selection of unusual cases — disadvantage: limited material
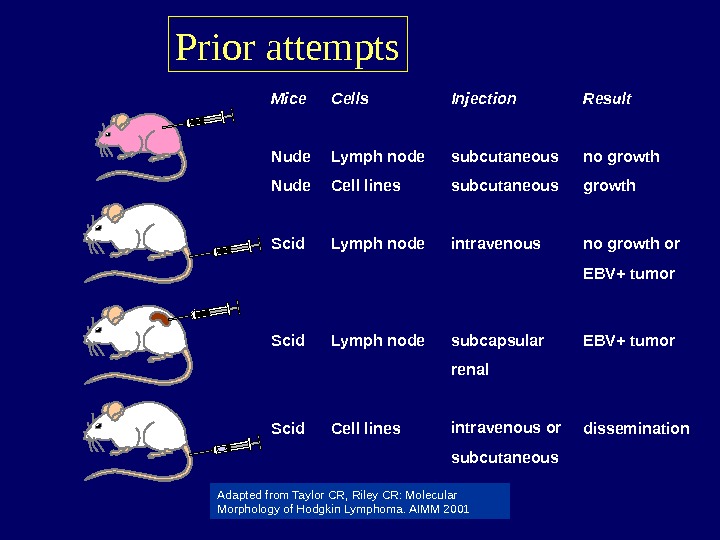
Prior attempts Mice Nude Scid Cells Lymph node Cell lines Injection subcutaneous intravenous subcapsular renal intravenous or subcutaneous Result no growth or EBV+ tumor dissemination Adapted from Taylor CR, Riley CR: Molecular Morphology of Hodgkin Lymphoma. AIMM
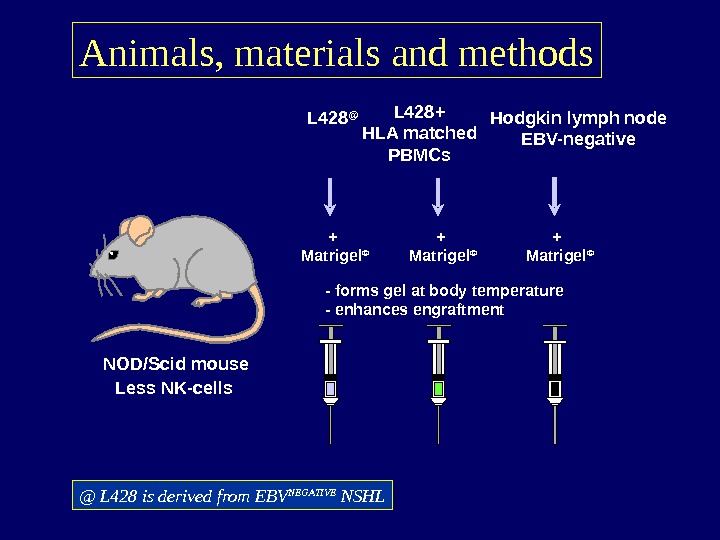
Animals, materials and methods NOD/Scid mouse Less NK-cells L 428 @ Hodgkin lymph node EBV-negative — forms gel at body temperature — enhances engraftment L 428+ HLA matched PBMCs + Matrigel © @ L 428 is derived from EBV NEGATIVE NSHL
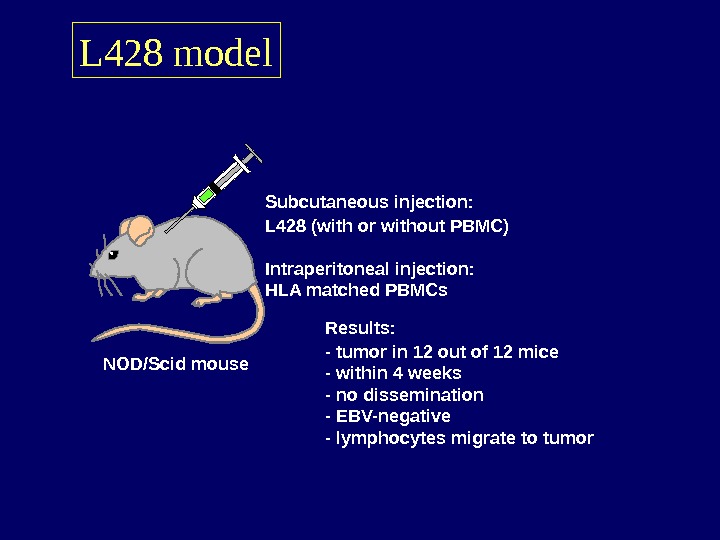
L 428 model NOD/Scid mouse Subcutaneous injection: L 428 (with or without PBMC) Intraperitoneal injection: HLA matched PBMCs Results: — tumor in 12 out of 12 mice — within 4 weeks — no dissemination — EBV-negative — lymphocytes migrate to tumor
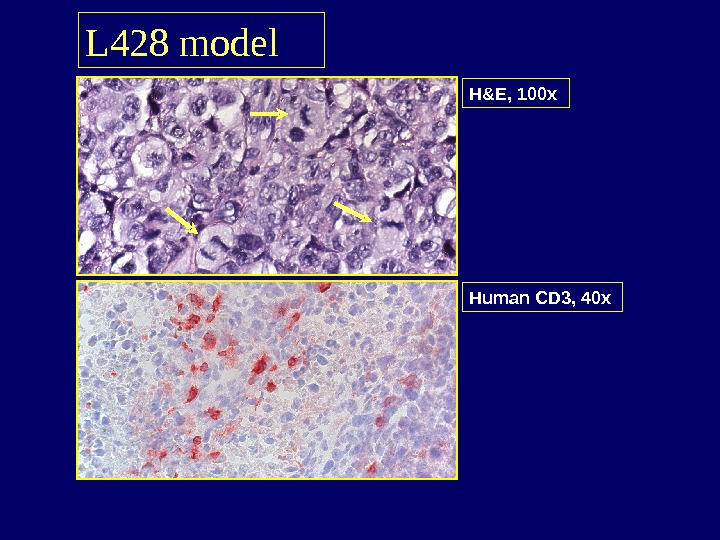
L 428 model H&E, 100 x Human CD 3, 40 x
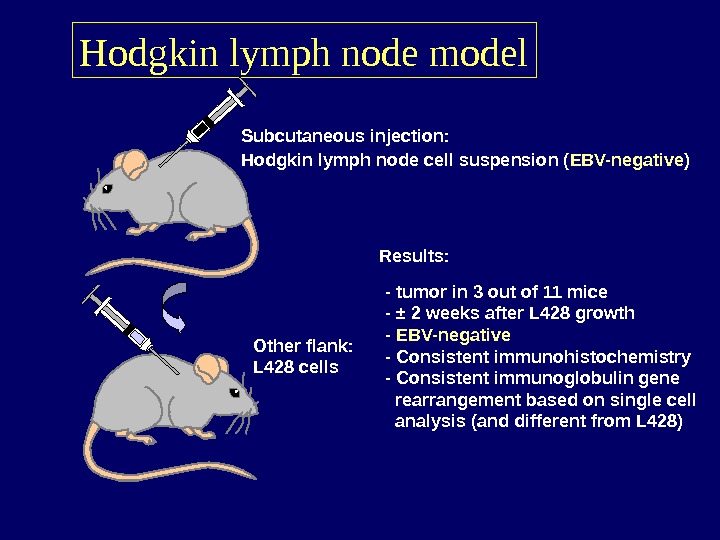
Hodgkin lymph node model Subcutaneous injection: Hodgkin lymph node cell suspension ( EBV-negative ) Other flank: L 428 cells Results: — tumor in 3 out of 11 mice — ± 2 weeks after L 428 growth — EBV-negative — Consistent immunohistochemistry — Consistent immunoglobulin gene rearrangement based on single cell analysis (and different from L 428)
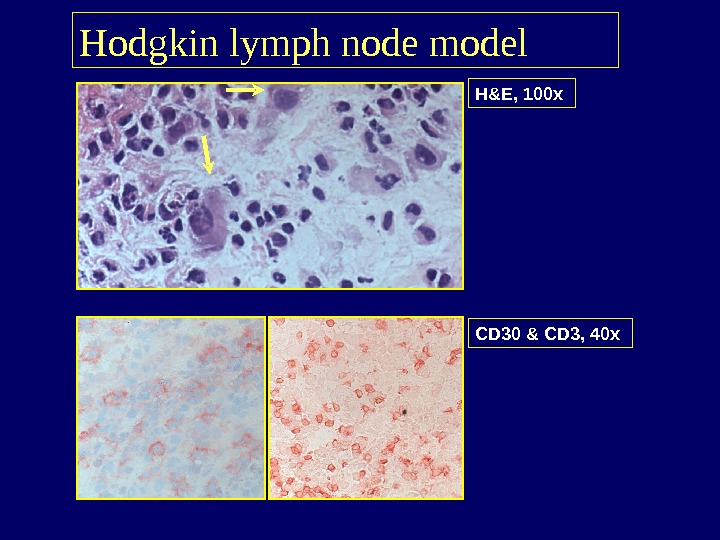
H&E, 100 x Hodgkin lymph node model CD 30 & CD 3, 40 x
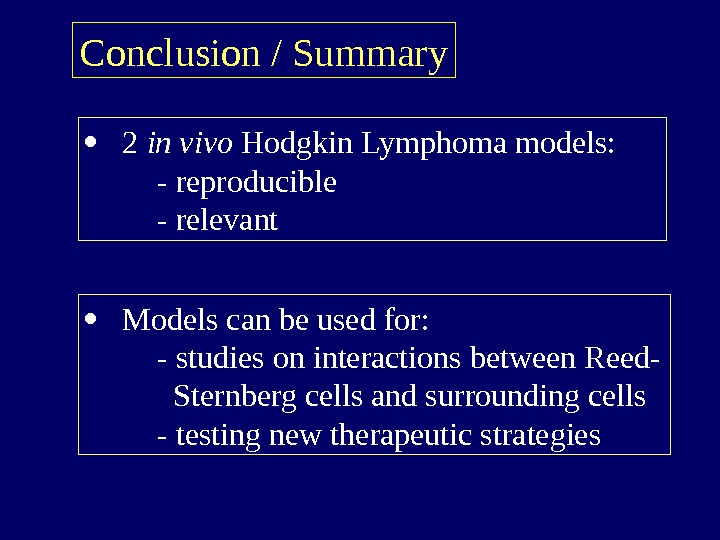
Conclusion / Summary 2 in vivo Hodgkin Lymphoma models: — reproducible — relevant Models can be used for: — studies on interactions between Reed- Sternberg cells and surrounding cells — testing new therapeutic strategies
Hodgkin Research Group Department of Pathology & Laboratory Medicine University Hospital Groningen • Debora de Jong, BSc • Geert Harms, BSc • Jane Briggs, BSc • Arjan Diepstra, MD • Joost Kluiver, MSc • Renate Rust, BSc • Cigdem Atayar, MD • Anneke Bosga, BSc • Anke van den Berg, Ph. D • Lydia Visser, Ph. D • Suat Cheng Peh, MD, Ph. D (Kuala Lumpur, Malaysia) • Ewerton Maggio, MD, Ph. D (Curitiba, Brazil)