
Презентация Wildlife and Fisheries Resource Governance


wildlife_and_fisheries_resource_governance.ppt
- Размер: 752.5 Кб
- Количество слайдов: 92
Описание презентации Презентация Wildlife and Fisheries Resource Governance по слайдам
The fundamental Problem of Wildlife and Fisheries Resource Governance
5) Wildlife : — a) Importance of wildlife : — i) Wildlife helps to preserve biodiversity. ii) Wild life helps to maintain food chains and food web. iii) We get useful products from wild life like food, medicines, leather, bones, honey, lac etc. b) Conservation of wildlife : — i) Preserving the natural habitats of animals. ii) Banning poaching of animals. iii) Protecting endangered species of animals. iv) Setting up of wildlife sanctuaries, national parks, biosphere reserves etc.
Contents 1. Utilization of common property resources 2. Fisheries and economic development 3. The simple sustainable fisheries model 4. Efficient fisheries 5. Unmanaged common property fisheries 6. Fisheries over time: Dynamics 7. Uncertainty in fisheries 8. Special fisheries: Schooling and migration 9. Multispecies fisheries
Lecture 1 Utilization of Common Property Resources: Opportunities and limitations • The economic (and social) problem is to arrange production and consumption so as to maximize national economic welfare. • Opportunities for generating economic welfare measured by the GDP (gross domestic production) • So, the economic governance problem is to find ways to maximize the GDP
Ways to solve the economic problem • There are essentially three basic types of economic organizations to deal with the problem: – The traditional economy – The command economy – The market economy • The first two generally do not solve the problem ! • The market system solves the economic problem under certain circumstances (‘the invisible hand’). – All goods traded in markets – Full information – Perfect competition
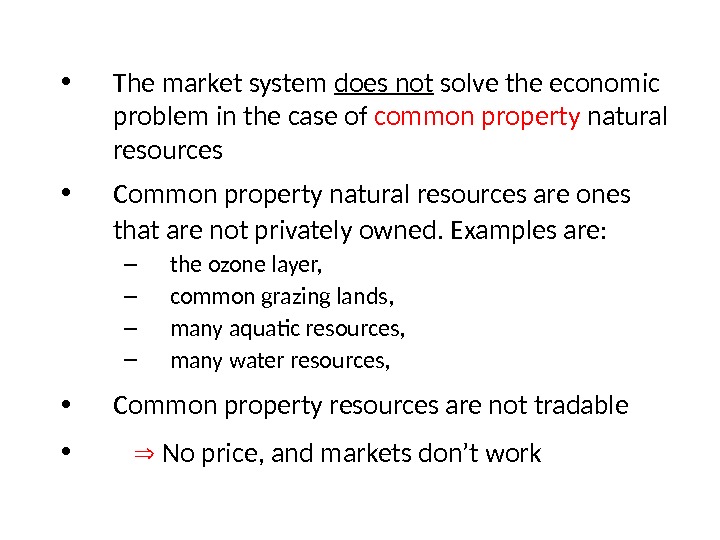
• The market system does not solve the economic problem in the case of common property natural resources • Common property natural resources are ones that are not privately owned. Examples are: – the ozone layer, – common grazing lands, – many aquatic resources, – many water resources, • Common property resources are not tradable • No price, and markets don’t work
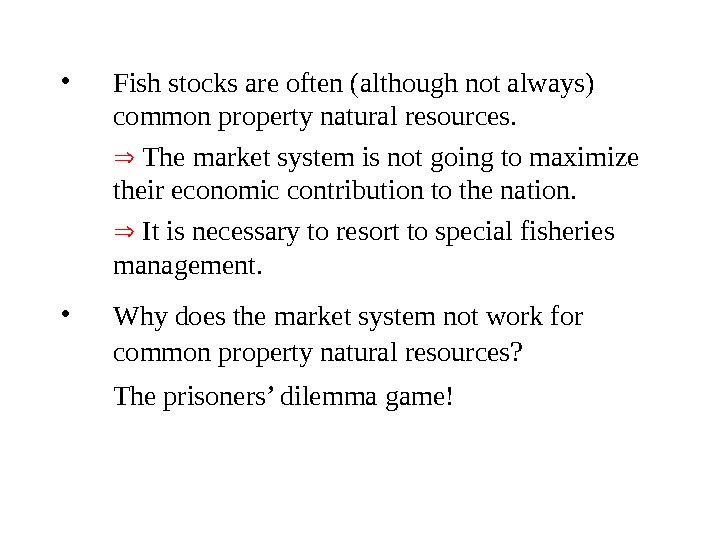
• Fish stocks are often (although not always) common property natural resources. The market system is not going to maximize their economic contribution to the nation. It is necessary to resort to special fisheries management. • Why does the market system not work for common property natural resources? The prisoners’ dilemma game!
Simple fishing game (An example of the prisoners’ dilemma) Two fishers Options: fish full-out or fish prudently 100 -1 Prudent 505 Full Prudent. Full A B 100 -1 Prudent 505 Full Prudent. Full B APay-off matrix for A Pay-off matrix for B Best policy for both A & B is to fish full out !
This (in essence) is ““ The tragedy of common property resources” (Hardin 1968) People misuse natural resources because of lack of private of property rights
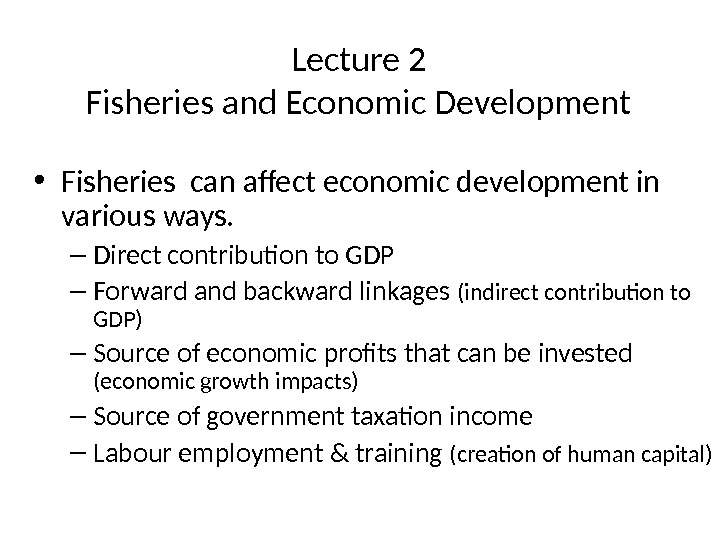
Lecture 2 Fisheries and Economic Development • Fisheries can affect economic development in various ways. – Direct contribution to GDP – Forward and backward linkages (indirect contribution to GDP) – Source of economic profits that can be invested (economic growth impacts) – Source of government taxation income – Labour employment & training (creation of human capital)
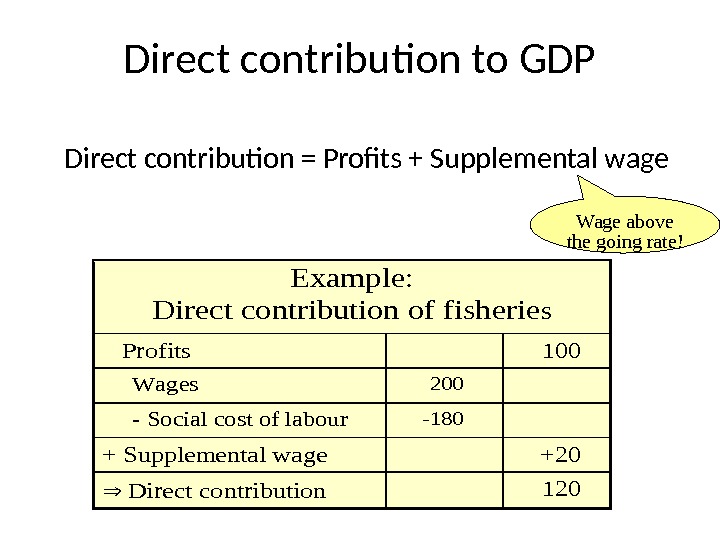
Direct contribution to GDP Direct contribution = Profits + Supplemental wage Wage above the going rate!Example: Direct contribution of fisheries Profits 100 Wages 200 — Social cost of labour -180 + Supplemental wage +20 Direct contribution
Fishing Industry. Backward linkages (inputs) Forward linkages (outputs)Linkages
Linkages • Backward Linkages (economic surplus there? ) – Inputs – Maintenance – Shipbuilding, gear ……. . etc, etc. • Forward linkages (economic surplus there? ) – Processing – Marketing – Transport…………etc. , etc. ==> Demand for labour
Multiplier Effects • The linkages and profits generated in the fishing industry give rise to multiplier effects in the economy. • These multiplier effects can expand the GDP far in excess of the direct impact of the fishing industry
Types of multipliers 1. Links multipliers – The fishery expands (or contracts) other industries via linkages 2. Demand multipliers – Income generated in the fishery leads to demand for other goods and services 3. Investment multipliers – Income generated in the fisheries (esp. profits) may be invested and thus lead to economic growth
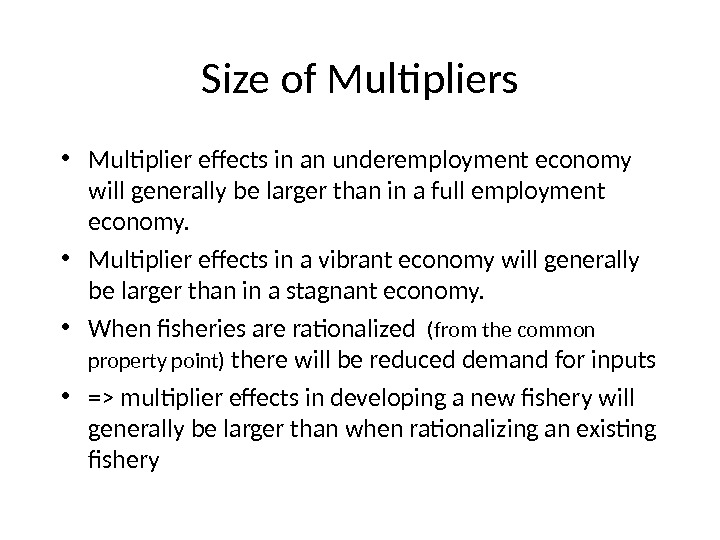
Size of Multipliers • Multiplier effects in an underemployment economy will generally be larger than in a full employment economy. • Multiplier effects in a vibrant economy will generally be larger than in a stagnant economy. • When fisheries are rationalized (from the common property point) there will be reduced demand for inputs • => multiplier effects in developing a new fishery will generally be larger than when rationalizing an existing fishery
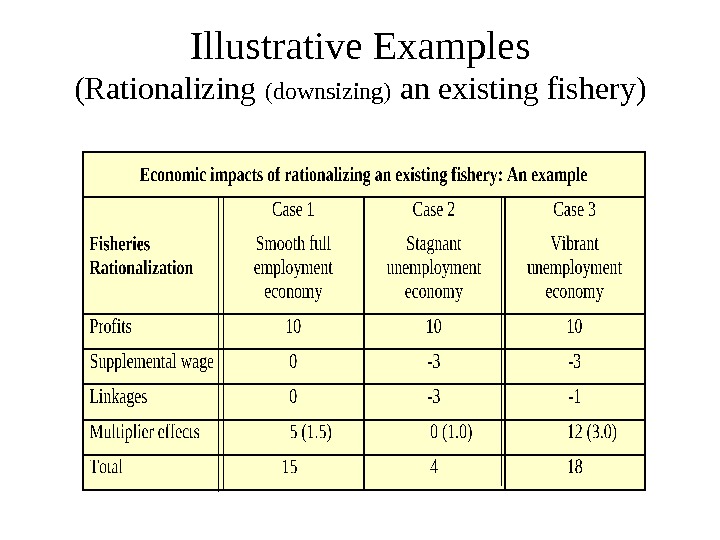
Illustrative Examples (Rationalizing (downsizing) an existing fishery)
Illustrative Examples (Developing a new fishery)
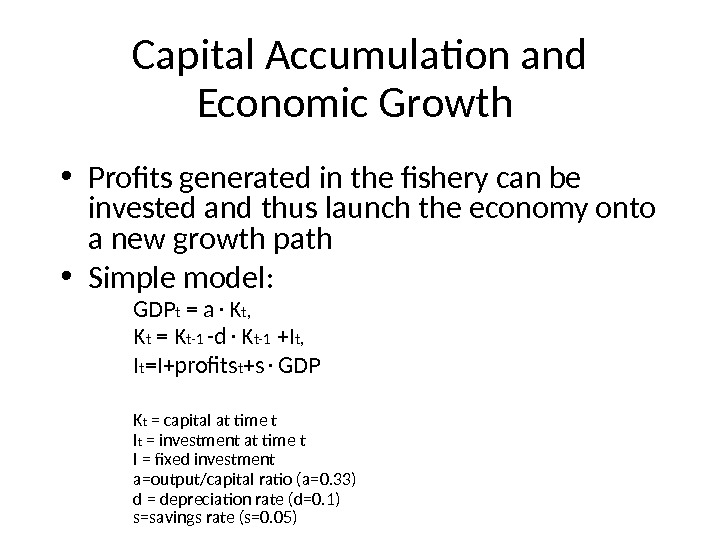
Capital Accumulation and Economic Growth • Profits generated in the fishery can be invested and thus launch the economy onto a new growth path • Simple model: GDP t = a K t, K t = K t-1 -d K t-1 +I t, I t =I+profits t +s GDP K t = capital at time t I t = investment at time t I = fixed investment a=output/capital ratio (a=0. 33) d = depreciation rate (d=0. 1) s=savings rate (s=0. 05)
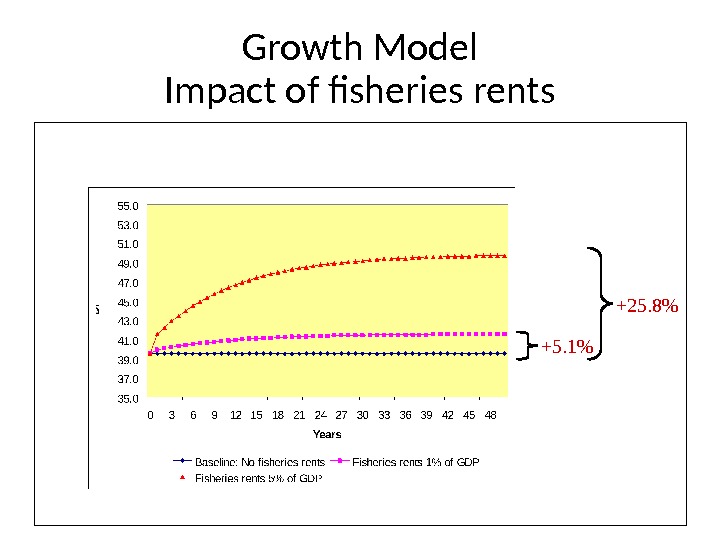
Growth Model Impact of fisheries rents +5. 1% +25. 8%
Fisheries contribution to GDP Direct contribution Linkages. Multiplier effects Growth effects Direct contribution is the foundation ! Without it there can be no multiplier or growth effects, (. . . unless generated by linkages).
Other important considerations • Fisheries as a source of taxation revenue • Fisheries as a source of foreign exchange • Fisheries as a source of – education, – know-how, – labour-training – entrepreneurship
Lecture 3 The Simple Sustainable Fisheries Model 1. Here the simple aggregate fisheries model 2. Sufficient to understand the essentials of the fisheries problem
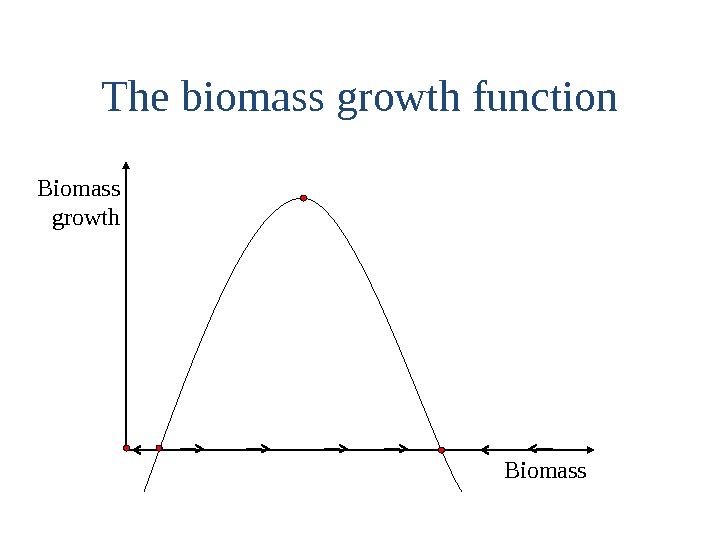
The biomass growth function Biomass growth
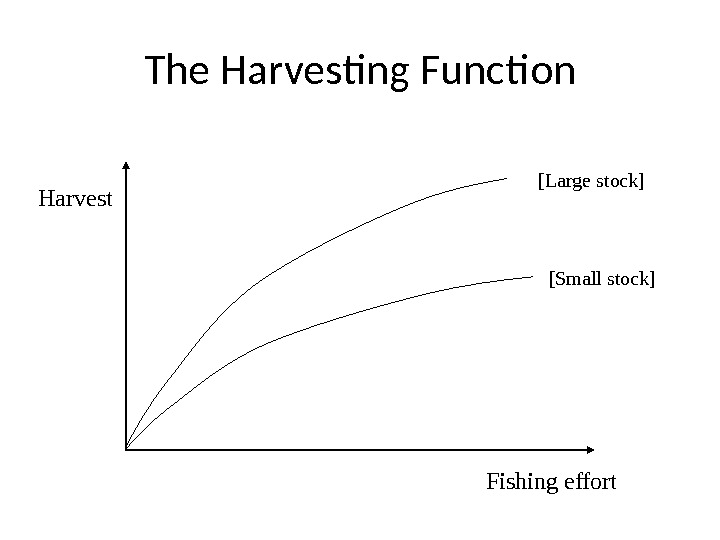
The Harvesting Function Harvest Fishing effort [Small stock][Large stock]
The Sustainable Yield (harvest) Sustainable yield Fishing effort
The Sustainable Biomass Sustainable biomass Fishing effort
Harvesting costs Costs, $ Fishing effort
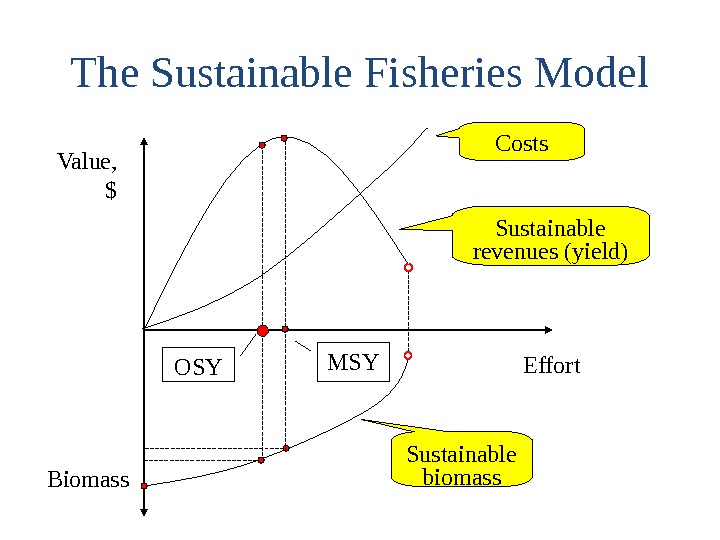
The Sustainable Fisheries Model Value, $ Effort Biomass Costs Sustainable revenues (yield) Sustainable biomass. Profits
Lecture 4 Efficient Fisheries 1. Efficient fisheries are those that maximize contribution to social welfare a. Must be Pareto efficient b. maximize difference between revenues and costs c. Same as maximizing profits, if prices are correct. d. Distributional considerations may modify this – but be careful!.
The Sustainable Fisheries Model Value, $ Effort Biomass Costs Sustainable revenues (yield) Sustainable biomass. MSY OSY
Nota Bene 1. It is the OSY-point (optimal sustainable yield ) that is socially optimal 2. MSY is not socially optimal 3. OSY implies greater biomass than MSY 4. OSY is sustainable 5. OSY entails little risk of stock collapse 6. OSY generally generates substantial profits (rents)
Changing parameters 1. Costs (e. g. price of fuel) 2. Output price 3. Biomass growth
Lower costs Value, $ Effort Biomass Sustainable biomass. MSY OSY
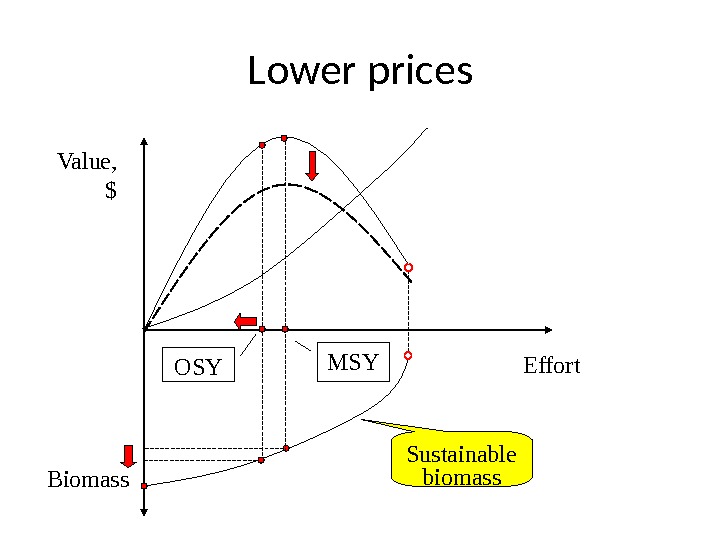
Lower prices Value, $ Effort Biomass Sustainable biomass. MSY OSY
Lower biomass growth Value, $ Effort Biomass ?
Unprofitable Fishery Value, $ Effort Biomass Costs Sustainable revenues (yield) Sustainable biomass. MSY OSY
Lecture 5 Unmanaged Common Property Fisheries (Sometimes called the competitive fishery) 1. Fishing effort converges to a point where there a. No profits ( poor fishermen) b. Biomass is low (below OSY-level) c. There is an increased and often substantial risk of a stock collapse d. Harvests are often less than at the OSY
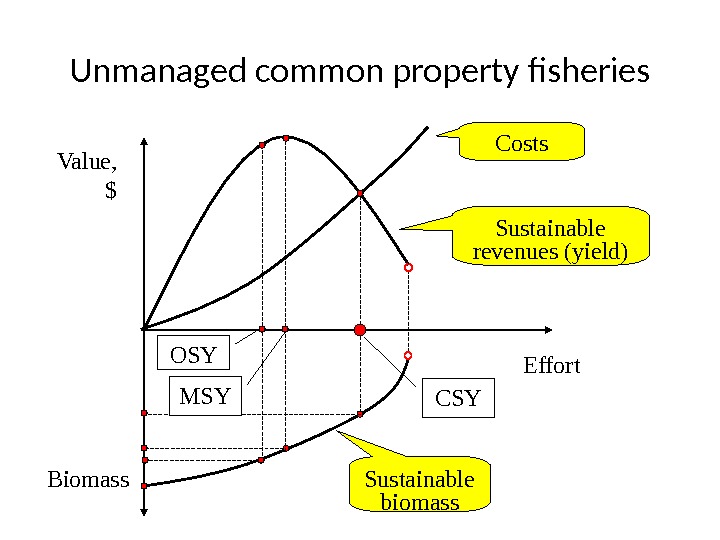
Unmanaged common property fisheries Value, $ Effort Biomass Costs Sustainable revenues (yield) Sustainable biomass. OSY CSYMSY
Common property fisheries and technical progress Value, $ Effort Biomass Sustainable biomass. OSY CSYMSY
Nota bene 1. The same applies to price increases, cost reductions, subsidies etc. 2. There are no long term benefits, but an increased risk of a stock collapse, i. e. Less sustainability 3. Isn´t this in accordance with history?
The fundamental source of the problem 1. Prisoners’ dilemma 2. Lack of private property rights (the wrong institutional structure) 3. Externalities 4. It is not! a. Lack of understanding by fishermen b. Mistakes by fishermen
The common property problem is 1. Universal a. It is found all over the world in all sorts of situations b. All common property fisheries exhibit these features 2. There are no counterexamples a. Claimed counterexamples are rare b. They turn out to be some sort of management structures that alleviate the CPP c. Even so they are generally just slightly better than the competitive equilibrium 3. One of the most solid laws of all of economics
Is there anything good about common property fisheries? • People have mentioned: 1. Increased (maximum) employment 2. More equitable 3. Politically feasible • But does this really hold water?
Lecture 6 Fisheries over Time: Dynamics 1. Real fisheries evolve over time 2. They may take a long time to reach an equilibrium (constant or sustainable state) 3. As a result, equilibrium models constitute a very limited description of real fisheries. (At best they describe a long term tendency) 4. Therefore, we need dynamic models
5. The evolution of fisheries over time is a complicated and technically demanding subject 6. A convenient analytical tool is provided by“ phase diagrams in biomass-effort space ” 7. That consists of: a. Biomass equilibrium curves b. Effort equilibrium curves c. Derivation of the joint movement of biomass and effort over time
8. A theoretical example: () xxxy yex ce eexe b 2 Dynamic Fisheries I (The common property case)
Fisheries Dynamics : (The common property or competitive case ) Biomass, x. Effort, e Competitive Optimal 0 e& 0 x&
9. Note a. The economic equilibrium curve ( ) corresponds to zero profits b. The competitive equilibrium corresponds to zero profits 10. Note, the danger of stock extinction a. In equilibrium b. Along the adjustment path 11. Note the impact of a. Increased fish price b. Cost changes c. Technological advances d. Subsidies 0 e&
Technological Advance Effort, e 0 e& 0 x&
Dynamic Fisheries II (The optimal case) 1. It is not possible to jump immediately to the long run optimal equilibrium 2. Moreover, due to varying biological, economic and environmental conditions, it is not possible in reality to stay at the optimal equilibrium 3. Therefore, the task is always to select the optimal adjustment path to the optimal equilibrium
Examples Adjustment Paths. A Stock Rebuilding Programme Time Fisheries rents Current fisheries policy Stock rebuilding fisheries policy
Fishable stock 1984: 1052 thousand tonnes. Fishable stock 1994: 677 thousand tonnes 000102030405060708091011121314 Year 0 100 200 300 400 500 Catch in 1000 metric tonnes NEI & MRI: From 1994 RA: Frá
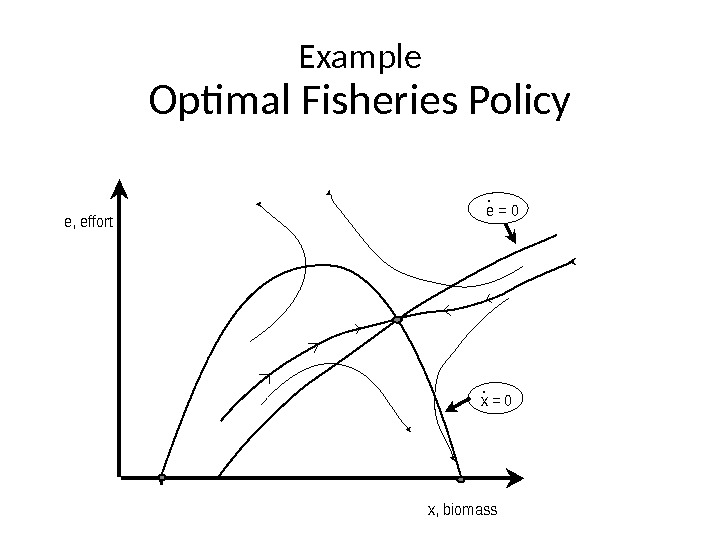
4. Economically, it is very important to find and implement the optimal adjustment path — at least approximately 5. Theoretically, optimal paths should look something like this:
Example Optimal Fisheries Policye, effort x, biomass e = 0 x = 0. .
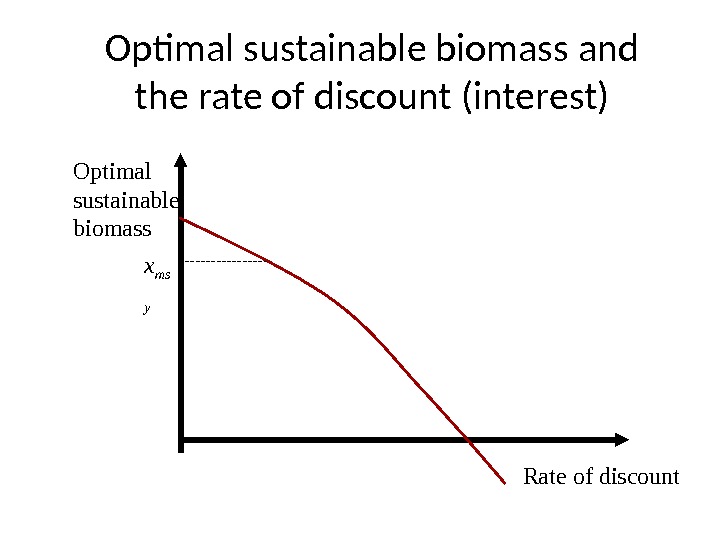
6. In optimal dynamics, the rate of discount (interest) plays an important role a. The higher the rate of discount, the lower the optimal equilibrium biomass b. If the rate of discount is high enough, the optimal equilibrium may exceed the MSY- effort level. c. The reason is that current benefits become relatively more attractive than future ones
Rate of discount. Optimal sustainable biomass x ms y. Optimal sustainable biomass and the rate of discount (interest)
Lecture 7 Uncertainty in Fisheries • Fisheries are subject to a great deal of uncertainty – Therefore the outcome of a fisheries management policy is always uncertain – Therefore, even a conservative policy may lead to a stock collapse – Therefore, even a reckless policy may not lead to detrimental consequences
Sources of uncertainty 1. Lack of knowledge – Model (parameters & relationships ) (Estimation problems) – State of the system (Measurement problems) – Levels of control variables (Measurement and control problems) 2. Fundamental randomness in nature – Recruitment – Feed availability – Environmental conditions – Economic conditions
Implications of uncertainty 1. The outcomes of a given fishery policy are subject to risk – I. e. may turn out differently than expected 2. Equilibrium will never be maintained – Random shocks will always disturb the system
Appropriate responses • Apply optimal decision making under risk – Maximize the expected value of any action • Risk amounts to a cost (if risk averse) • Therefore the optimal course is to avoid undue risk • This suggests – Less risky fisheries policy – I. e. normally lower exploitation levels (less catches, higher biomass)
The effects of risk Value, $ Effort Biomass OSY (no risk )OSY Risk “cost” Effort: reduced Biomass: increased
Lecture 8 Special Fisheries Two topics I. Schooling species II. Migratory fish stocks
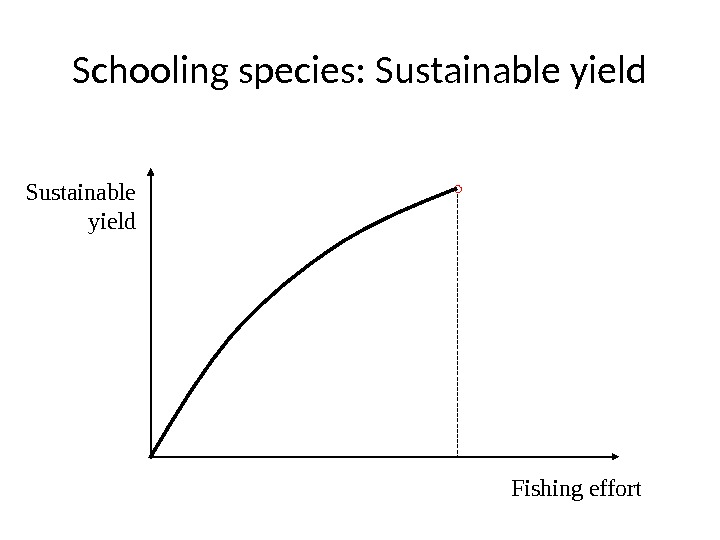
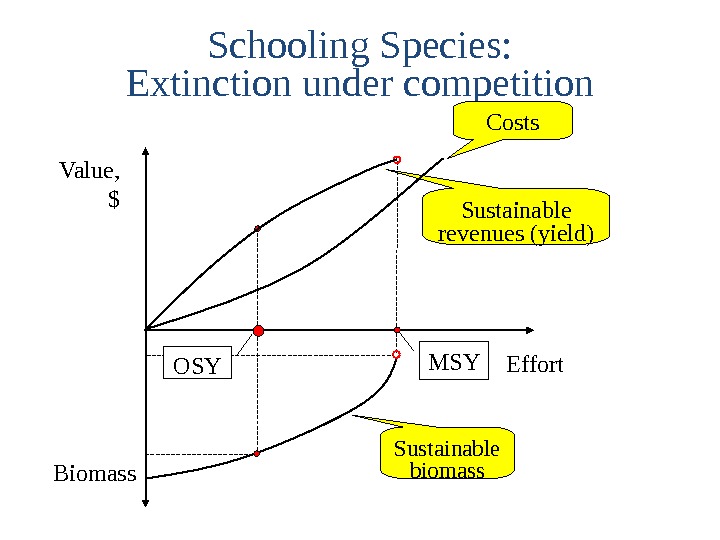
I. Schooling species • Defining characteristic: Stock size does not affect harvesting – This holds primarily for pelagic species • This implies: – Catch per unit effort, CPUE, is not a measure of stock size – Serious danger of extinction, especially under competitive fishing
Schooling species: Sustainable yield Sustainable yield Fishing effort
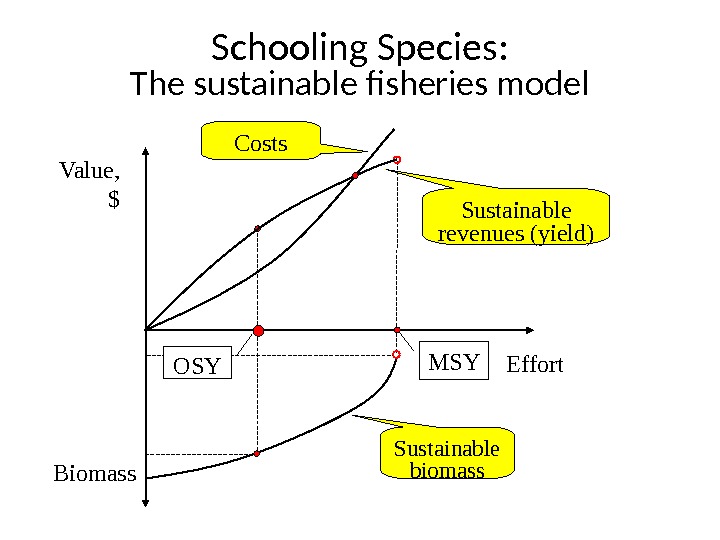
Schooling Species: The sustainable fisheries model Value, $ Effort Biomass Costs Sustainable revenues (yield) Sustainable biomass MSY OSY
Schooling Species: Extinction under competition Value, $ Effort Biomass Costs Sustainable revenues (yield) Sustainable biomass MSY OSY
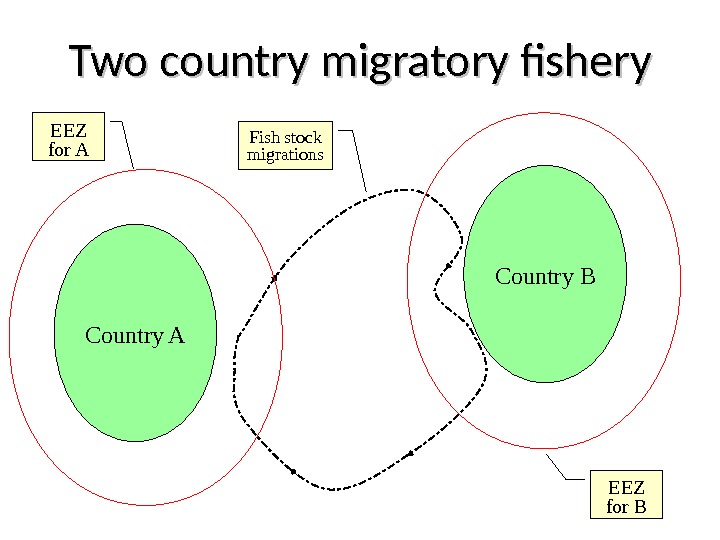
II. Migratory fish stocks • Defining characteristic: Distance from port varies over time • It follows that: – The economics of harvesting vary over time – The optimal fisheries policy varies over time • Similar impact from other varying conditions including: – Catchability – Weather – Prices etc.
Migrations: An example Country Fish stock migrations
The economics of harvesting Time. Potential profits, $
Optimal Harvesting Periods Time. Potential profits, $ Fishing period 1 Fishing period
Multi-national utilization of a migratory stock • Marked tendency to evolve as a common property, unmanaged fishery – Excessive fishing effort and capital – Loss of economic rents – Low biomass – Risk of extinction • However, there is generally room for mutually advantageous agreements
Two country migratory fishery Country A Fish stock migrations Country B EEZ for BEEZ for
Lecture 9 Multispecies Fisheries • All fish stocks are embedded in an ecological system (ecosystem) • The ecosystem generally contains a number of different species • These species interact in a variety of ways – Predation – Competition – Symbiosis
• Ecological interactions lead to complications – Multiple equilibria – Strange dynamics – Chaos • Even when there are no ecological interactions, the economics of multi-species fisheries can lead to equally complicated dynamics • Multi-species relationships may affect – Stocks – Harvests – Costs – Profits
Example of chaos • Two species • Predator and prey • Consider biomass path of prey • Two cases: – No harvesting of predator – Heavy harvesting of predator
Biomass path of prey No harvesting of predator 50100150200 0. 5 1 Ye ars Biom ass
Biomass path of prey Harvesting of predator 50100150200 0. 5 1 Ye ars Biom ass
Appropriate responses • Sensible fisheries policy/management must take account of multi-species relationships • Under multi-species conditions, optimal fishing effort on one species will depend on the fishing effort for all the other species • It follows that the different fishing efforts must be set simultaneously
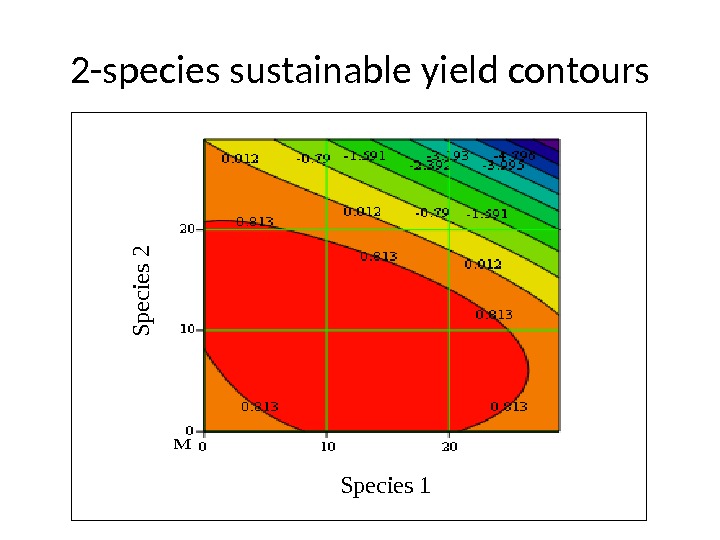
Sustainable yield for one species in a multi-species context Fishing effort. Sustainable yield High effort for other species Low effort for other species
2 -species sustainable yield contours. M Species 1 S p e c ie s
An Example: Icelandic cod & capelin • Cod prays on capelin • Cod is much more valuable
Sustainable yields Cod Blue dots: Maximum capelin stock Red line: Average capelin stock Green dash: A very small capelin stock Capelin: Green dash: A very small cod stock Red line: Average cod stock Blue dots: Large cod stock
Icelandic cod and capelin: O ptimal joint harvesting paths Only cod fishing Only capelin fishing. No fishing Cod and capelin fishing Stock of capelin. Stock of cod
Ecosystem fisheries • A special case of multispecies fisheries – Several species – Jointly caught – Selectivity impossible Harvesting takes a proportion of all biomasses • May be characteristic of many tropical fisheries • But is it really true? – Fishing technology – Fishing techniques
Implications • Some species may be wiped out before ecosystem extraction is optimized • This leads to problems of irreversibilities – The high value of depleted (extinct) species – But is it really extinct? • This also leads to technical problems of analysis – Nonconvexities
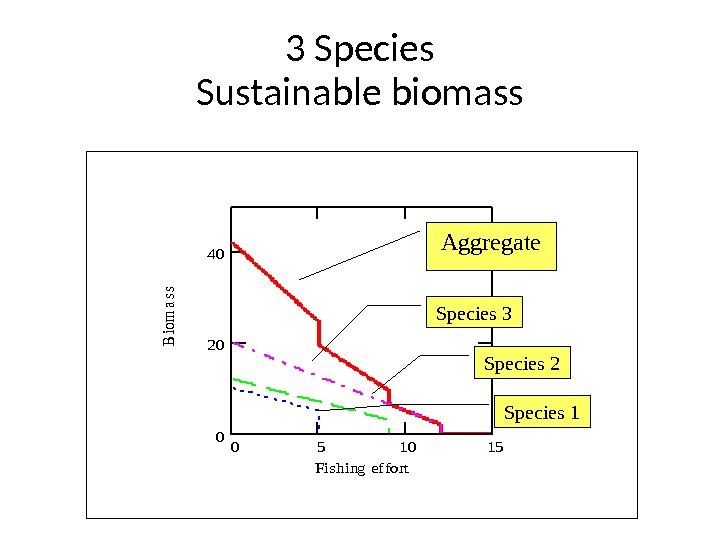
3 Species Sustainable biomass 051015 0 20 40 Fishing ef fort B iom ass Aggregate Species 3 Species 2 Species
3 Species Sustainable yield 0510 0 50 100 Fishing ef fort Y ield Aggregate Species 3 Species 2 Species
What to do? • Regard as one joint biomass? • Likelihood of wiping out species. – Much reduced for optimal fishing • Cost of wiping out. How costly is it? – If very costly, cannot exploit ecosystem
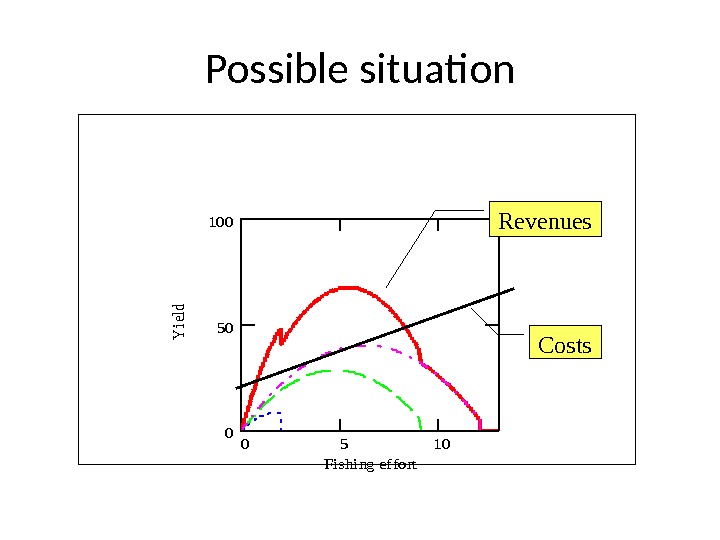
Possible situation 0510 0 50 100 Fishing ef fort Y ield Costs. Revenues
What to do? • Avoid extinction by – Marine reserves and possibly rotational harvesting – Marine reserves (conservatories) and re-introductions • Develop selective fishing technology
ENDEN