Презентация regional program monitoring amp evaluation


regional_program_monitoring_amp_evaluation.ppt
- Размер: 1.2 Mегабайта
- Количество слайдов: 109
Описание презентации Презентация regional program monitoring amp evaluation по слайдам
Мониторинг и оценка ( M&E ) региональных программ Monitoring and Evaluation ( M&E ) of regional programs
Outline • Introduction • Overview of Evaluation in Developed and Developing Countries • Results-Based Monitoring and Evaluation ( M&E ) • Approaches to Evaluation
Introduction: Importance of evaluation • There are growing pressures in developing countries to improve performance of their public sectors • Involves reform by tracking results of government or organizational actions over time • Is a management tool
The Power of Measuring Results • If you do not measure results, you cannot tell success from failure • If you can not see success, you can not reward it • If you can not reward success, you are probably rewarding failure • If you can not see success, you can not learn from it • If you can not recognize failure, you can not correct it • If you can demonstrate results, you can win public support
• Overview of Evaluation in Developed and Developing Countries
Evaluation in Developed Countries • Most of the 32 OECD countries have mature M&E systems • Earliest adopters had: – democratic political systems – strong empirical traditions – civil servants trained in social science – efficient administrative systems and institutions
A Strong Evaluation Culture Exists when: 1. Evaluation takes place in many policy domains 2. Supply of evaluators on staff who have mastered methods of different specialized disciplines 3. National discourse exists on evaluation 4. Profession exists with own societies or meetings with discussion of norms and ethics (continued on next slide — 1 of 3)
A Strong Evaluation Culture Exists when: (cont. ) 5. Institutional arrangements exist in government for conducting evaluations and disseminating to decision makers 6. Institutional arrangements present in legislative bodies for conducting evaluations and disseminating them to decision makers (continued on next slide- 2 of 3)
A Strong Evaluation Culture Exists when: (cont. ) 7. An element of pluralism exists within each policy domain 8. Evaluation activities also take place within the supreme audit institution 9. Evaluations focus not only on technical production or relation between inputs and outputs but also on program or policy outcomes IPDET ©
Approaches • Whole-of-Government • Enclave • Mixed
Whole-of-Government Approach • Adopted in some early M&E pioneer countries • Broad-based, comprehensive M&E at all levels of government • Millennium Development Goals created impetus • Challenging where different ministries are at different stages
Enclave Approach • More limited, focus on one part or sector of government (a ministry or the cabinet) • Strategy: – begin at local, state, or regional governmental level – pilot evaluation systems in a few key ministries or agencies
Mixed Approach • Blended whole-of-government and enclave approaches • Some areas have a comprehensive approach; others more sporadic attention
Evaluation in Developing Countries • Face similar and different challenges • Weak political will slows progress • Difficulties in inter-ministerial cooperation and coordination can impede progress
Evaluation Systems in Developing Countries • New evaluation systems need: – political will in the government – highly placed champions willing to assume political risks – credible institutions
Developing Countries Need to: • Establish a foundation for evaluation – statistical systems and data, as well as budgetary systems • Routinely collect baseline information • Train officials in data collection, monitoring methods, and analysis
Development Assistance Committee (DAC) Criteria for Evaluating Development Assistance • Relevance • Effectiveness • Efficiency • Impact • Sustainability
• Results-Based Monitoring and Evaluation
Results-Based Monitoring IPDET © 2012 19 • Results-based monitoring (what we call “ monitoring ” ) is a continuous process of collecting and analyzing information on key indicators, and comparing actual results to expected results
Results-Based Evaluation IPDET © 2012 20 • Results-based evaluation is an assessment of a planned, ongoing, or completed intervention to determine its relevance, efficiency, effectiveness, impact, and/or sustainability
Difference between Results-Based Monitoring and Results-Based Evaluation IPDET © 2012 21 • Monitoring: tracks movement of indicators towards the achievement of specific, predetermined targets • Evaluation: takes a broader view, considering progress toward stated goals, the logic of the initiative, and its consequences • Both are needed to better manage policies, programs, and projects
Brief Introduction to Theory of Change IPDET © 2012 22 • Theory of change is a representation of how a project, program or policy initiative is expected to lead to the outcomes and impacts. It also identifies the underlying assumptions being made with respect to how the change will occur.
Components of Theory of Change IPDET © 2012 23 • Inputs – financial, human, and material resources • Activities – tasks undertaken • Outputs – products and services • Outcomes – behavioral changes • Impacts – long term widespread improvement in society
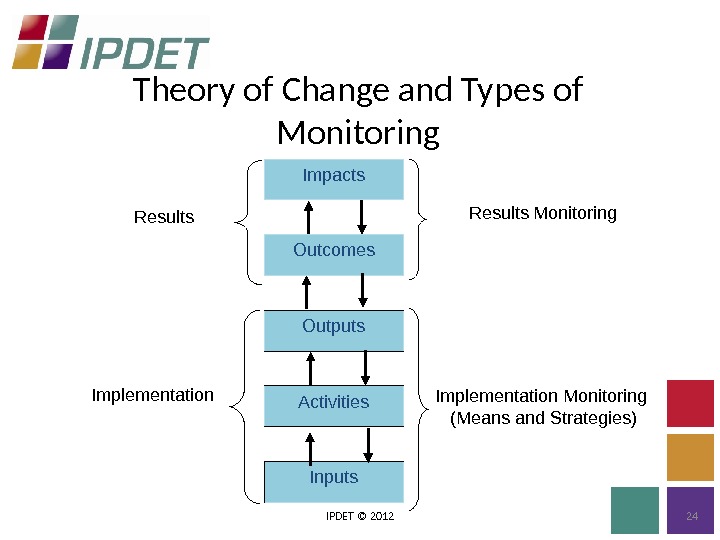
Theory of Change and Types of Monitoring IPDET © 2012 24 Results Monitoring Implementation Monitoring (Means and Strategies)Outcomes Impacts Results Inputs. Activities Outputs Implementation
Performance Indicators IPDET © 2012 25 • A variable that tracks the changes in the development intervention or shows results relative to what was planned • The cumulative evidence of a cluster of indicators is used to see if an initiative is making progress
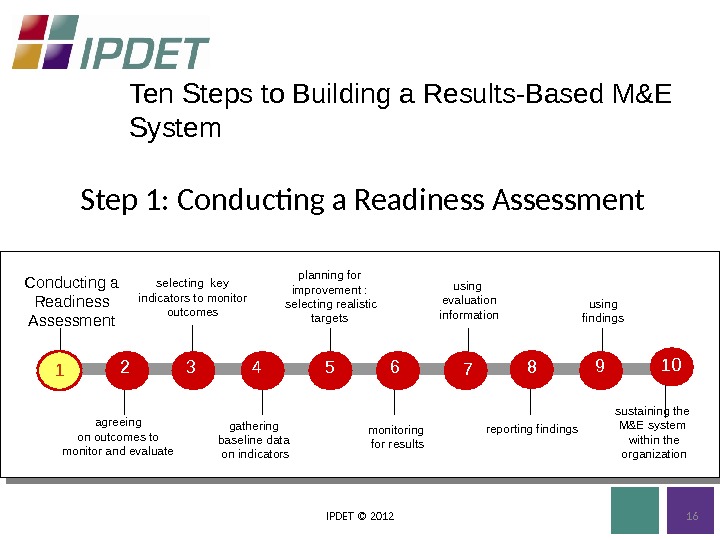
Step 1: Conducting a Readiness Assessment IPDET © 2012 16 planning for improvement : selecting realistic targets 5 1 Conducting a Readiness Assessment 3 selecting key indicators to monitor outcomes 7 using evaluation information 9 using findings 2 agreeing on outcomes to monitor and evaluate 4 gathering baseline data on indicators 6 monitoring for results 8 reporting findings sustaining the M&E system within the organization 10 Ten Steps to Building a Results-Based M&E System
What Is a Readiness Assessment? IPDET © 2012 27 • A systematic approach to determine the capacity and willingness of a government or organization to construct a results-based M&E system – The approach focuses on: presence or absence of champions, incentives, roles and responsibilities, organizational capacity, and barriers to getting started
Incentives IPDET © 2012 28 • Sort out the answers to these questions: – What is driving the need for building an M&E system? – Who are the champions for building and using an M&E system? – What is motivating those who champion building an M&E system? – Who will benefit from the system? – Who will not benefit?
Barriers to M&E IPDET © 2012 29 • Do any of the following present barriers to building an M&E system? – lack of fiscal resources – lack of political will – lack of a champion for the system – lack of an outcome-linked strategy , or experience • How do we confront these barriers?
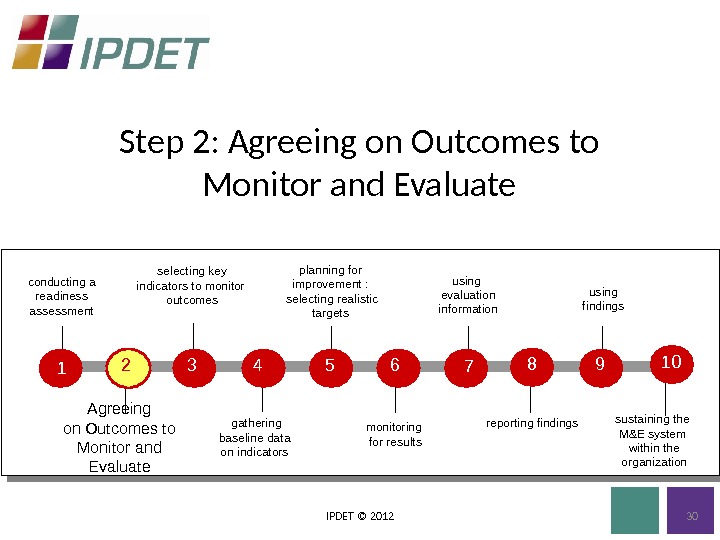
Step 2: Agreeing on Outcomes to Monitor and Evaluate IPDET © 2012 planning for improvement : selecting realistic targets 5 1 conducting a readiness assessment 3 selecting key indicators to monitor outcomes 7 using evaluation information 9 using findings 2 Agreeing on Outcomes to Monitor and Evaluate 4 gathering baseline data on indicators 6 monitoring for results 8 reporting findings sustaining the M&E system within the organization
Why an Emphasis on Outcomes? IPDET © 2012 31 • Makes explicit the intended objectives of government action • Outcomes are what produce benefits • Clearly setting outcomes is key to designing and building results-based M&E system • Important! Budget to outputs, manage to outcomes! • ( “ Know where you are going before you get moving ” )
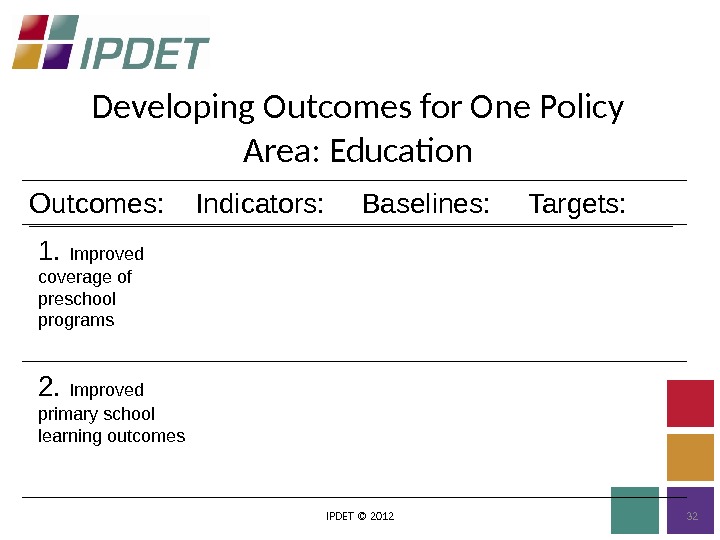
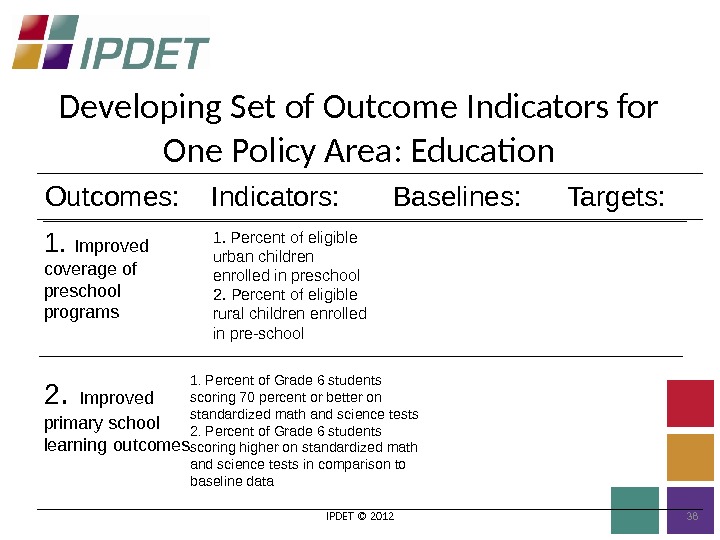
Developing Outcomes for One Policy Area: Education IPDET © 2012 322. Improved primary school learning outcomes 1. Improved coverage of preschool programs Targets: Baselines: Indicators: Outcomes:
Outcomes: IPDET © 2012 33 • Outcomes are usually not directly measured — only reported on • Outcomes must be translated to a set of key indicators • When choosing outcomes, “ Do not go it alone! ” – agreement is crucial
Step 3: Selecting Key Indicators to Monitor Outcomes IPDET © 2012 planning for improvement : selecting realistic targets 5 1 conducting a readiness assessment 3 Selecting Key Indicators to Monitor Outcomes 7 using evaluation information 9 using findings 2 agreeing on outcomes to monitor and evaluate 4 gathering baseline data on indicators 6 monitoring for results 8 reporting findings sustaining the M&E system within the organization
Results Indicator IPDET © 2012 35 • A specific variable, that when tracked systematically over time, indicates progress (or lack thereof) toward an outcome or impact – for new M&E systems, all indicators should be numerical – qualitative indicators can come later with mature M&E systems • Indicators ask: How will we know success when we see it?
Indicator Development IPDET © 2012 36 • “ CREAM ” – C lear – R elevant – E conomic – A dequate – M onitorable
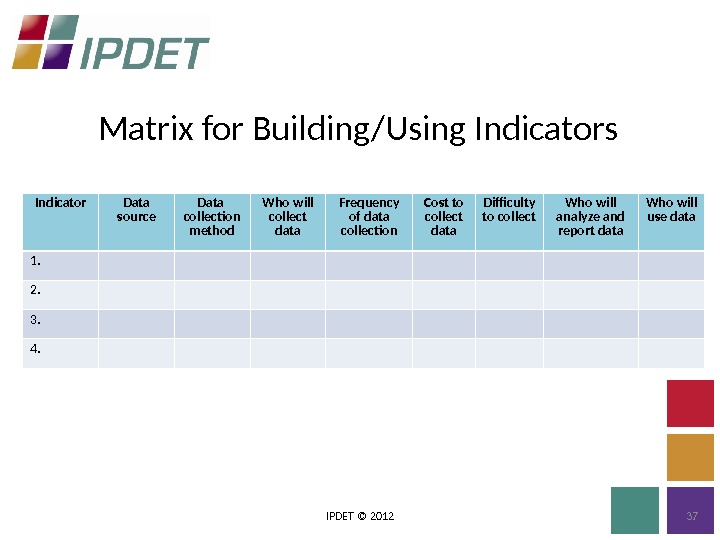
Matrix for Building/Using Indicators IPDET © 2012 37 Indicator Data source Data collection method Who will collect data Frequency of data collection Cost to collect data Difficulty to collect Who will analyze and report data Who will use data 1. 2. 3. 4.
Developing Set of Outcome Indicators for One Policy Area: Education IPDET © 2012 381. Percent of Grade 6 students scoring 70 percent or better on standardized math and science tests 2. Percent of Grade 6 students scoring higher on standardized math and science tests in comparison to baseline data 1. Percent of eligible urban children enrolled in preschool 2. Percent of eligible rural children enrolled in pre-school Targets: Baselines: Indicators: Outcomes: 2. Improved primary school learning outcomes 1. Improved coverage of preschool programs
Developing Indicators IPDET © 2012 39 • Develop your own indicators to meet your needs • Developing good indicators usually takes more than one try • State all indicators neutrally – not “ increase in… ” or “ decrease in… ” • Pilot, and Pilot!
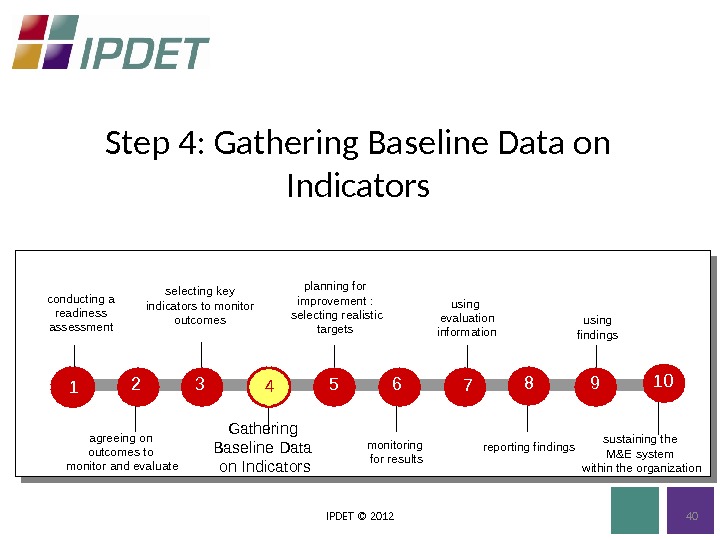
Step 4: Gathering Baseline Data on Indicators IPDET © 2012 planning for improvement : selecting realistic targets 5 1 conducting a readiness assessment 3 selecting key indicators to monitor outcomes 7 using evaluation information 9 using findings 2 agreeing on outcomes to monitor and evaluate 4 Gathering Baseline Data on Indicators 6 monitoring for results 8 reporting findings sustaining the M&E system within the organization
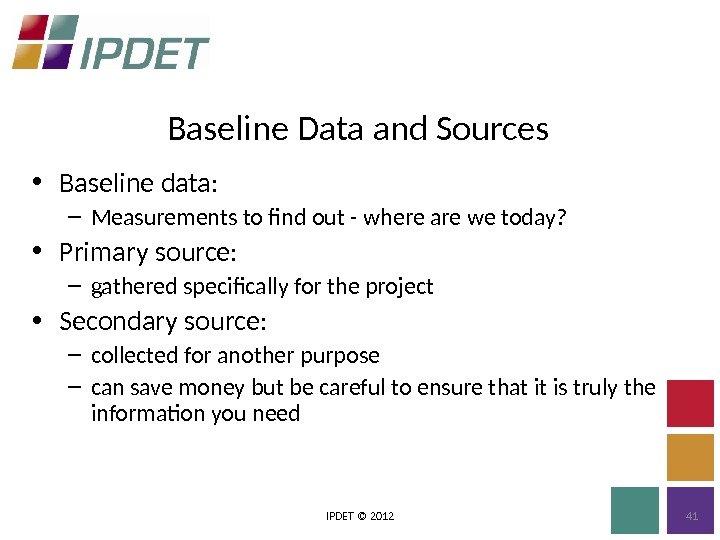
Baseline Data and Sources IPDET © 2012 41 • Baseline data: – Measurements to find out — where are we today? • Primary source: – gathered specifically for the project • Secondary source: – collected for another purpose – can save money but be careful to ensure that it is truly the information you need
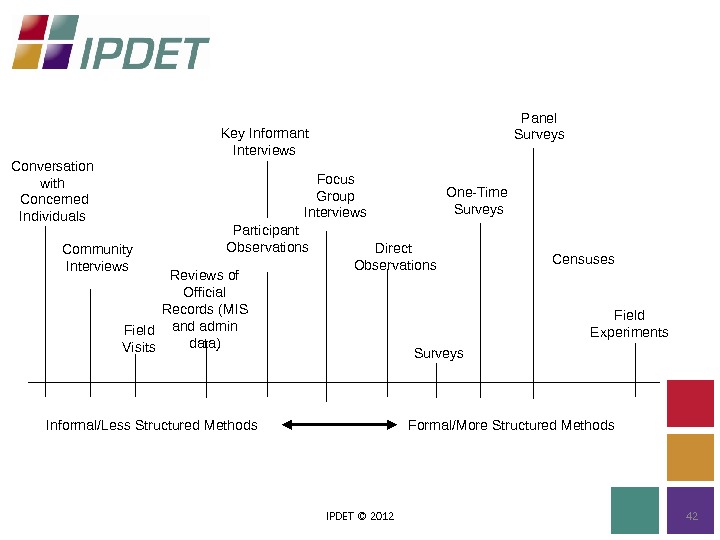
IPDET © 2012 42 Conversation with Concerned Individuals Community Interviews Field Visits Reviews of Official Records (MIS and admin data) Participant Observations. Key Informant Interviews Focus Group Interviews Panel Surveys Censuses Field Experiments Informal/Less Structured Methods Formal/More Structured Methods One-Time Surveys Direct Observations Surveys
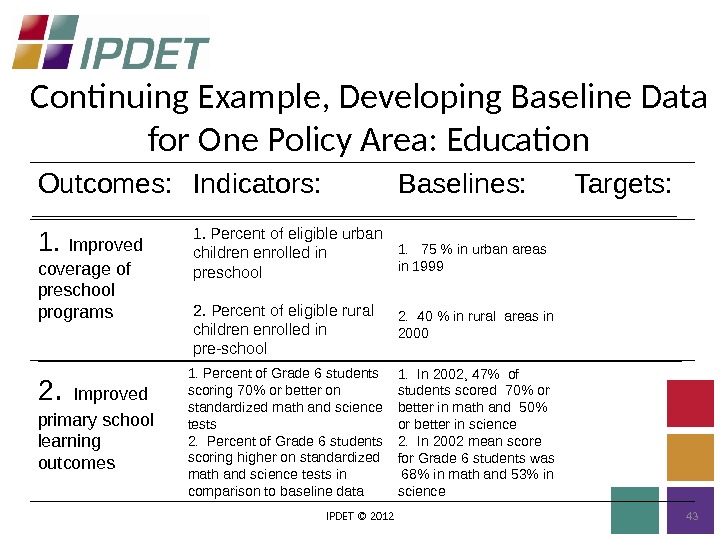
Continuing Example, Developing Baseline Data for One Policy Area: Education IPDET © 2012 431. In 2002, 47% of students scored 70% or better in math and 50% or better in science 2. In 2002 mean score for Grade 6 students was 68% in math and 53% in science 1. 75 % in urban areas in 1999 2. 40 % in rural areas in 2000 1. Percent of Grade 6 students scoring 70% or better on standardized math and science tests 2. Percent of Grade 6 students scoring higher on standardized math and science tests in comparison to baseline data 2. Improved primary school learning outcomes 1. Percent of eligible urban children enrolled in preschool 2. Percent of eligible rural children enrolled in pre-school 1. Improved coverage of preschool programs Targets: Baselines: Indicators: Outcomes:
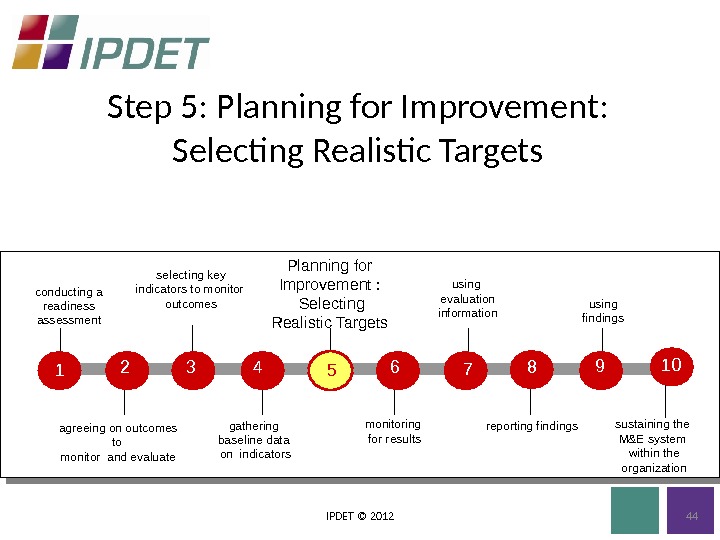
Step 5: Planning for Improvement: Selecting Realistic Targets IPDET © 2012 Planning for Improvement : Selecting Realistic Targets 5 1 conducting a readiness assessment 3 selecting key indicators to monitor outcomes 7 using evaluation information 9 using findings 2 agreeing on outcomes to monitor and evaluate 4 gathering baseline data on indicators 6 monitoring for results 8 reporting findings sustaining the M&E system within the organization
Targets: IPDET © 2012 45 • The quantifiable levels of the indicators that a country or organization wants to achieve at a given point in time • Example: – Agricultural exports will increase in the next three years by 20% over the baseline
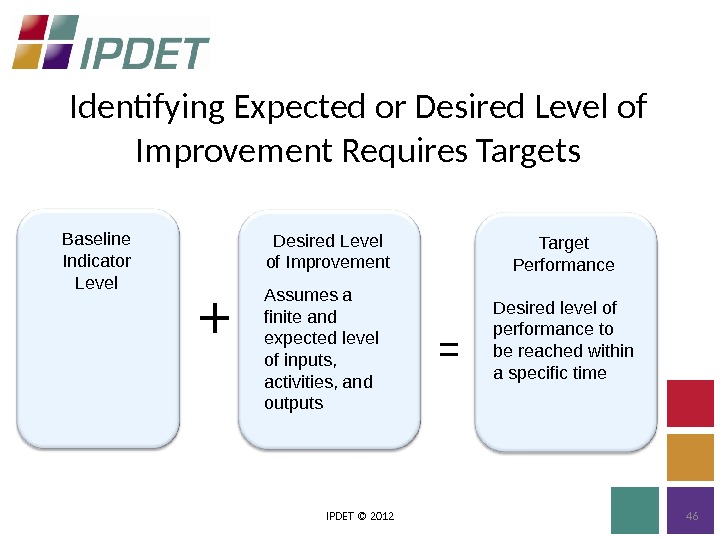
Identifying Expected or Desired Level of Improvement Requires Targets IPDET © 2012 46 Desired Level of Improvement Assumes a finite and expected level of inputs, activities, and outputs. Baseline Indicator Level Target Performance Desired level of performance to be reached within a specific time + =
Caution: IPDET © 2012 47 • It takes time to observe the effects of improvements, therefore: — Be realistic when setting targets — Avoid promising too much and thus programming yourself to fail
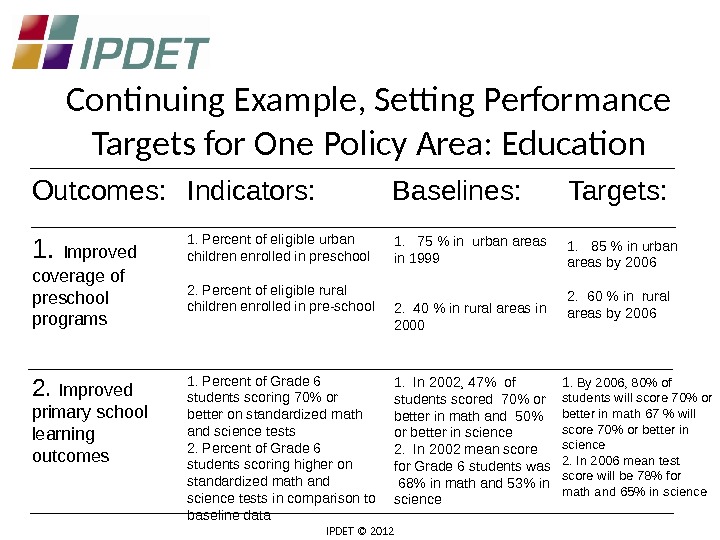
Continuing Example, Setting Performance Targets for One Policy Area: Education IPDET © 2012 481. By 2006, 80% of students will score 70% or better in math 67 % will score 70% or better in science 2. In 2006 mean test score will be 78% for math and 65% in science 1. 85 % in urban areas by 2006 2. 60 % in rural areas by 2006 1. In 2002, 47% of students scored 70% or better in math and 50% or better in science 2. In 2002 mean score for Grade 6 students was 68% in math and 53% in science 1. 75 % in urban areas in 1999 2. 40 % in rural areas in 2000 1. Percent of Grade 6 students scoring 70% or better on standardized math and science tests 2. Percent of Grade 6 students scoring higher on standardized math and science tests in comparison to baseline data 2. Improved primary school learning outcomes 1. Percent of eligible urban children enrolled in preschool 2. Percent of eligible rural children enrolled in pre-school 1. Improved coverage of preschool programs Targets: Baselines: Indicators: Outcomes:
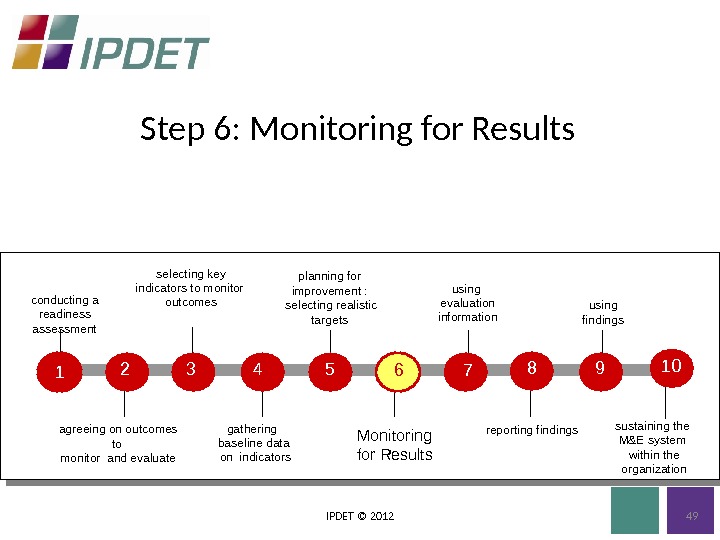
Step 6: Monitoring for Results IPDET © 2012 49 planning for improvement : selecting realistic targets 5 1 conducting a readiness assessment 3 selecting key indicators to monitor outcomes 7 using evaluation information 9 using findings 2 agreeing on outcomes to monitor and evaluate 4 gathering baseline data on indicators 6 Monitoring for Results 8 reporting findings sustaining the M&E system within the organization
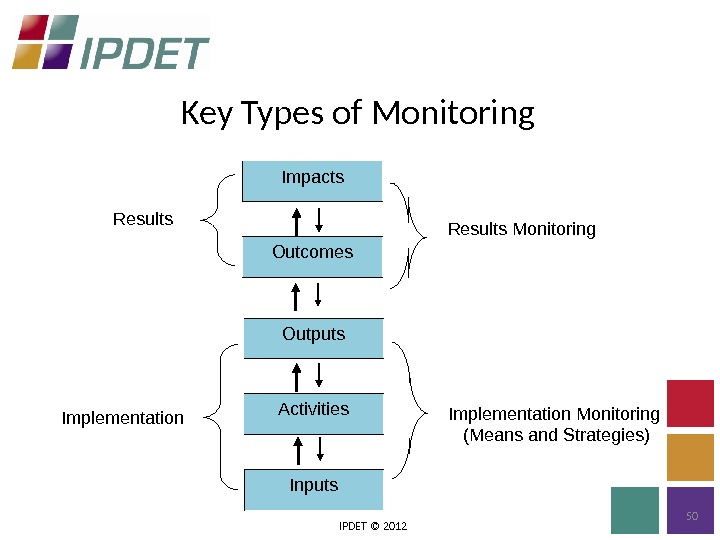
Key Types of Monitoring IPDET © 2012 50 Results Monitoring Implementation Monitoring (Means and Strategies)Outcomes Impacts Results Inputs. Activities Outputs Implementation
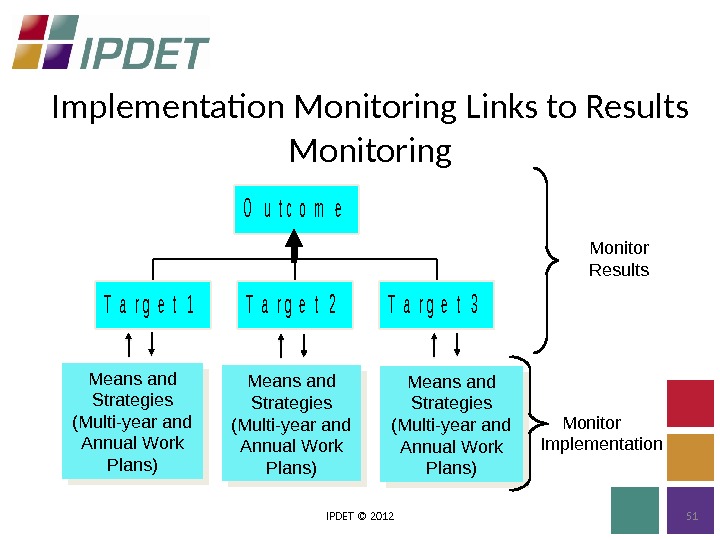
Implementation Monitoring Links to Results Monitoring IPDET © 2012 51 Means and Strategies (Multi-year and Annual Work Plans)Means and Strategies (Multi-year and Annual Work Plans) Monitor Results Monitor Implementation. T a r g e t 1 T a r g e t 2 T a r g e t 3 O u t c o m e
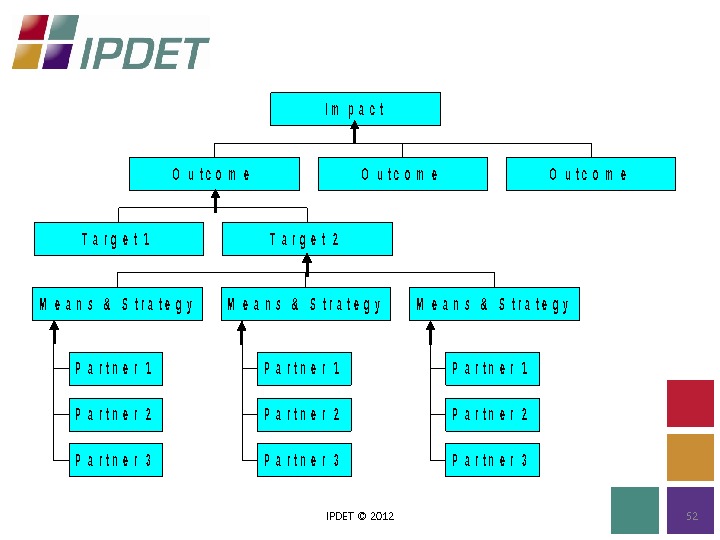
IPDET © 2012 52 T a r g e t 1 P a r t n e r 2 P a r t n e r 3 M e a n s & S t r a t e g y P a r t n e r 1 P a r t n e r 2 P a r t n e r 3 M e a n s & S t r a t e g y T a r g e t 2 O u t c o m e I m p a c t
Successful Monitoring Systems IPDET © 2012 53 • To be successful, every monitoring system needs the following: – ownership – management – maintenance – credibility
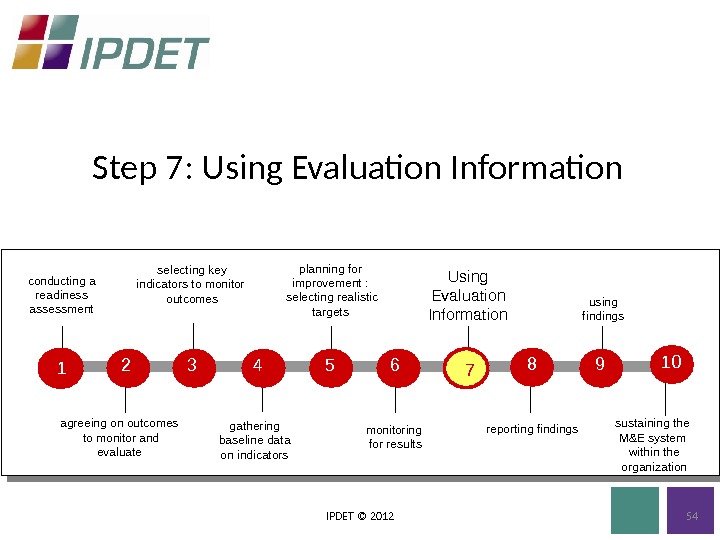
Step 7: Using Evaluation Information IPDET © 2012 planning for improvement : selecting realistic targets 5 1 conducting a readiness assessment 3 selecting key indicators to monitor outcomes 7 Using Evaluation Information 9 using findings 2 agreeing on outcomes to monitor and evaluate 4 gathering baseline data on indicators 6 monitoring for results 8 reporting findings sustaining the M&E system within the organization
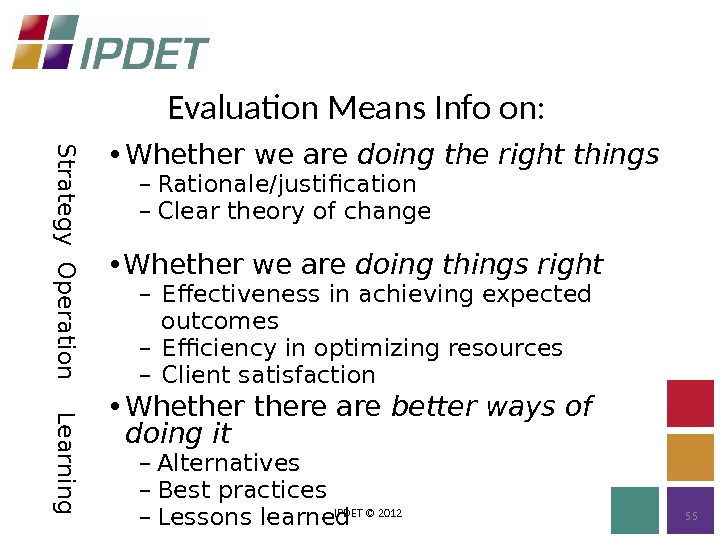
Evaluation Means Info on: IPDET © 2012 55 S tra te g y • Whether we are doing the right things – Rationale/justification – Clear theory of change O p e ra tio n • Whether we are doing things right – Effectiveness in achieving expected outcomes – Efficiency in optimizing resources – Client satisfaction L e a rn in g • Whethere are better ways of doing it – Alternatives – Best practices – Lessons learned
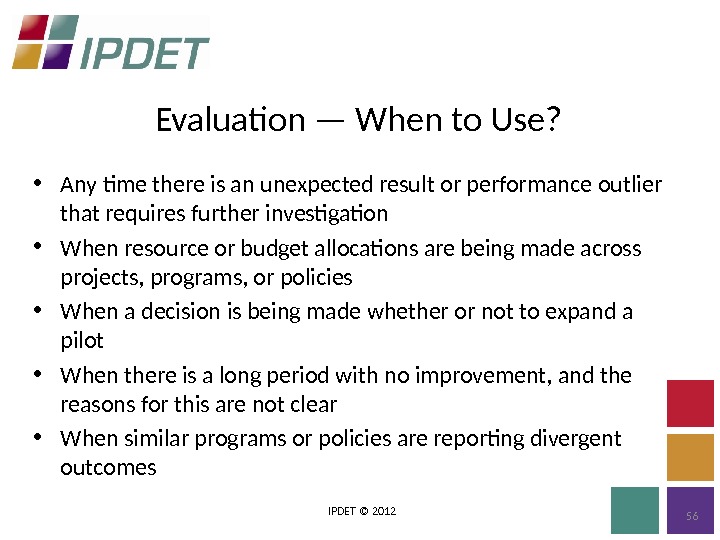
Evaluation — When to Use? IPDET © 2012 56 • Any time there is an unexpected result or performance outlier that requires further investigation • When resource or budget allocations are being made across projects, programs, or policies • When a decision is being made whether or not to expand a pilot • When there is a long period with no improvement, and the reasons for this are not clear • When similar programs or policies are reporting divergent outcomes
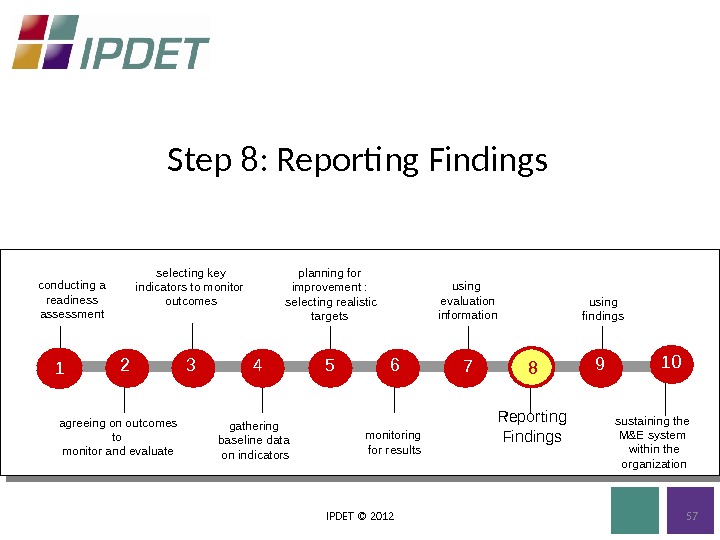
Step 8: Reporting Findings IPDET © 2012 planning for improvement : selecting realistic targets 5 conducting a readiness assessment 3 selecting key indicators to monitor outcomes 7 using evaluation information 9 using findings 2 agreeing on outcomes to monitor and evaluate 4 gathering baseline data on indicators 6 monitoring for results 8 Reporting Findings sustaining the M&E system within the organization
Reporting Findings IPDET © 2012 58 • Provides information on status of projects, programs, and policies • Yields clues to problems • Creates opportunities to consider changes • Provides important information over time on trends and directions • Helps confirm or challenge theory of change
When Analyzing and Presenting Data: IPDET © 2012 59 • Compare indicator data with the baseline and targets, and provide this information in an easy-to-understand visual display • Compare current information with past data and look for patterns and trends • Be careful about drawing sweeping conclusions based on small amounts of information. The more data points you have, the more certain you can be that trends are real (continued on next slide)
When Analyzing and Presenting Data: (cont. ) IPDET © 2012 60 • Protect the messenger: people who deliver bad news should not be punished. Uncomfortable findings can indicate new trends or notify managers of problems early on, allowing them time needed to solve these problems
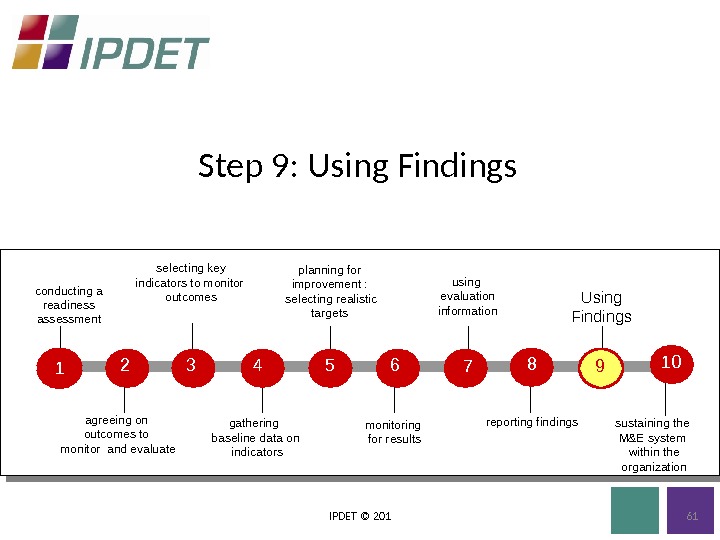
Step 9: Using Findings IPDET © 201 planning for improvement : selecting realistic targets 5 1 conducting a readiness assessment 3 selecting key indicators to monitor outcomes 7 using evaluation information 9 Using Findings 2 agreeing on outcomes to monitor and evaluate 4 gathering baseline data on indicators 6 monitoring for results 8 reporting findings sustaining the M&E system within the organization
Ten Uses of Results Findings IPDET © 2012 62 • Responds to elected officials ’ and the public ’ s demands for accountability • Helps formulate and justify budget requests • Helps in making operational resource allocation decisions • Triggers in-depth examinations of what performance problems exist and what corrections are needed • Helps motivate personnel to continue making program improvements (continued on next slide)
Ten Uses of Results Findings (cont. ) IPDET © 2012 63 • Monitors the project or program performance against outcome targets • Provides data for special, in-depth program evaluations • Helps track services delivery against precise outcome targets • Supports strategic and other long-term planning efforts • Communicates with the public to build public trust
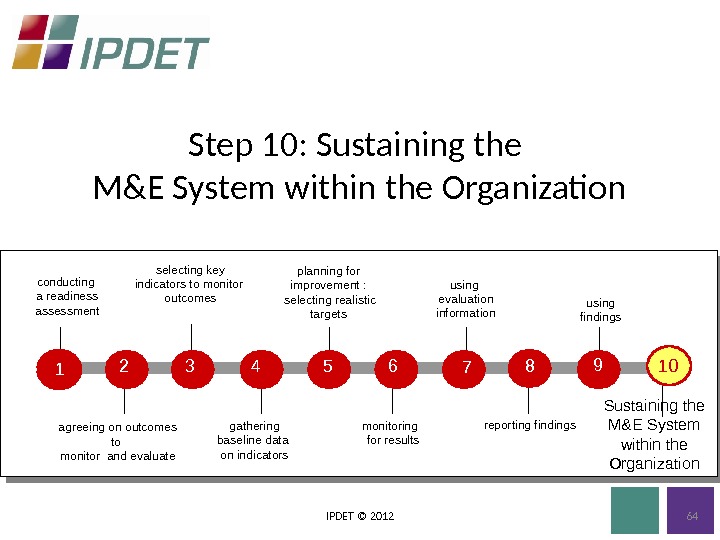
Step 10: Sustaining the M&E System within the Organization IPDET © 2012 planning for improvement : selecting realistic targets 5 1 conducting a readiness assessment 3 selecting key indicators to monitor outcomes 7 using evaluation information 9 using findings 2 agreeing on outcomes to monitor and evaluate 4 gathering baseline data on indicators 6 monitoring for results 8 reporting findings Sustaining the M&E System within the Organization
Critical Components Crucial to Sustaining IPDET © 2012 65 • Demand • Clear roles and responsibilities • Trustworthy and credible information • Accountability • Capacity • Incentives
Concluding Comments IPDET © 2012 66 • The demand for capacity building never ends! The only way an organization can coast is downhill • Keep your champions on your side and help them! • Establish the understanding with the Ministry of Finance and the Parliament that an M&E system needs sustained resources • Look for every opportunity to link results information to budget and resource allocation decisions (continued on next slide)
Concluding Comments (cont. ) IPDET © 2012 67 • Begin with pilot efforts to demonstrate effective results-based monitoring and evaluation • Begin with an enclave strategy (e. g. , islands of innovation) as opposed to a whole-of-government approach. • Monitor both implementation progress and results achievements • Complement performance monitoring with evaluations to ensure better understanding of public sector results
• Approaches to Evaluation
What is the evaluation approach? • The systematic application of social research procedures for assessing the conceptualization, design, implementation, and utility of programs ” (Rossi and Freeman 1993) • “ Evaluation identifies the impacts of an intervention program by analyzing cause and effect ” (Ezemenari et al. , 2001)
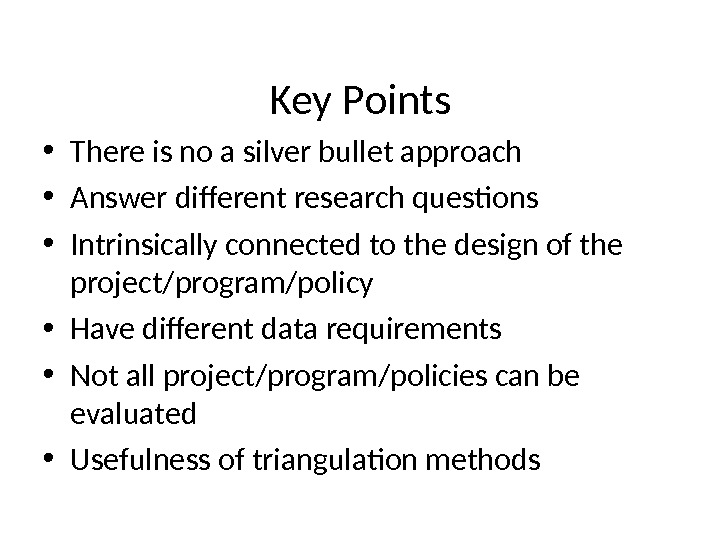
Key Points 70 • There is no a silver bullet approach • Answer different research questions • Intrinsically connected to the design of the project/program/policy • Have different data requirements • Not all project/program/policies can be evaluated • Usefulness of triangulation methods
Four Main Evaluation Approaches 1. Impact Evaluation 2. Outcome-Based Evaluation 3. Monitoring/Process Evaluation 4. Participatory Evaluation
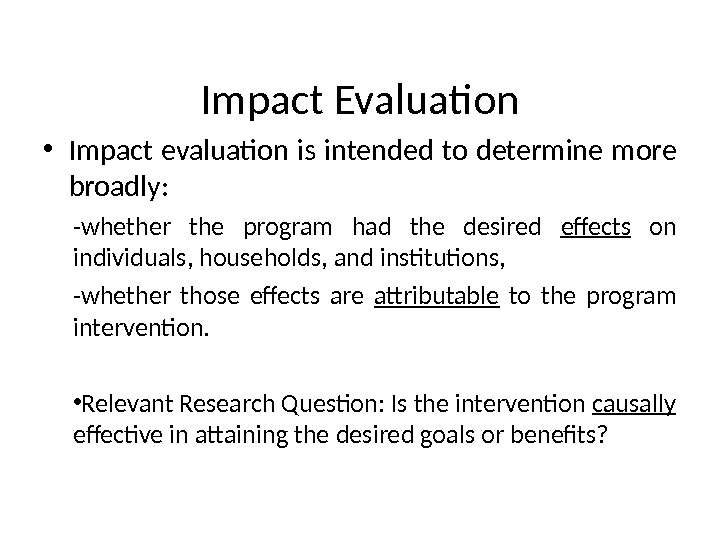
Impact Evaluation • Impact evaluation is intended to determine more broadly: -whether the program had the desired effects on individuals, households, and institutions, -whether those effects are attributable to the program intervention. • Relevant Research Question: Is the intervention causally effective in attaining the desired goals or benefits?
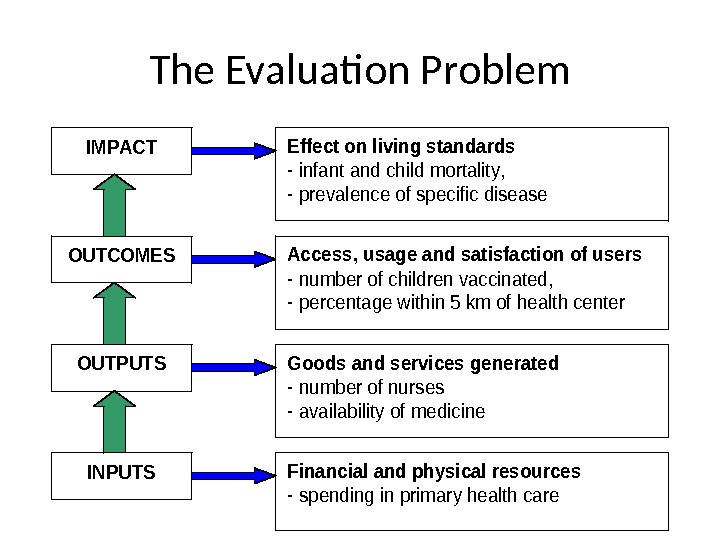
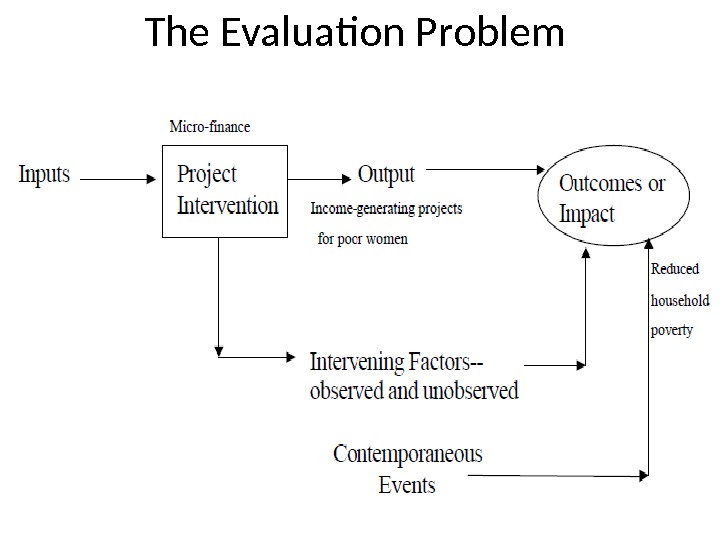
The Evaluation Problem 73 IMPACT OUTPUTS OUTCOMES INPUTS Effect on living standards — infant and child mortality, — prevalence of specific disease Financial and physical resources — spending in primary health care Goods and services generated — number of nurses — availability of medicine Access, usage and satisfaction of users — number of children vaccinated, — percentage within 5 km of health center
The Evaluation Problem
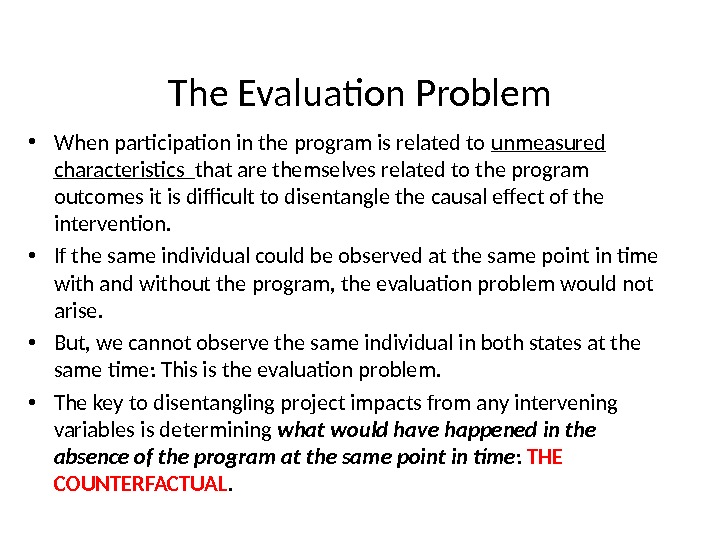
The Evaluation Problem • When participation in the program is related to unmeasured characteristics that are themselves related to the program outcomes it is difficult to disentangle the causal effect of the intervention. • If the same individual could be observed at the same point in time with and without the program, the evaluation problem would not arise. • But, we cannot observe the same individual in both states at the same time: This is the evaluation problem. • The key to disentangling project impacts from any intervening variables is determining what would have happened in the absence of the program at the same point in time : THE COUNTERFACTUAL.
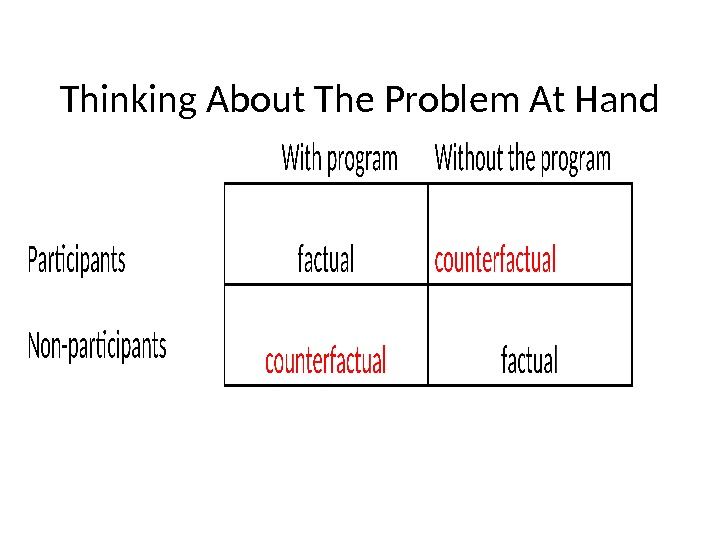
Thinking About The Problem At Hand
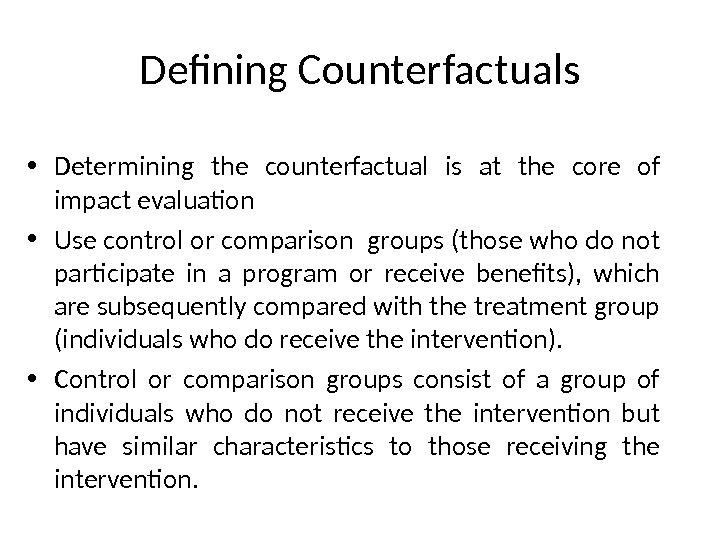
Defining Counterfactuals • Determining the counterfactual is at the core of impact evaluation • Use control or comparison groups (those who do not participate in a program or receive benefits), which are subsequently compared with the treatment group (individuals who do receive the intervention). • Control or comparison groups consist of a group of individuals who do not receive the intervention but have similar characteristics to those receiving the intervention.
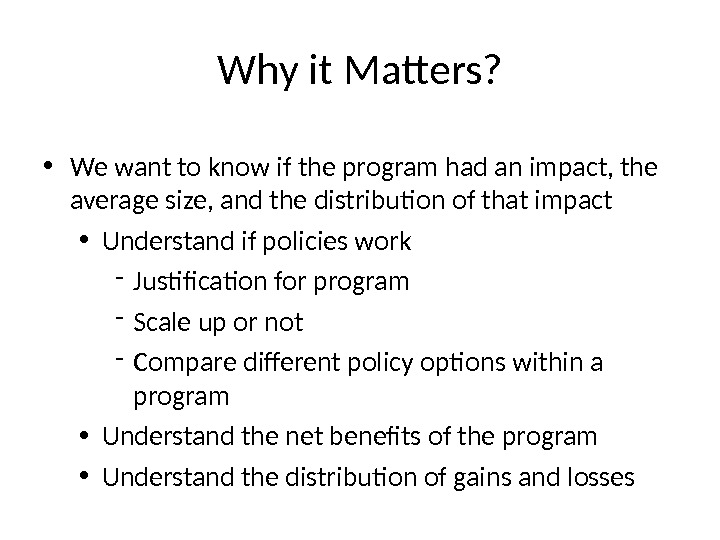
Why it Matters? • We want to know if the program had an impact, the average size, and the distribution of that impact • Understand if policies work — Justification for program — Scale up or not — Compare different policy options within a program • Understand the net benefits of the program • Understand the distribution of gains and losses
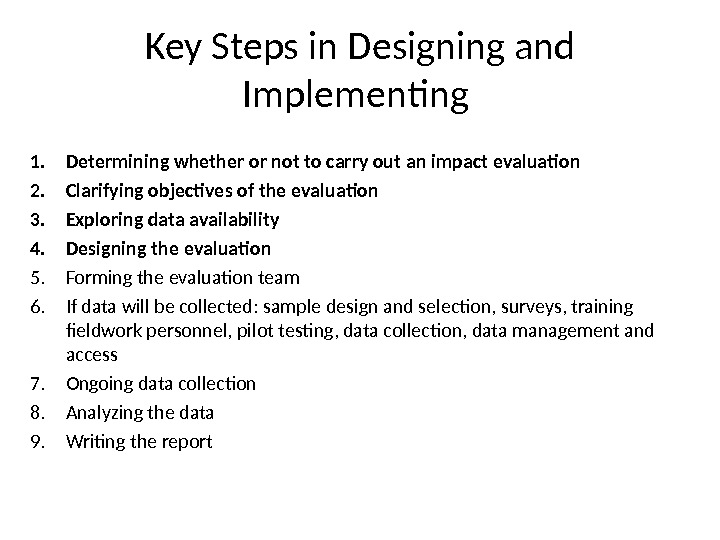
Key Steps in Designing and Implementing 1. Determining whether or not to carry out an impact evaluation 2. Clarifying objectives of the evaluation 3. Exploring data availability 4. Designing the evaluation 5. Forming the evaluation team 6. If data will be collected: sample design and selection, surveys, training fieldwork personnel, pilot testing, data collection, data management and access 7. Ongoing data collection 8. Analyzing the data 9. Writing the report
Determining Whether Or Not To Carry Out An Impact Evaluation • Cost and benefits should be assessed • Strong political and financial support • Program is suitable for evaluation
Clarifying Objectives of Evaluation • Establishing clear objectives • Use and analysis of the program ‘ s logical framework helps Example: The evaluation is about the “ effect of the PROBECAT training program on labor market outcomes ” Example: The evaluation is about the “ effect of the PROBECAT training program on subsequent labor hourly earnings of beneficiaries ”
Data Availability • Know the institutions of the program well. • Collect information on the relevant “ stylized facts ” • Ensure that there is data on the outcome indicators and relevant explanatory variables
Designing The Evaluation • Know the institutions of the program well. • Defined the evaluation question(s) (unit of analysis, outcomes, time framework, etc) • Timing and budget concerns (short-, medium- long-term evaluation) • Implementation capacity. Big issue in developing countries.
Impact Evaluation Example : PROGRESA • PROGRESA is the principal antipoverty strategy of the Mexican government • Large program -By 2003 4. 2 million families were receiving benefits -72, 000 localities -40% of all rural families -1/9 of all families • Annual budget: 46% of Federal poverty alleviation budget
PROGRESA ’ S Goals • Long-run poverty alleviation — Investment in human capital — Education — Health — Nutrition • Short-run poverty alleviation -cash transfers
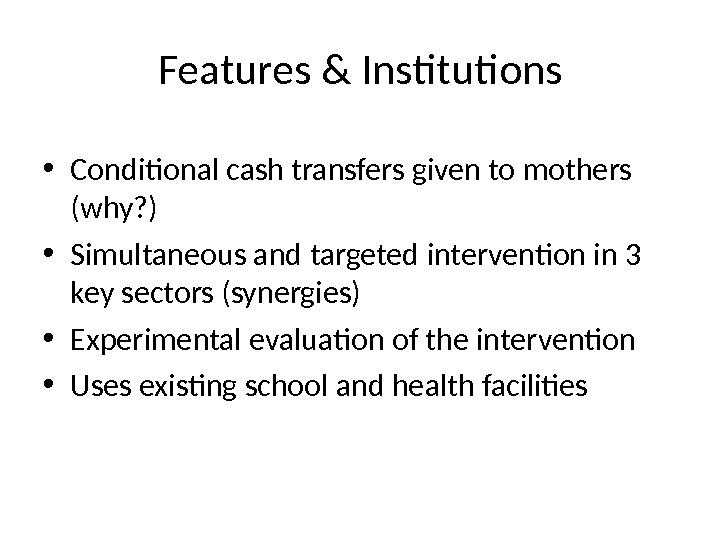
Features & Institutions • Conditional cash transfers given to mothers (why? ) • Simultaneous and targeted intervention in 3 key sectors (synergies) • Experimental evaluation of the intervention • Uses existing school and health facilities
Overall Program Benefits • Beneficiary households receive on average 200 pesos per month -22% increase in the income level • About 50% of the 200 pesos are cash transfers for food • The rest are cash transfers for school-related items • Heterogeneous benefits depending on family size and schooling needs
Evaluation Framework
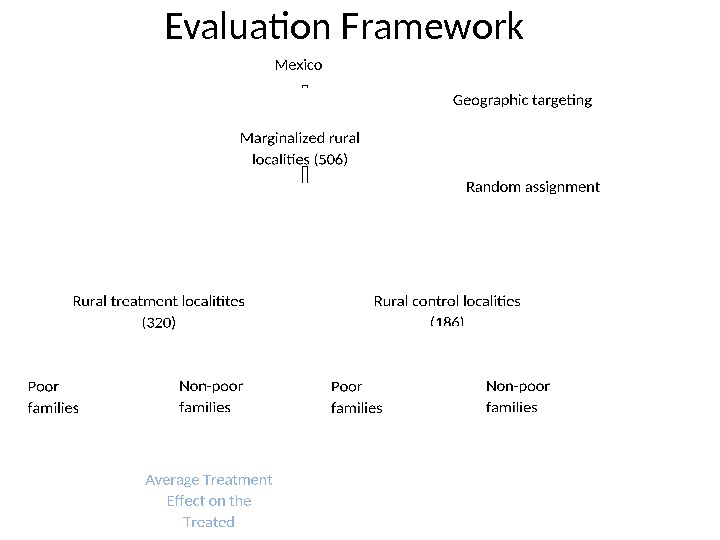
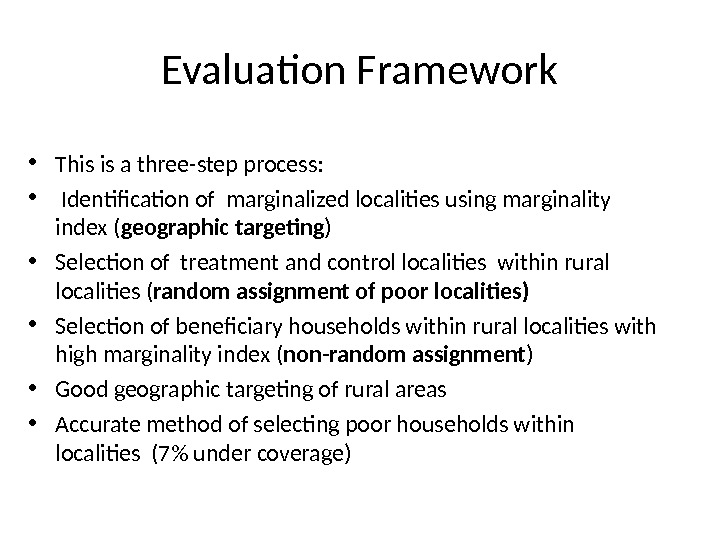
Evaluation Framework • This is a three-step process: • Identification of marginalized localities using marginality index ( geographic targeting ) • Selection of treatment and control localities within rural localities ( random assignment of poor localities) • Selection of beneficiary households within rural localities with high marginality index ( non-random assignment ) • Good geographic targeting of rural areas • Accurate method of selecting poor households within localities (7% under coverage)
Evaluation Framework • Program randomized at the locality level • Sample of 506 localities — 186 control (no PROGRESA) -320 treatment (PROGRESA) • 24, 077 Households (hh) -78% beneficiaries • The experiment lasted only for a year and a half because the control group families started to receive benefits in December
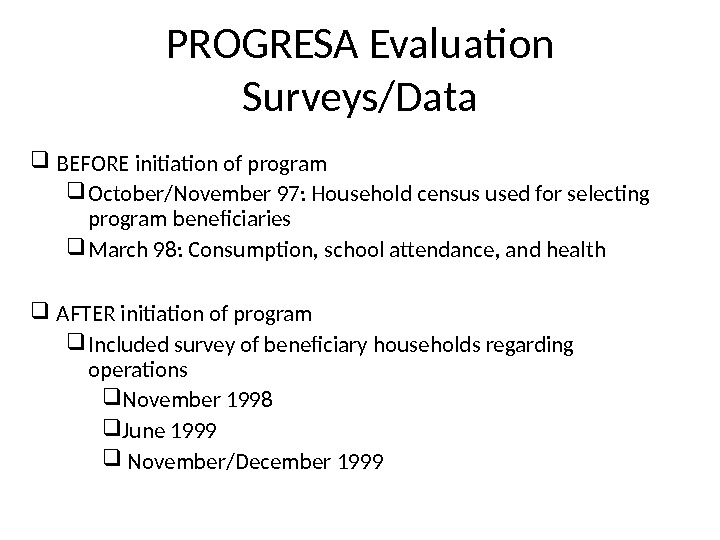
PROGRESA Evaluation Surveys/Data BEFORE initiation of program October/November 97: Household census used for selecting program beneficiaries March 98: Consumption, school attendance, and health AFTER initiation of program Included survey of beneficiary households regarding operations November 1998 June 1999 November/December
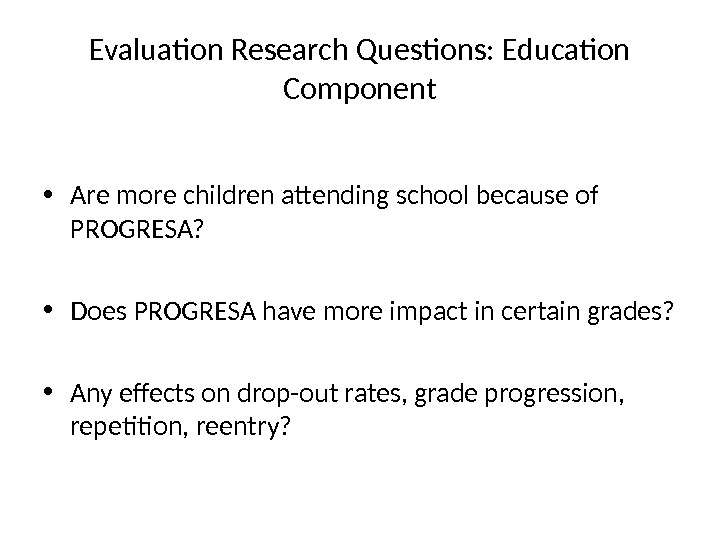
Evaluation Research Questions: Education Component • Are more children attending school because of PROGRESA? • Does PROGRESA have more impact in certain grades? • Any effects on drop-out rates, grade progression, repetition, reentry?
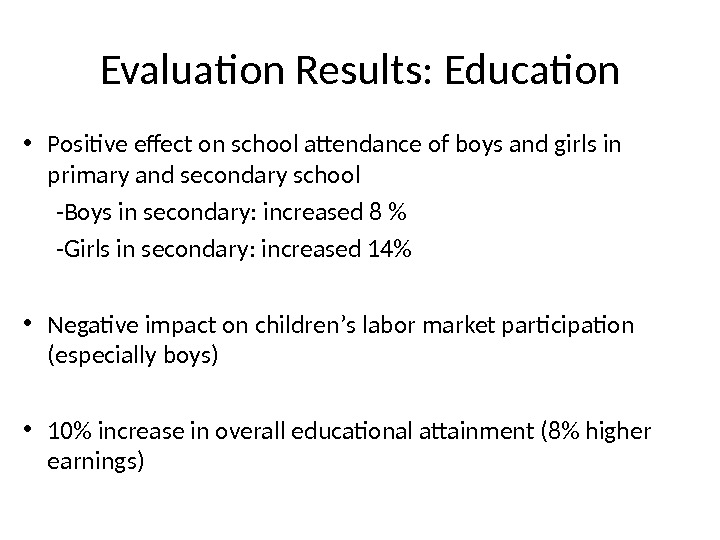
Evaluation Results: Education • Positive effect on school attendance of boys and girls in primary and secondary school -Boys in secondary: increased 8 % -Girls in secondary: increased 14% • Negative impact on children ’ s labor market participation (especially boys) • 10% increase in overall educational attainment (8% higher earnings)
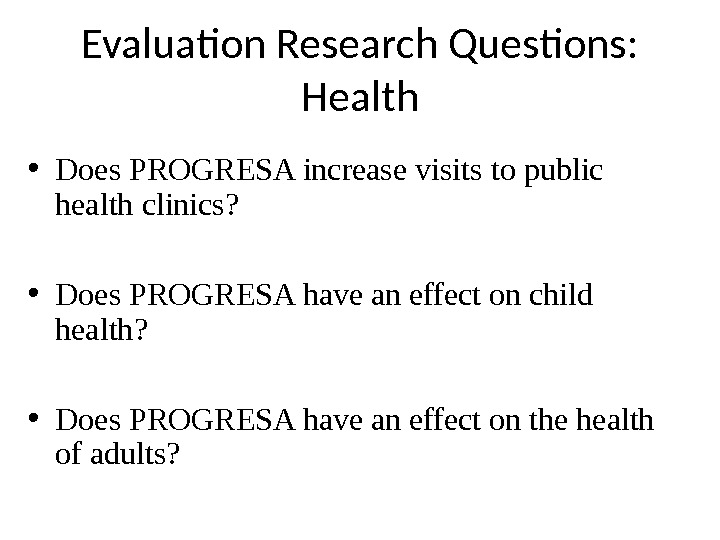
Evaluation Research Questions: Health • Does PROGRESA increase visits to public health clinics? • Does PROGRESA have an effect on child health? • Does PROGRESA have an effect on the health of adults?
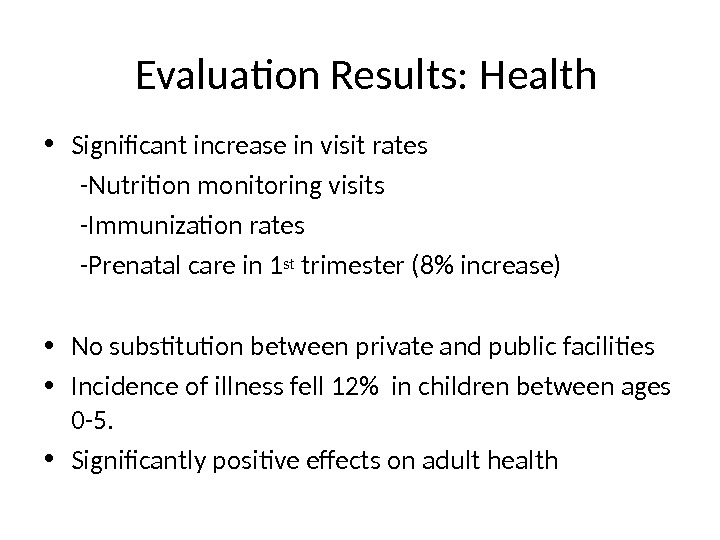
Evaluation Results: Health • Significant increase in visit rates -Nutrition monitoring visits -Immunization rates -Prenatal care in 1 st trimester (8% increase) • No substitution between private and public facilities • Incidence of illness fell 12% in children between ages 0 -5. • Significantly positive effects on adult health
Evaluation Research Questions: Nutrition • Does PROGRESA impact child growth? • Does PROGRESA impact household consumption and food diet?
Evaluation Results: Nutrition • Significant effect in increasing child growth (1 cm higher growth) • Significant effect in reducing the probability of stunting -Children 12 -36 months • Household total consumption increases • PROGRESA households “ eat better ” -Higher expenditures on fruits, vegetables, meats, and animal products
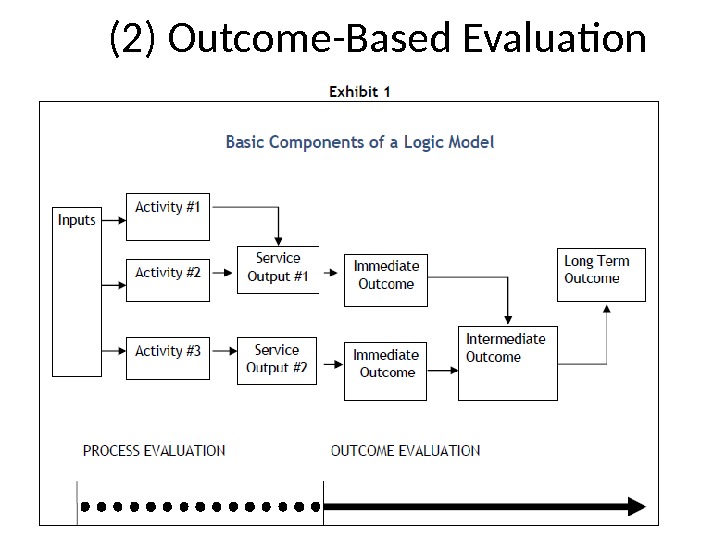
(2) Outcome-Based Evaluation
Basic Definitions • Outcome-based evaluation is a systematic way to assess the extent to which a program has achieved its intended results, How has the program made a difference? Is the welfare of participants better off after the program?
Why It Matters? • Contribute to program effectiveness • Provide a logical framework for program development • Generate information for decision-making • Communicate program value
But Unlike Impact Evaluation • It does not prove cause and effect, only suggest a cause and effect relationship. • It shows contribution, not attribution
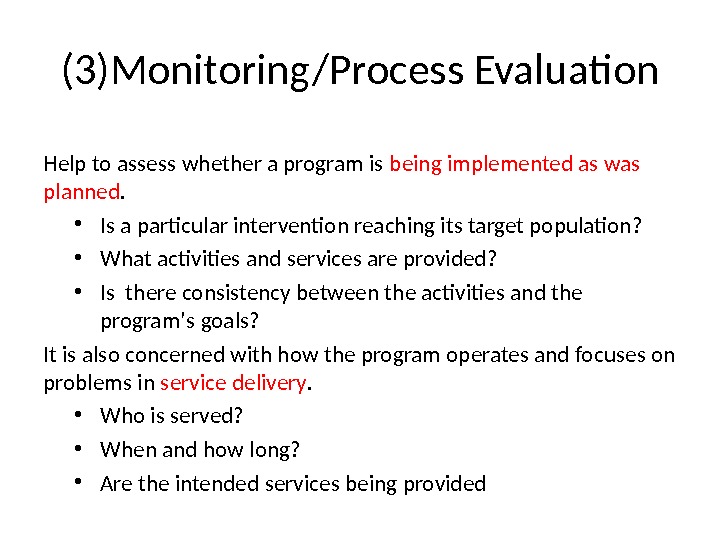
(3)Monitoring/Process Evaluation Help to assess whether a program is being implemented as was planned. • Is a particular intervention reaching its target population? • What activities and services are provided? • Is there consistency between the activities and the program ’ s goals? It is also concerned with how the program operates and focuses on problems in service delivery. • Who is served? • When and how long? • Are the intended services being provided
Why It Matters? • Helps on determining how a program ’ s potential impact is related to its implementation ( evaluator ’ s perspective ) • Provide information that stakeholders need to judge the appropriateness of program activities and to decide whether a program should be continued, expanded, or contracted ( accountability perspective) • Provide information to incorporate corrective measures as a regular part of program operations ( management perspective )
(4)Participatory Evaluation • Representatives of agencies and stakeholders (including beneficiaries) work together in designing, carrying out, interpreting, and reporting an evaluation • Departs from the audit ideal of independence • Departs from scientific detachment • Partnership based on dialogue and negotiation
Principles of Participatory Evaluation • Evaluation involves building participants ’ skills • Participants commit to the evaluation and make decisions and draw own conclusions • Participants ensure evaluation focuses on methods and results they consider important • People work together promoting group unity • Participants understand find meaningful all aspects of the evaluation • Self-accountability is highly valued • Evaluators/Facilitators act as resources
Participatory Process • No single right way • Commitment to the principles of participation and inclusion -those closest to the situation have valuable and necessary information • Develop strategies to develop trust and honest communication -information sharing and decision-making -create “ even ground ”
Benefits of Participatory • Increased buy-in, less resistance • Results are more likely to be used • Increased sustainability • Increased credibility of results • More flexibility in approaches • Can be systematic way of learning from experience
Challenges of Participatory • Concern that evaluation will not be objective • Those closest to the intervention may not be able to see what is actually happening if it is not what they expect • Participants may be fearful of raising negative views • Time consuming • Clarifying roles, responsibilities, and process • Skilled facilitation is required • Just-in-time training
В завершение ( In Closing ) • The evaluation approach is the generation of knowledge about the performance and effectiveness of programs • Choosing a particular evaluation approach depends on the research question you have • Triangulation of evaluation approaches is very welcome