
Презентация ch07 Exhibit Slides


- Размер: 1.3 Mегабайта
- Количество слайдов: 18
Описание презентации Презентация ch07 Exhibit Slides по слайдам
Copyright © 2011 Cengage Learning 77 Consumers, Producers, and the Efficiency of Markets
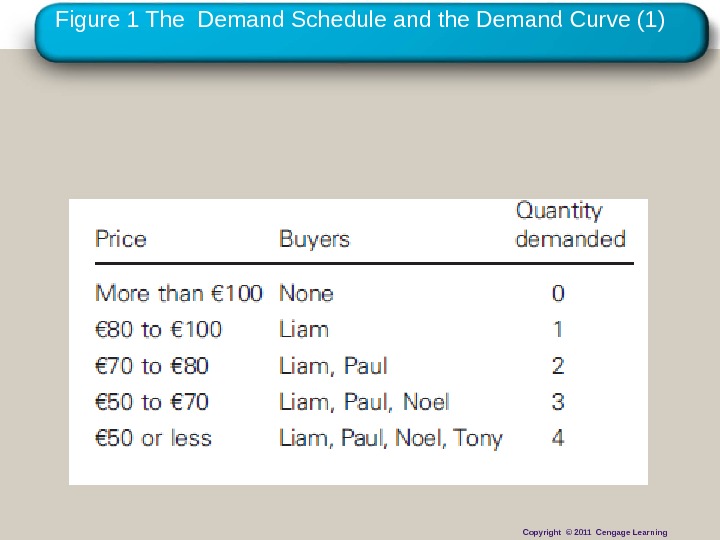
Table 1 Four Possible Buyers’ Willingness to Pay Copyright © 2011 Cengage Learning
Copyright © 2010 Cengage Learning. Figure 1 The Demand Schedule and the Demand Curve (1) Copyright © 2011 Cengage Learning
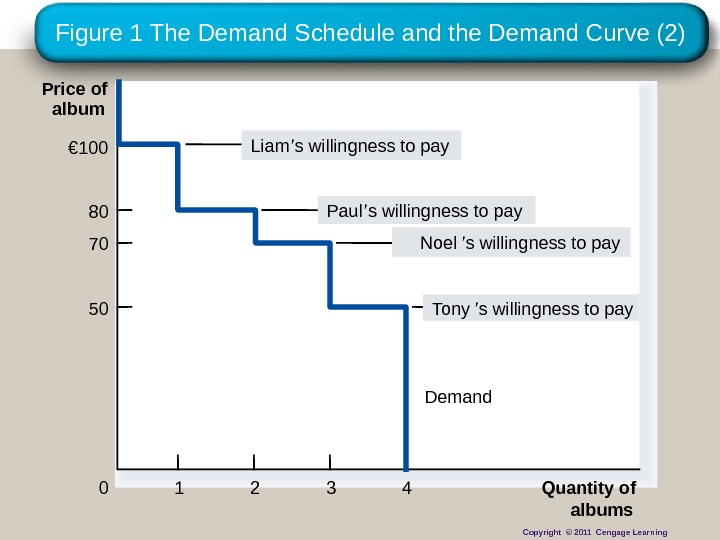
Figure 1 The Demand Schedule and the Demand Curve (2) Price of album 0 Quantity of albums. Demand 1 2 3 4€ 100 Liam ’ s willingness to pay 80 Paul ’ s willingness to pay 70 Noel ’ s willingness to pay 50 Tony ’ s willingness to pay Copyright © 2011 Cengage Learning
Figure 2 Measuring Consumer Surplus with the Demand Curve (1) (a) Price = € 80 Price of album 507080 0€ 100 Demand 1 2 3 4 Quantity of albums. Liam ’ s consumer surplus ( € 20) Copyright © 2011 Cengage Learning
Figure 2 Measuring Consumer Surplus with the Demand Curve (2) (b) Price = € 70 Price of album 507080 0€ 100 Demand 1 2 3 4 Total consumer surplus ( € 40) Quantity of albums. Liam ’ s consumer surplus ( € 30) Paul ’ s consumer surplus ( € 1 0) Copyright © 2011 Cengage Learning
Figure 3 How the Price Affects Consumer Surplus (1) Consumer surplus Quantity(a) Consumer surplus at price P Price 0 Demand. P 1 Q 1 BA C Copyright © 2011 Cengage Learning
Figure 3 How the Price Affects Consumer Surplus (2) Initial consumer surplus Quantity(b) Consumer surplus at price P Price 0 Demand. A B C D E FP 1 Q 1 P 2 Q 2 Consumer surplus to new consumers Additional consumer surplus to initial consumers Copyright © 2011 Cengage Learning
Table 2 The Costs of Four Possible Sellers Copyright © 2011 Cengage Learning
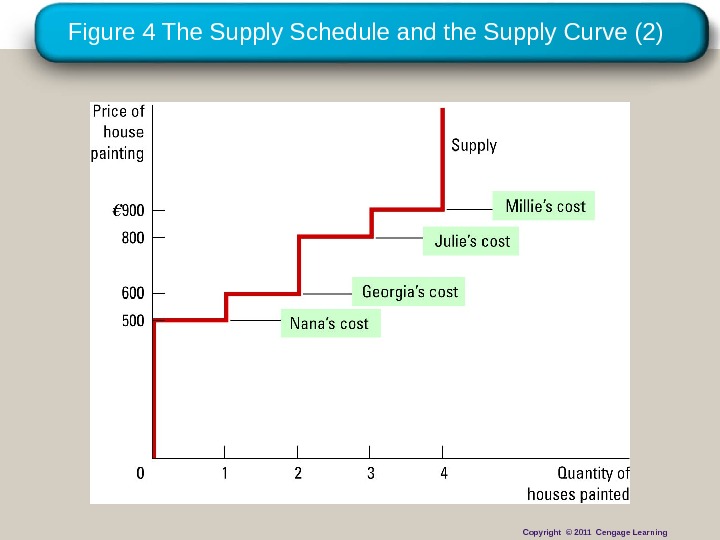
Copyright © 2010 Cengage Learning. Figure 4 The Supply Schedule and the Supply Curve (1) Copyright © 2011 Cengage Learning
Figure 4 The Supply Schedule and the Supply Curve (2) Copyright © 2011 Cengage Learning
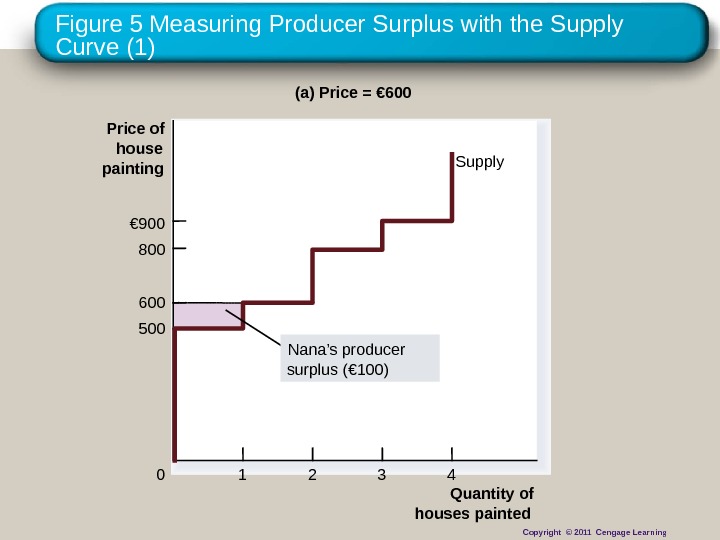
Figure 5 Measuring Producer Surplus with the Supply Curve (1) Quantity of houses painted. Price of house painting 500800€ 900 0600 1 2 3 4(a) Price = € 600 Supply ’Nana’s producer surplus ( € 100) Copyright © 2011 Cengage Learnin g
Figure 5 Measuring Producer Surplus with the Supply Curve (2) Quantity of houses painted. Price of house painting 500800€ 900 0600 1 2 3 4(b) Price = € 800 Georgia ’ s producer surplus ( € 200)Total producer surplus ( € 500) ’Nana’s producer surplus ( € 300) Supply Copyright © 2011 Cengage Learning
Figure 6 How the Price Affects Producer Surplus (1) Producer surplus Quantity(a) Producer surplus at price P Price 0 Supply B A C Q 1 P 1 Copyright © 2011 Cengage Learning
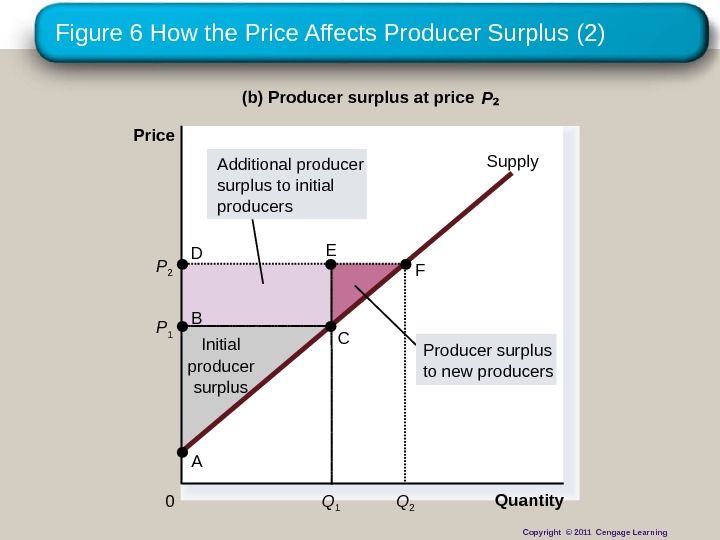
Figure 6 How the Price Affects Producer Surplus (2) Quantity(b) Producer surplus at price P Price 0 P 1 B C Supply A Initial producer surplus Q 1 P 2 Q 2 Producer surplus to new producers. Additional producer surplus to initial producers D E F Copyright © 2011 Cengage Learning
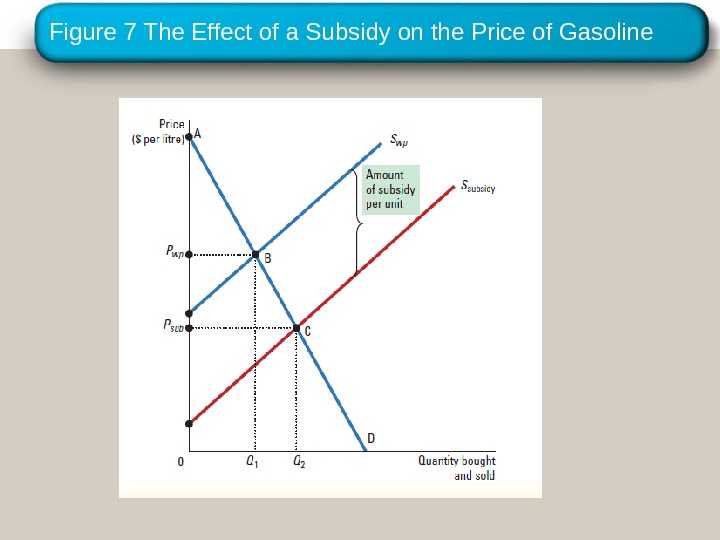
Copyright © 2010 Cengage Learning. Figure 7 The Effect of a Subsidy on the Price of Gasoline
Figure 8 Consumer and Producer Surplus in the Market Equilibrium Producer surplus. Consumer surplus. Price 0 Quantity. Equilibrium price Equilibrium quantity Supply Demand. A C BD E Copyright © 2011 Cengage Learning
Figure 9 The Efficiency of the Equilibrium Quantity. Price 0 Supply Demand. Cost to sellers. Value to buyers is greater than cost to sellers. Value to buyers is less than cost to sellers. Equilibrium quantity Copyright © 2011 Cengage Learning