
Презентация ch05 Exhibit Slides


- Размер: 1 Mегабайта
- Количество слайдов: 20
Описание презентации Презентация ch05 Exhibit Slides по слайдам
Copyright © 2011 Cengage Learning 55 Elasticity and Its Applications
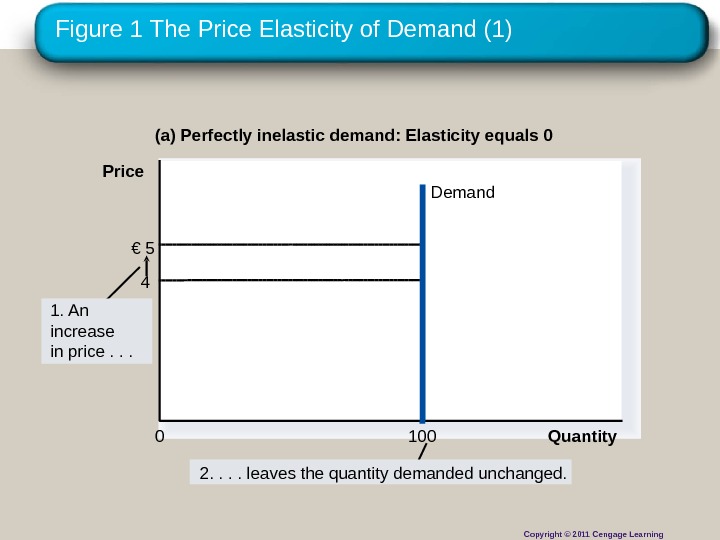
Figure 1 The Price Elasticity of Demand (1) (a) Perfectly inelastic demand: Elasticity equals 0 € 5 4 Quantity. Demand 10001. An increase in price. . . 2. . leaves the quantity demanded unchanged. Price Copyright © 2011 Cengage Learning
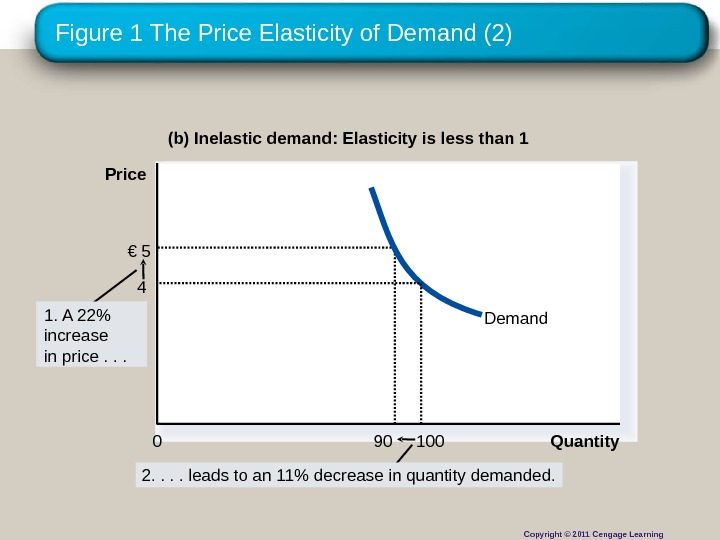
Figure 1 The Price Elasticity of Demand (2) (b) Inelastic demand: Elasticity is less than 1 Quantity 0€ 5 90 Demand 1. A 22% increase in price. . . Price 2. . leads to an 11% decrease in quantity demanded. 4 100 Copyright © 2011 Cengage Learning
Figure 1 The Price Elasticity of Demand (3) 2. . leads to a 22% decrease in quantity demanded. (c) Unit elastic demand: Elasticity equals 1 Quantity 4 1000 Price € 5 801. A 22% increase in price. . . Demand Copyright © 2011 Cengage Learning
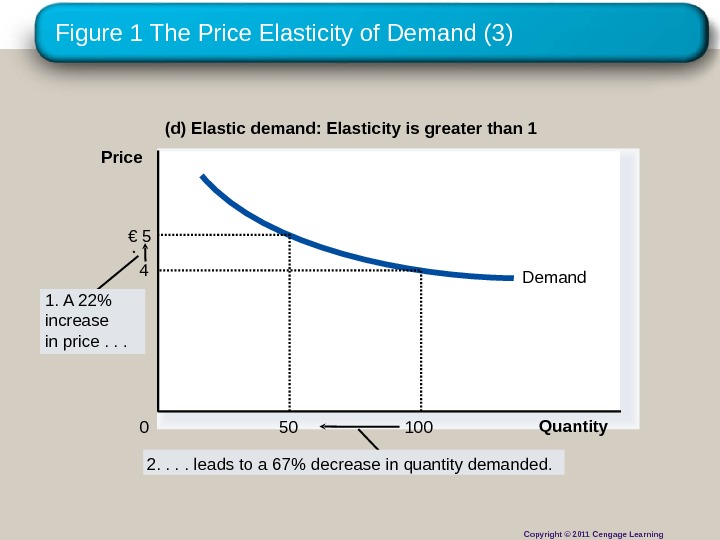
Figure 1 The Price Elasticity of Demand (3) (d) Elastic demand: Elasticity is greater than 1 Demand Quantity 4 1000 Price € 5 501. A 22% increase in price. . . 2. . leads to a 67% decrease in quantity demanded. Copyright © 2011 Cengage Learning
Figure 1 The Price Elasticity of Demand (4) (e) Perfectly elastic demand: Elasticity equals infinity Quantity 0 Price € 4 Demand 2. At exactly € 4, consumers will buy any quantity. 1. At any price above € 4, quantity demanded is zero. 3. At a price below € 4, quantity demanded is infinite. Copyright © 2011 Cengage Learning
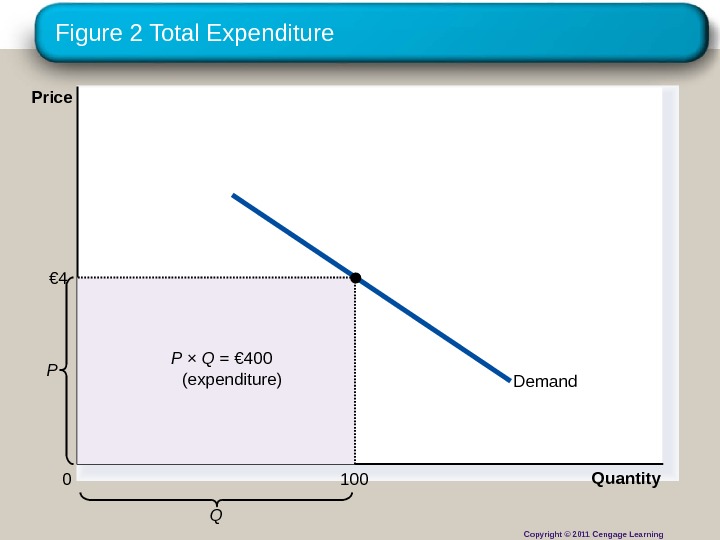
Copyright © 2010 Cengage Learning. Figure 2 Total Expenditure Demand Quantity QP 0 Price P × Q = € 400 (expenditure)€ 4 100 Copyright © 2011 Cengage Learning
Figure 3 How Total Expenditure Changes When Price Changes: Inelastic Demand Quantity 0 Price Expenditure = € 100 Quantity 0 Price Expenditure = € 240 Demand€ 1 100 € 3 80 An increase in price from € 1 to € 3 … … leads to an Increase in total revenue from € 100 to € 240 Copyright © 2011 Cengage Learning
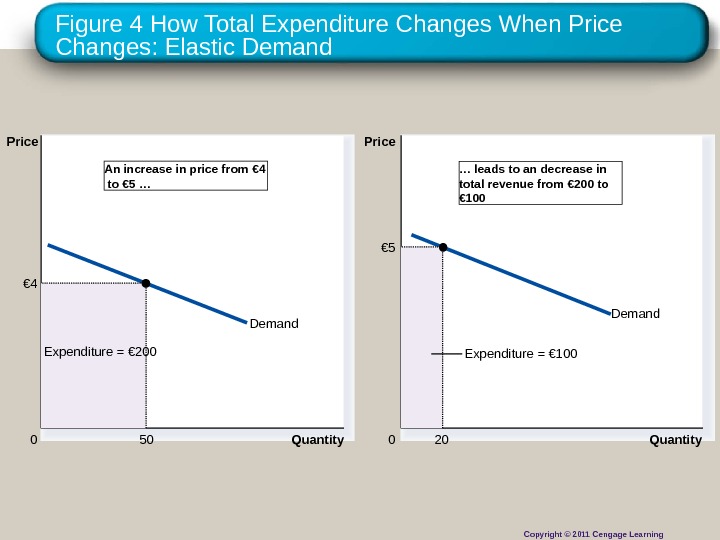
Figure 4 How Total Expenditure Changes When Price Changes: Elastic Demand Quantity 0 Price Expenditure = € 200 € 4 50 Demand Quantity 0 Price Expenditure = € 100 € 5 20 An increase in price from € 4 to € 5 … … leads to an decrease in total revenue from € 200 to € 100 Copyright © 2011 Cengage Learning
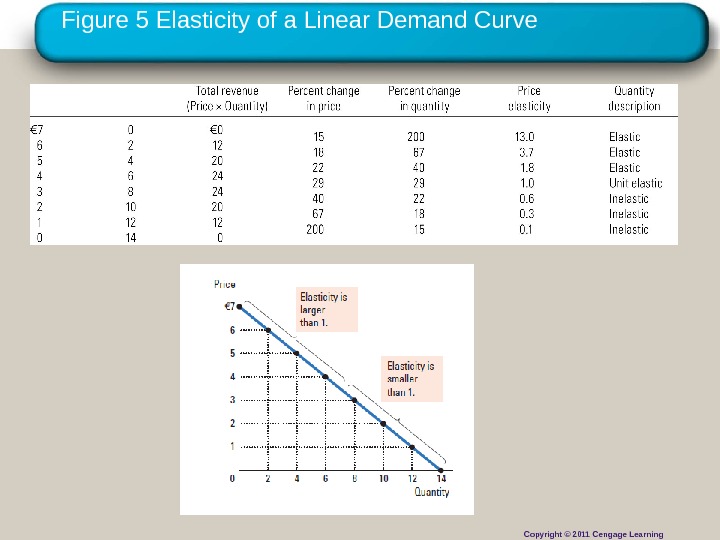
Copyright © 2010 Cengage Learning. Figure 5 Elasticity of a Linear Demand Curve Copyright © 2011 Cengage Learning
Figure 6 The Price Elasticity of Supply (1) (a) Perfectly inelastic supply: Elasticity equals 0 € 5 4 Supply Quantity 100 01. An increase in price. . . 2. . leaves the quantity supplied unchanged. Price Copyright © 2011 Cengage Learning
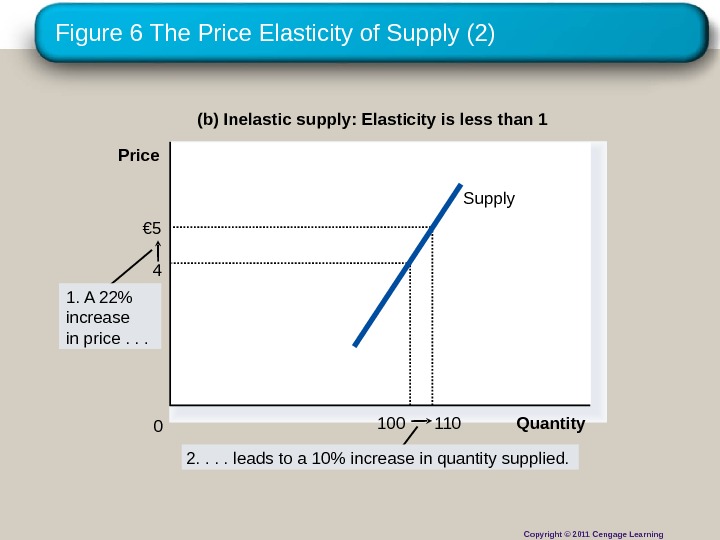
Figure 6 The Price Elasticity of Supply (2) (b) Inelastic supply: Elasticity is less than 1 110€ 5 1004 Quantity 01. A 22% increase in price. . . Price 2. . leads to a 10% increase in quantity supplied. Supply Copyright © 2011 Cengage Learning
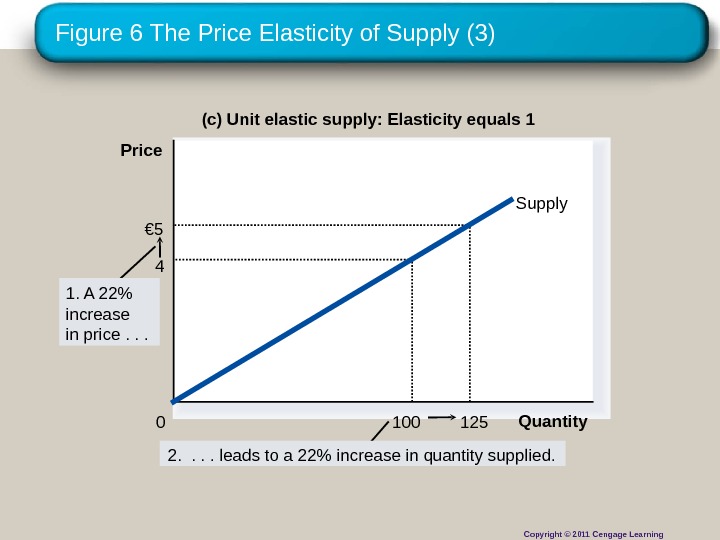
Figure 6 The Price Elasticity of Supply (3) (c) Unit elastic supply: Elasticity equals 1 125€ 5 1004 Quantity 0 Price 2. . leads to a 22% increase in quantity supplied. 1. A 22% increase in price. . . Supply Copyright © 2011 Cengage Learning
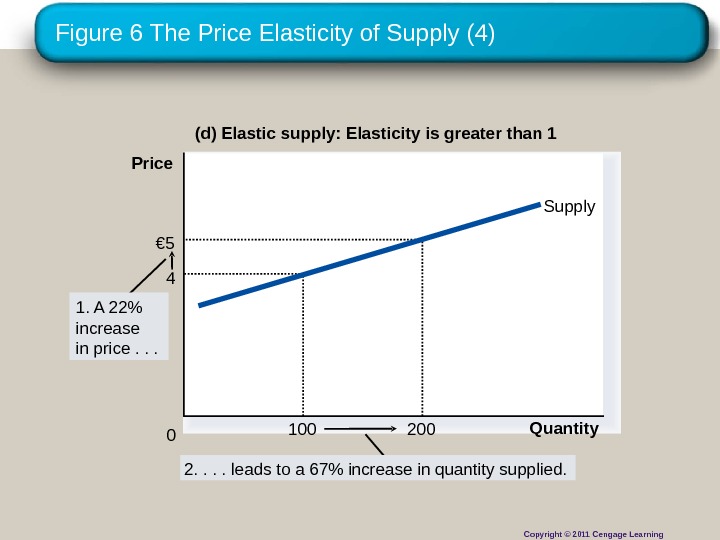
Figure 6 The Price Elasticity of Supply (4) (d) Elastic supply: Elasticity is greater than 1 Quantity 0 Price 1. A 22% increase in price. . . 2. . leads to a 67% increase in quantity supplied. 4 100€ 5 200 Supply Copyright © 2011 Cengage Learning
Figure 6 The Price Elasticity of Supply (5) (e) Perfectly elastic supply: Elasticity equals infinity Quantity 0 Price € 4 Supply 3. At a price below € 4, quantity supplied is zero. 2. At exactly € 4, producers will supply any quantity. 1. At any price above € 4, quantity supplied is infinite. Copyright © 2011 Cengage Learning
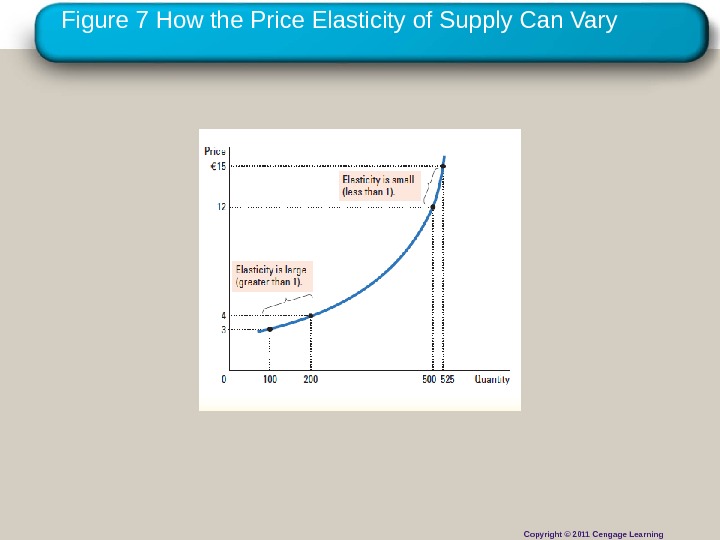
Copyright © 2010 Cengage Learning. Figure 7 How the Price Elasticity of Supply Can Vary Copyright © 2011 Cengage Learning
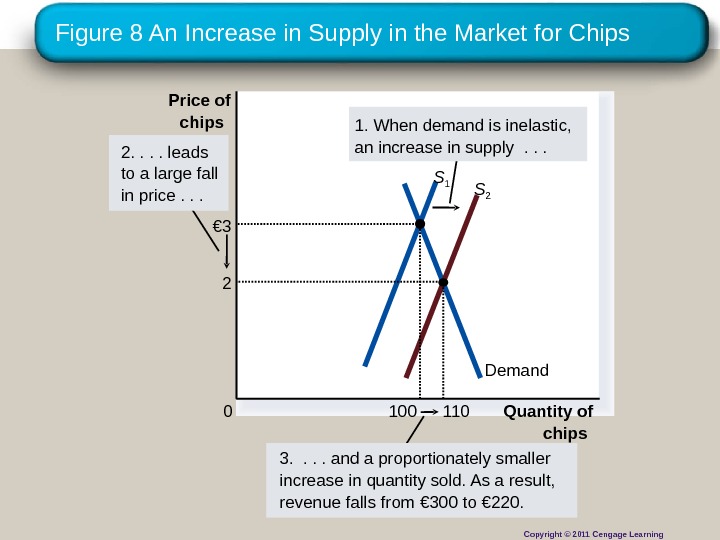
Figure 8 An Increase in Supply in the Market for Chips Quantity of chips 0 Price of chips 3. . and a proportionately smaller increase in quantity sold. As a result, revenue falls from € 300 to € 220. Demand. S 1 S 22. . leads to a large fall in price. . . 1. When demand is inelastic, an increase in supply. . . 2 110€ 3 100 Copyright © 2011 Cengage Learning
Copyright © 2010 Cengage Learning. Table 1 Prices of 7 -night Ski Holidays in Austria, from London Copyright © 2011 Cengage Learning
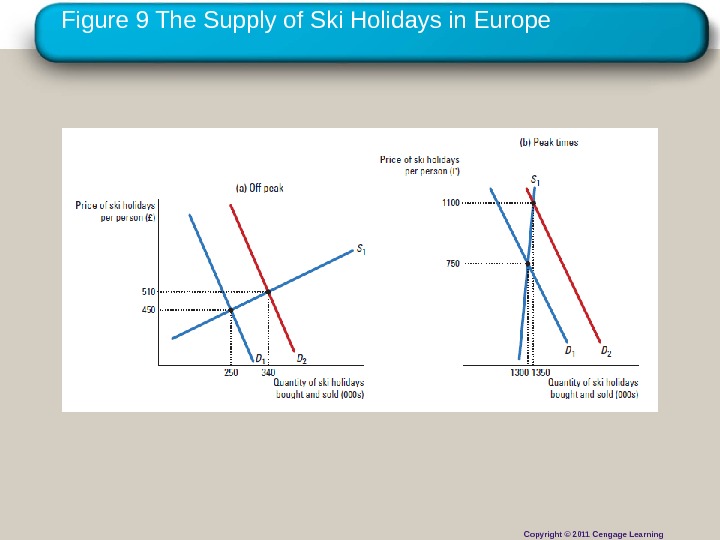
Copyright © 2010 Cengage Learning. Figure 9 The Supply of Ski Holidays in Europe Copyright © 2011 Cengage Learning
Copyright © 2010 Cengage Learning. Figure 10 Policies to Reduce the Use of Illegal Drugs Copyright © 2011 Cengage Learning