98c6d0058d8f9dc8ec64ad27a2d58252.ppt
- Количество слайдов: 155
 Personal Lines P-C Insurance Markets: Trends, Challenges & Opportunities for 2012 & Beyond Insurance Information Institute September 18, 2012 Robert P. Hartwig, Ph. D. , CPCU, President & Economist Insurance Information Institute 110 William Street New York, NY 10038 Tel: 212. 346. 5520 Cell: 917. 453. 1885 bobh@iii. org www. iii. org
 Presentation Outline n Personal Lines Growth Overview w Auto, Home: US and by State n Personal Lines Growth Drivers w Exposure, Pricing Factors n n n n n Personal Lines Profitability Analysis Personal Auto Ad Spend Trends Catastrophe Loss Trends: US & Local Impacts Reinsurance Market Overview & Outlook Cyclical Drivers in Personal Lines Private Passenger Auto Performance Distribution Trends Telematics: Usage-Based Insurance —Trends & Challenges P/C Financial Overview & Outlook: The Role of Cyclicality n n Low Interest Rates: Impact of Persistent Record Low Yields Economic Overview: Exposure Drivers Regulatory Environment “Report Card” Q&A w w Profitability Premium Growth Capital, Capacity and Financial Strength Underwriting Performance 2
 Personal Lines Growth Analysis Growth Trajectories Differ Substantially by Line, by State and Over Time 3
 Distribution of Direct Premiums Written by Segment/Line, 2010 Distribution Facts n Personal/Commercial lines split has been about 50/50 for many years; Personal Lines overtook Commercial Lines in 2010 n Pvt. Passenger Auto is by far the largest line of insurance and is currently the most important source of industry profits n Billions of additional dollars in homeowners insurance premiums are written by staterun residual market plans Sources: A. M. Best; Insurance Information Institute research. Commercial Lines $226. 8 B/49% Homeowners $68. 2 B/15% Pvt. Pass Auto $165. 0 B/36% 4
 Auto & Home vs. All Lines, Net Written Premium Growth, 2000– 2013 F While homeowners insurance has grown faster than auto over the past decade, auto is generally more profitable Average 2000 -2010 Auto = 2. 7 Home = 6. 2% All Lines = 3. 6% Sources: A. M. Best (2000 -2012 F); Insurance Information Institute (2013 F). 5
 Private Passenger Auto Insurance Net Written Premium, 2000– 2011 $ Billion PP Auto premiums written are recovering from a period of flat growth attributable to the weak economy impacting new vehicle sales, car choice, and increased price sensitivity among consumers Sources: A. M. Best; Insurance Information Institute. 6
 Commercial Auto Insurance Net Written Premium, 2000– 2011 $ Billion In contrast to positive PP Auto NPW growth, Commercial Auto premiums are down 21. 3% since 2005 through 2011 due to soft market conditions in commercial lines and negative exposure trends, though growth resumed in 2012 Sources: A. M. Best; Insurance Information Institute. 7
 Direct Premiums Written: Auto Percent Change by State, 2006 -2011 Top 25 States Texas was the fastest growing state between 2006 and 2011 Sources: SNL Financial LLC; Insurance Information Institute. 8
 Direct Premiums Written: Auto Percent Change by State, 2006 -2011 Bottom 25 States Maine saw the biggest drop in premiums written between 2006 and 2011 Sources: SNL Financial LLC; Insurance Information Institute. 9
 Homeowners Insurance Net Written Premium, 2000– 2011 $ Billions Homeowners insurance NWP continues to rise (up 95% 2000 -2011) despite very little unit growth in recent years. Reasons include rate increases, especially in coastal zones, ITV endorsements (e. g. , “inflation guards”), and inelastic demand Sources: A. M. Best; Insurance Information Institute. 10
 Average Premiums For Home Insurance By State, 2009* (1) Top 25 States *Latest available. (1) Based on the HO-3 homeowner package policy for owner-occupied dwellings, 1 to 4 family units. Provides “all risks” coverage (except those specifically excluded in the policy) on buildings and broad named-peril coverage on personal property, and is the most common package written. Note: Average premium=Premiums/exposure per house years. A house year is equal to 365 days insured coverage for a single dwelling. Source: NAIC; Insurance Information Institute. 11
 Average Premiums For Home Insurance By State, 2009* (1) Bottom 25 States (1) Based on the HO-3 homeowner package policy for owner-occupied dwellings, 1 to 4 family units. Provides “all risks” coverage (except those specifically excluded in the policy) on buildings and broad named-peril coverage on personal property, and is the most common package written. Note: Average premium=Premiums/exposure per house years. A house year is equal to 365 days insured coverage for a single dwelling. Source: © 2010 National Association of Insurance Commissioners (NAIC). Reprinted with permission. Further reprint or distribution strictly prohibited without written permission of NAIC. 12
 Ratio of Avg. Premium for Homeowners Insurance to Median Family Income, 2009 (Percent) Top 25 States *Average homeowners insurance expenditure as a percentage of the 2009 median income for a family of four Sources: Prepared by the Insurance Information Institute, based on data from the U. S. Census and the National Association of Insurance Commissioners. 13
 Ratio of Avg. Premium for Homeowners Insurance to Median Family Income, 2009 (Percent) Bottom 25 States *Average homeowners insurance expenditure as a percentage of the 2009 median income for a family of four Sources: Prepared by the Insurance Information Institute, based on data from the U. S. Census and the National Association of Insurance Commissioners. 14
 Ratio of Avg. Expenditure for Pvt. Passenger Auto Insurance to Median Family Income, 2009 (Percent) Top 25 States *Average auto insurance expenditure as a percentage of the 2009 median income for a family of four Sources: Prepared by the Insurance Information Institute, based on data from the U. S. Census and the National Association of Insurance Commissioners. 15
 Ratio of Avg. Expenditure for Pvt. Passenger Auto Insurance to Median Family Income, 2009 (Percent) Bottom 25 States *Average auto insurance expenditure as a percentage of the 2009 median income for a family of four Sources: Prepared by the Insurance Information Institute, based on data from the U. S. Census and the National Association of Insurance Commissioners. 16
 Personal Lines Growth Drivers: The Economy Is Creating Some Opportunities Consumer Sentiment is Strong Enough to Propel Auto Sales and Insurable Exposures but Not Homes (Yet) 17
 US Real GDP Growth* Real GDP Growth (%) The Q 4: 2008 decline was the steepest since the Q 1: 1982 drop of 6. 8% Recession began in Dec. 2007. Economic toll of credit crunch, housing slump, labor market contraction has been severe but modest recovery is underway 2012 is expected to see slow growth lasting into 2013; Fed’s QE 3 could push 2013 GDP up 0. 2% Demand for Insurance Continues To Be Impacted by Sluggish Economic Conditions, but the Benefits of Even Slow Growth Will Compound and Gradually Benefit the Economy Broadly * Estimates/Forecasts from Blue Chip Economic Indicators. Source: US Department of Commerce, Blue Economic Indicators 9/12; Insurance Information Institute. 18
 Percent Change in Real GDP by State, 2011 Growth varied considerably across states but in total was weak in 2011 with US overall growth at just 1. 7% TX has been an economic growth leader Source: Bureau of Economic Analysis at http: //www. bea. gov/newsreleases/regional/gdp_state/gsp_glance. htm ; Insurance Information Institute. 19
 Consumer Sentiment Survey (1966 = 100) January 2010 through August 2012 Optimism among consumers Increased in August, and is well above year-ago levels; Suggests concern, but not fear on the part of consumers. Consumer confidence has been low for years amid high unemployment, falling home prices and other factors adversely impact consumers, but improved substantially in late 2011 and early 2012 Source: University of Michigan; Insurance Information Institute 20
 Unemployment and Underemployment Rates: Stubbornly High in 2012, But Falling January 2000 through August 2012, Seasonally Adjusted (%) Recession ended in November 2001 Unemployment kept rising for 19 more months U-6 went from 8. 0% in March 2007 to 17. 5% in October 2009; Stood at 14. 7% in Aug. 2012 Recession began in December 2007 Unemployment stood at 8. 1% in Aug. 2012 Unemployment peaked at 10. 1% in October 2009, highest monthly rate since 1983. Aug 12 Peak rate in the last 30 years: 10. 8% in November December 1982 Stubbornly high unemployment and underemployment constrain overall economic growth, but the job market is now clearly improving Source: US Bureau of Labor Statistics; Insurance Information Institute. 21
 Cumulative Change in Private Sector Employment: Jan. 2010—August 2012 January 2010 through August 2012* (Millions) Job gains and pay increases have added more than $600 billion to payrolls since Jan. 2010 Cumulative job gains through Aug. 2012 totaled 4. 735 million Private Employers Added 4. 74 million Jobs Since Jan. 2010 After Having Shed 4. 66 Million Jobs in 2009 and 3. 81 Million in 2008 (State and Local Governments Have Shed Hundreds of Thousands of Jobs) Source: US Bureau of Labor Statistics: http: //www. bls. gov/ces/home. htm; Insurance Information Institute 22
 As a Group, Households Are Still* Reducing Debt & Related Obligations Financial Obligations Ratio: Mortgage and consumer debt service, auto lease, residence rent, HO insurance, and property tax payments as % of personal disposable income. Decline began in 2007: Q 4. It will be tough to shrink this ratio further if interest rates and property taxes rise. *through 2012: Q 1 (latest data, posted on June 22, 2012) Source: Federal Reserve Board, at http: //www. federalreserve. gov/releases/housedebt
 As a Group, Households Are Still* Reducing Debt & Related Obligations Debt Service as a Percent of Personal Disposable Income Peak at 11. 3% in 2007: Q 3 Latest (2012: Q 1) at 9. 2% Latest (2012: Q 1) at 5. 04% Peak at 6. 57% in 2005: Q 1 *Includes payments on mortgage debt, homeowners’ insurance, and property taxes. **Includes payments on consumer debt and automobile leases. *through 2012: Q 1 (latest data, posted on June 22, 2012). Source: Federal Reserve Board, at http: //www. federalreserve. gov/releases/housedebt
 Interest Rate on 30 -Year, Fixed-Rate Conventional Home Mortgages, Monthly, 2000 -2012 Source: Federal Reserve Board, at http: //www. federalreserve. gov/releases/h 15/data. htm
 Personal Lines Growth Drivers Rate is Presently a Bigger Driver than Exposure 27
 Monthly Change* in Auto Insurance Prices, 1991– 2012* Cyclical peaks in PP Auto tend to occur approximately every 10 years (early 1990 s, early 2000 s and likely the early 2010 s) “Hard” markets tend to occur during recessionary periods Pricing peak occurred in 2010 at 5. 1%, falling to 2. 8% by Mar. 2012 The Aug. 2012 reading of 3. 8% is up from 3. 4% a year earlier *Percentage change from same month in prior year; through Aug. 2012; seasonally adjusted Note: Recessions indicated by gray shaded columns. Sources: US Bureau of Labor Statistics; National Bureau of Economic Research (recession dates); Insurance Information Institutes. 28
 Monthly Change* in Auto Insurance Prices, January 2005 - August 2012 (Percent Change from same month, prior year) Auto Insurance Price Increases Averaged 5. 1% in 2010 over 2009, After Averaging 4. 5% in 2009 over 2008. Pricing weakened materially in 2011 and early 2012 but has strengthened since then PPA Auto, like most p/c lines, exhibits strong cyclicality in pricing. Prices rose from 2000 to late 2005, were flat/falling in 2006 and 2007 before beginning to rise gain in 2008. Underwriting performance remained strong even when prices were flat or falling due to improvements in underlying frequency and severity trends *Percentage change from same month in prior year, seasonally adjusted. Sources: US Bureau of Labor Statistics; Insurance Information Institute 29
 Personal Auto: Premiums vs. Loss Cost Spread, Dec. 1997 - Aug. 2012 Margin improvement; CR improves to 94. 3 by 2004 Margin compression; CR deteriorates to 109. 5 by 2000 Margin Commercial Lines compression; CR $226. 8 B/49% rises above 100 in 2008 Homeowners $68. 2 B/15% Price gains Pvt. Pass Auto exceeded loss cost $165. 0 B/36%increase (pure premium) by 1. 2 percentage points in Aug. 2012 Sources: Bureau of Labor Statistics, ISO, Evercore Group LLC; Insurance Information Institute. 30
 Average Expenditures on Auto Insurance The average expenditure on auto insurance is lower today than it was in 2004 Countrywide Auto Insurance Expenditures Decreased by 0. 8% in 2008 and 0. 5% in 2009 and Increased 3. 0% in 2010 (est. ), 2. 0% in 2011 (est. ) and 2. 8% in 2012 (forecast) * Insurance Information Institute Estimates/Forecasts Source: NAIC, Insurance Information Institute estimate for 2010 -2013 based on CPI and other data. 31
 Average Expenditures For Auto Insurance By State, 2009 Top 25 States Note: Average expenditure=Total written premium/liability car years. A car year is equal to 365 days of insured coverage for a single vehicle. Source: © 2010 National Association of Insurance Commissioners. 32
 Average Expenditures For Auto Insurance By State, 2009 Bottom 25 States Note: Average expenditure=Total written premium/liability car years. A car year is equal to 365 days of insured coverage for a single vehicle. Source: © 2010 National Association of Insurance Commissioners. 33
 Ratio of Avg. Expenditure for Pvt. Passenger Auto Insurance to Median Family Income, 2009 (Percent) Top 25 States *Average auto insurance expenditure as a percentage of the 2009 median income for a family of four Sources: Prepared by the Insurance Information Institute, based on data from the U. S. Census and the National Association of Insurance Commissioners. 34
 Ratio of Avg. Expenditure for Pvt. Passenger Auto Insurance to Median Family Income, 2009 (Percent) Bottom 25 States *Average auto insurance expenditure as a percentage of the 2009 median income for a family of four Sources: Prepared by the Insurance Information Institute, based on data from the U. S. Census and the National Association of Insurance Commissioners. 35
 Auto/Light Truck Sales, 1999 -2022 F (Millions of Units) New auto/light truck sales fell to the lowest level since the late 1960 s. Forecast for 2012 -13 is still far below 1999 -2007 average of 17 million units, but a recovery is underway. Job growth and improved credit market conditions will boost auto sales in 2012 and beyond Car/Light Truck Sales Will Continue to Recover from the 2009 Low Point, Bolstering the Auto Insurer Growth and the Manufacturing Sector. Source: U. S. Department of Commerce; Blue Chip Economic Indicators (10/11 and 9/12); Insurance Information Institute. 36
 Do Changes in Miles Driven Affect Auto Collision Claim Frequency? Paid Claim Frequency = (No. of paid claims)/(Earned Car Years) x 100 People drover 1. 2% fewer miles in 2011 and collision frequency was relatively flat Sources: Federal Highway Administration (http: //www. fhwa. dot. gov/ohim/tvtw/tvtpage. cfm; ISO Fast Track Monitoring System, Private Passenger Automobile Fast Track Data: 1 st Qtr. 2012 and earlier reports. *2011 ISO figure is for 12 months ending 12/31/2011; FHA data is for 12 months ending Dec. 2011.
 New Private Housing Starts, 1990 -2022 F (Millions of Units) The plunge and lack of recovery in homebuilding and in construction in general is holding back payroll exposure growth New home starts plunged 72% from 2005 -2009; A net annual decline of 1. 49 million units, lowest since records began in 1959 Job growth, improved credit market conditions and demographics will eventually boost home construction Little Exposure Growth Likely for Homeowners Insurers Until at least 2014. Also Affects Commercial Insurers with Construction Risk Exposure, Surety Source: U. S. Department of Commerce; Blue Chip Economic Indicators (10/11 and 9/12); Insurance Information Institute. 39
 Value of Construction Put in Place, June 2012 vs. July 2011* Growth (%) Private: +15. 0% Private sector construction activity is up in both the residential and nonresidential segments Public: -0. 7% Public sector construction activity remains depressed Overall Construction Activity is Up, But Growth Is Entirely in the Private Sector as State/Local Government Budget Woes Continue *seasonally adjusted Source: U. S. Census Bureau, http: //www. census. gov/construction/c 30 index. html ; Insurance Information Institute. 40
 Average Square Footage of Completed New Homes in U. S. , 1973 -2011 Square Ft The average size of completed new homes often falls in recessions (yellow bars), but historically bounces back in expansions The trend toward building larger homes reversed from 2008 - 2010, affecting exposure growth beyond the decline in number of units built. Rising again in 2011. The average size of completed new homes fell by 147 square feet (5. 75%) from 2008 -2010. This was the largest recession-based drop in nearly four decades. Source: U. S. Census Bureau: http: //www. census. gov/const/www/quarterly_starts_completions. pdf; Insurance Information Institute. 41
 State Population Growth Rate Projections, 2010 -2020* Projected Population Growth Highest Growth Rate States Lowest Growth Rate States U. S. overall: +8. 7% The Mountain West region is projected to grow the most from now to 2020 (up 17. 6%), followed by the South Atlantic (up 14. 5%) and Pacific (up 11. 2%). The Mid-Atlantic is projected to be the slowest-growing region (up 1. 9%). *based on 2000 census. Source: http: //www. census. gov/population/www/projectionsagesex. html Table 7 42
 Average Premium for Home Insurance Policies** Home insurance premiums are rising in response to higher catastrophe losses * Insurance Information Institute Estimates/Forecasts **Excludes state-run insurers. Source: NAIC, Insurance Information Institute estimates 2010 -2012 based on CPI and other data. 43
 Direct Premiums Written: Home Percent Change by State, 2006 -2011 Top 25 States Arkansas was the fastest growing state between 2006 and 2011 Sources: SNL Financial LC; Insurance Information Institute. 44
 Direct Premiums Written: Home Percent Change by State, 2006 -2011 Bottom 25 States Nevada was the slowest growing state between 2006 and 2011 *FL data are for the period 2005 -2010. Data for 2011 inclusive of Florida Citizens are not yet available. Sources: SNL Financial LC; Insurance Information Institute. 45
 U. S. Residual Market: Total Policies In-Force (1990 -2011) (000) Katrina, Rita and Wilma 4 Florida Hurricanes Hurricane Andrew In the 22 -year period between 1990 and 2011, the total number of policies in-force in the residual market (FAIR & Beach/Windstorm) Plans has more than tripled. Source: PIPSO; Insurance Information Institute
 U. S. Residual Market Exposure to Loss ($ Billions) Katrina, Rita and Wilma 4 Florida Hurricanes Hurricane Andrew In the 22 -year period between 1990 and 2011, total exposure to loss in the residual market (FAIR & Beach/Windstorm) Plans has surged from $54. 7 billion in 1990 to a record high of $884. 7 billion in 2011. Source: PIPSO; Insurance Information Institute (I. I. I. ). 47
 Personal Auto Ad Spend Trends Growth in Ad Spend Remains Robust Among Many Top Auto Insurers 49
 Advertising Spend by Select Personal Auto Writers: 1998— 2011 Percentage Change (%) Personal auto ad spend is volatile, but has increased sharply since 1998 (+744%) among largest insurers Major Commercial Lines Renewed Uniformly Upward in Q 4: 2011 for Only the Second Time Since 2003; Property Lines & Workers Comp Leading the Way *Includes Allstate, GEICO, State Farm, Progressive, Nationwide, Farmers Source: SNL Financial, Evercore Group LLC; Insurance Information Institute. 50
 Advertising Spend Change by Select Personal Auto Writers: 2011 vs. 2010 Percentage Change (%) Farmers led the industry in 2011 in terms of increase in personal auto ad spend Many of the Industry’s Largest Personal Auto Writers Increased Ad Spend Well Above Growth in the Line Overall Source: SNL Financial, Evercore Group LLC; Insurance Information Institute. 51
 Advertising Spend Change by Select Personal Auto Writers: 2011 vs. 2010 $ Millions Source: SNL Financial, Evercore Group LLC. GEICO’s ad spend is still well above that of any other auto insurer, at close to $1 billion in 2011 52
 Personal Lines Profitability Analysis Significant Variability Over Time and Across States 53
 Return on Net Worth: All P-C Lines vs. Homeowners & Pvt. Pass. Auto, 1990 -2010* (Percent) Average RNW: 1990 -2010* Hurricane Andrew All P-C Lines: 7. 9% PP Auto: 8. 9% Homeowners: 0. 7%** Pvt. Pass. Auto Has Consistently Outperformed the P-C Industry as a Whole. Homeowners Volatility is Associated Primarily With Coastal Exposure Issues *Latest available. **Excluding 1992, the Hurricane Andrew, produces a homeowners RNW of 3. 5%. Sources: NAIC. 54
 Return on Net Worth: All P-C Lines vs. Pvt. Pass. Auto, 1990 -2010* (Percent) Average RNW: 1990 -2010* All P-C Lines: 7. 9% PP Auto: 8. 9% Pvt. Pass. Auto Profitability Has Exceeded the P-C Industry as a Whole in 13 of the 21 Years from 1990 -2010 (Inclusive) *Latest available. Sources: NAIC. 55
 Return on Net Worth: All P-C Lines vs. Homeowners, 1990 -2010* (Percent) Average RNW: 1990 -2009* All P-C Lines: 7. 9% Homeowners: 3. 5%** Homeowners Insurance Is Considerably More Volatile than the Market Overall Due to Coastal Exposure and Interior Wind/Hail Events *Latest available. **Excluding Hurricane Andrew (1992); including 1992 produces an average homeowners RNW of 0. 7%. Sources: NAIC. 56
 Return on Net Worth: Pvt. Passenger Auto, 10 -Year Average (2001 -2010*) (Percent) Top 25 States Hawaii was the most profitable state for auto insurers from 2001 -2010 *Latest available. Sources: NAIC. 57
 Return on Net Worth: Pvt. Passenger Auto, 10 -Year Average (2001 -2010*) (Percent) Bottom 25 States Michigan was the least profitable state for auto insurers from 2001 -2010 NJ and PA can provide reasonably profitable growth opportunities *Latest available. Sources: NAIC 58
 Return on Net Worth: Homeowners Insurance, 10 -Year Average (2001 -2010*) (Percent) Top 25 States Hawaii was the most profitable state for home insurers from 2001 -2010 due to the absence of hurricanes during this period *Latest available. Sources: NAIC. NJ and PA can provide reasonably profitable growth opportunities 59
 Return on Net Worth: Homeowners Insurance, 10 -Year Average (2001 -2010*) (Percent) Bottom 25 States Hurricanes Katrina and Rita made Louisiana and Mississippi the least profitable states for home insurers from 2001 -2010 *Latest available. Sources: NAIC 60
 U. S. Insured Catastrophe Loss Update 2012 Catastrophe Losses Were Close to “Average” in the First Half of 2012 2011 Was the 5 th Most Expensive Year on Record 61
 US Catastrophe Loss Summary: First Half 2012 n $9. 3 Billion in Insured Losses in the US Arising from 90 CAT Events w Down 62% from $24. 4 B in 2011: H 1; Loss is close to long-term average w Represents 80%+ of global total w Mild winter helped keep first half losses down w Thunderstorm (includes tornado, hail and wind damage) accounted for $8. 8 B or 95% of first half insured losses and represent the 3 rd most expensive spring t-storm season ever n $14. 6 Billion in Economic Losses in the US w Down from approximately $75 B in 2011: H 1 n Mild Winter Helped Keep First Half Insured Losses Down w Lack of heavy precipitation limited spring flood but exacerbated drought conditions n Severe Droughts Now Impacting Central and Southwest Parts of US w Two major wildfires in Colorado in June caused record $500 mill damage in the state w Largest wildfire in New Mexico history occurred in May w Insured crop losses could be high in 2012 n “Active” Early Hurricane Season Isaac likely in the lower end of modeled loss range of $600 M to $2 B w Tropical Storms Beryl and Debby caused minor wind damage and extensive flooding in FL Source: Munich Re; Insurance Information Institute. 62
 Natural Disaster Losses in the United States: First Half 2012 Number of Events Fatalities Estimated Overall Losses (US $m) Estimated Insured Losses (US $m) Severe Thunderstorm 56 69 13, 550 8, 760 Winter Storm 3 3 80 38 Flood 6 0 12 Minor Earthquake 1 0 0 0 Tropical Cyclone 2 1 100 50 Wildfire 22 6 875 500 Totals 90 79 14, 617 9, 348 As of July 1, 2012 Source: MR Nat. Cat. SERVICE 63
 Top 14 Most Costly Disasters in U. S. History (Insured Losses, 2011 Dollars, $ Billions) Taken as a single event, the Spring 2011 tornado and storm season are is the 4 th costliest event in US insurance history Hurricane Irene became the 11 th most expense hurricane in US history *Losses will actually be broken down into several “events” as determined by PCS. Includes losses for the period April 1 – June 30. Sources: PCS; Insurance Information Institute inflation adjustments. 64
 Natural Disasters in the United States, 1980 – 2012: H 1 Number of Events (Annual Totals 1980 – 2011 and First Half 2012) Number There were 90 natural disaster events in the first half of 2012 22 6 61 1 Geophysical (earthquake, tsunami, volcanic activity) Source: MR Nat. Cat. SERVICE Meteorological (storm) Hydrological (flood, mass movement) Climatological (temperature extremes, drought, wildfire) 65
 Losses Due to Natural Disasters in the US, 1980– 2011 (Overall & Insured Losses) (2011 Dollars, $ Billions) (Overall and Insured Losses) 2011 was the 5 th most expensive year on record for insured catastrophe losses in the US. Approximately 50% of the overall cost of catastrophes in the US was covered by insurance in 2011 Overall Losses: $72. 8 Bill Insured Losses: $35. 9 Bill Insured losses (in 2011 values) Overall losses (in 2011 values) Source: MR Nat. Cat. SERVICE © 2011 Munich Re 66
 US Insured Catastrophe Losses ($ Billions, 2011 Dollars) Record Tornado Losses Caused 2011 CAT Losses to Surge US CAT Losses in 2011 Were the 5 th Highest in US History on An Inflation-Adjusted Basis H 1 2012 CAT losses were down $15. 1 B or 62% from $24. 4 B in H 1 2011 *Munich Re figure for H 1 2012. Note: 2001 figure includes $20. 3 B for 9/11 losses reported through 12/31/01 ($25. 9 B 2011 dollars). Includes only business and personal property claims, business interruption and auto claims. Non-prop/BI losses = $12. 2 B ($15. 6 B in 2011 dollars. ) Sources: Property Claims Service/ISO; Insurance Information Institute. 67 67
 2011’s Most Expensive Catastrophes, Insured Losses The Midwest was hard hit by catastrophes in 2011, especially thunderstorms, including tornadoes, hail and high winds **Includes $700 million in flood losses insured through the National Flood Insurance Program. Source: PCS except as noted by “*” which are sourced to Munich Re; Insurance Information Institute.
 U. S. Thunderstorm Loss Trends, 1980 – 2012: H 1 Hurricanes get all the headlines, but thunderstorms are consistent producers of large scale loss. 2008 -2012 are the most expensive years on record. Average thunderstorm losses are up more than 5 fold since the early 1980 s. 2012 will likely be among the top 5 years on record. Source: Property Claims Service, MR Nat. Cat. SERVICE Thunderstorm losses in 2012: H 1 totaled $8. 8 billion, the 3 rd highest first half on record 69
 Insured Homeowners Losses Due to Lightning, 2004 -2011 $ Millions Lightning claims cost insurers an estimated $952. 5 million in 2011, 29. 5% from $735. 5 million in 2004 The Increased Number and Value of Expensive Electronic Devices in Homes is Pushing the Total Lightning Claim Costs Up Even as the Number of Lightning Claims Falls Source: Insurance Information Institute. 70
 U. S. Acreage Burned by Wildfires, 1980 – 2012* 1. 7 millions acres were burned by wildfires in the first half of 2012. Most of the insured losses were in CO totaling close to $500 mill. *Through June 30. Source: National Forest Service, MR Nat. Cat. SERVICE 71
 2012 US Drought: Implications for Crop (Re)Insurers Though drought in the US has diminished in intensity over the past month, wildfire remains a concern *Credit Suisse, P&C Sector Forecast, Sept. 12, 2012. Source: US Drought Monitor: http: //droughtmonitor. unl. edu/ 72
 Combined Ratio Points Associated with Catastrophe Losses: 1960 – 2011* Combined Ratio Points Avg. CAT Loss Component of the Combined Ratio by Decade 1960 s: 1. 04 1970 s: 0. 85 1980 s: 1. 31 1990 s: 3. 39 2000 s: 3. 52 2010 s: 6. 20* The Catastrophe Loss Component of Private Insurer Losses Has Increased Sharply in Recent Decades *Insurance Information Institute estimates for 2010 and 2011 based on A. M. Best data. Notes: Private carrier losses only. Excludes loss adjustment expenses and reinsurance reinstatement premiums. Figures are adjusted for losses ultimately paid by foreign insurers and reinsurers. Source: ISO; Insurance Information Institute. 74
 U. S. Winter Storm Loss Trends, 1980 – 2011 Insured winter storm losses in 2011 totaled $2. 0 billion. Average winter storm losses have nearly doubled since the early 1980 s Source: Property Claims Service, MR Nat. Cat. SERVICE Slide 75 75
 Insured Homeowners Losses Due Dog Bite Liability Claims, 2003 -2011 $ Millions Dog bite liability claims cost insurers an estimated $478. 9 million in 2011, up 47. 7% from $324. 2 million in 2003 The Increased Average Cost per Dog Bite Claim is Pushing Total Dog Bite Liabiity Claim Costs Higher Even as the Number of Lightning Claims Remains Relatively Flat Source: Insurance Information Institute. 78
 Federal Disaster Declarations Patterns: 1953 -2012 Records Were Set for Federal Disaster Declarations in 2010 and 2011—Most Declarations Were Unrelated to Tropical Activity 79
 Number of Federal Disaster Declarations, 1953 -2012* There have been 2, 068 federal disaster declarations since 1953. The average number of declarations per year is 34 from 1953 -2010, though that few haven’t been recorded since 1995. The number of federal disaster declarations set a new record in 2011, with 99, shattering 2010’s record 81 declarations. 31 federal disasters were declared through Sept. 11, 2012 The Number of Federal Disaster Declarations Is Rising and Set New Records in 2010 and 2011 *Through Sept. 11, 2012. Source: Federal Emergency Management Administration; http: //www. fema. gov/disasters; Insurance Information Institute. 80
 Federal Disasters Declarations by State, 1953 – 2012: Highest 25 States* Over the past nearly 60 years, Texas had the highest number of Federal Disaster Declarations *Through Sept. 11, 2012. Includes Puerto Rico and the District of Columbia. Source: FEMA: http: //www. fema. gov/news/disaster_totals_annual. fema; Insurance Information Institute. 81
 Federal Disasters Declarations by State, 1953 – 2012: Lowest 25 States* Over the past nearly 60 years, Utah and Rhode Island had the fewest number of Federal Disaster Declarations *Through Sept. 11, 2012. Includes Puerto Rico and the District of Columbia. Source: FEMA: http: //www. fema. gov/news/disaster_totals_annual. fema; Insurance Information Institute. 82
 Insurers Making a Difference in Impacted Communities Destroyed home in Tuscaloosa. Insurers will pay some 165, 000 claims totaling $2 billion in the Tuscaloosa/ Birmingham areas alone. Presentation of a check to Tuscaloosa Mayor Walt Maddox to the Tuscaloosa Storm Recovery Fund Source: Insurance Information Institute 83
 2012 TORNADO & SEVERE STORM SUMMARY 2012 Got Off to a Worrisome Start, But Is No Repeat of 2011 84
 Number of Tornadoes and Related Deaths, 1990 – 2012* Tornadoes claimed 553 lives in 2011, the most since 1925 972 tornadoes have been recorded so far this year* 2012 Tornado Losses Got Off to an Ominous Beginning, but Slowed. First Half 2012 Insured Losses from Tornadoes and Thunderstorms Totaled $8. 8 B. *Through Sept. 10, 2012. Source: U. S. Department of Commerce, Storm Prediction Center, National Weather Service at http: //www. spc. noaa. gov/climo/online/monthly/newm. html 85
 U. S. Tornado Count, 2005 -2012* There were 1, 897 tornadoes in the US in 2011 far above average, but well below 2008’s record 2012 count is running well behind 2011 *Through Sept. 10, 2012. Source: http: //www. spc. noaa. gov/wcm/ 86
 June 29, 2012 Derecho: Traveled 600 Miles from Midwest to Mid-Atlantic 10 -HOUR RADAR COMPOSITE (2 PM – MIDNIGHT) Millions of people were without power in sweltering heat for days, particularly in Mid-Atlantic states The June 29 derecho traveled 600 miles in just 10 hours—an average speed of 60 MPH! Peak wind gusts 80 -100 MPH. Source: National Weather Service: http: //www. spc. noaa. gov/wcm/20120629 -derecho. png 87
 Location of Tornadoes in the US, 2012* 972 tornadoes killed 68 people through Sept. 10 *Through Sept. 10, 2012. Source: NOAA Storm Prediction Center; http: //www. spc. noaa. gov/climo/online/monthly/2012_annual_summary. html# 88
 Location of Tornadoes in the US, 2011 1, 894 tornadoes killed 553 people in 2011, including at least 340 on April 26 mostly in the Tuscaloosa area, and 130 in Joplin on May 22 Source: NOAA Storm Prediction Center; http: //www. spc. noaa. gov/climo/online/monthly/2011_annual_summary. html# 89
 Location of Large Hail Reports in the US, 2012* There were 6, 755 “Large Hail” reports through Sept. 10, 2012, causing extensive damage to homes, businesses and vehicles *Through Sept. 10, 2012. Source: NOAA Storm Prediction Center; http: //www. spc. noaa. gov/climo/online/monthly/2012_annual_summary. html# 91
 Location of Wind Damage Reports in the US, 2012* Extreme density due to late June derecho There were 13, 317 “Wind Damage” reports through Sept. 10, causing extensive damage to homes and, businesses *Through Sept. 10, 2012. Source: NOAA Storm Prediction Center; http: //www. spc. noaa. gov/climo/online/monthly/2012_annual_summary. html# 93
 Severe Weather Reports, 2012* There were already 21, 046 severe weather reports through Sept. 10; including 972 tornadoes; 6, 755 “Large Hail” reports and 13, 317 high wind events *Through Sept. 10, 2012. Source: NOAA Storm Prediction Center; http: //www. spc. noaa. gov/climo/online/monthly/2012_annual_summary. html# 95
 Severe Weather Reports, 2011 There were 29, 996 severe weather reports in 2011; including 1, 894 tornadoes; 9, 417 “Large Hail” reports and 18, 685 high wind events Source: NOAA Storm Prediction Center; http: //www. spc. noaa. gov/climo/online/monthly/2011_annual_summary. html# 96
 Number of Severe Weather Reports in US, by Type, 2011 Tornadoes accounted for just 6% of all Severe Weather Reports but more than 550 deaths in 2011, the most in 75 years Source: NOAA Storm Prediction Center; http: //www. spc. noaa. gov/climo/online/monthly/2011_annual_summary. html# 97
 Underwriting Trends: Cycle, Catastrophes Are Among 2011 and 2012 Drivers 98
 P/C Insurance Industry Combined Ratio, 2001– 2012: Q 1* As Recently as 2001, Insurers Paid Out Nearly $1. 16 for Every $1 in Earned Premiums Heavy Use of Reinsurance Lowered Net Losses Relatively Low CAT Losses, Reserve Releases Best Combined Ratio Since 1949 (87. 6) Relatively Low CAT Losses, Reserve Releases Cyclical Deterioration Higher CAT Losses, Shrinking Reserve Releases, Toll of Soft Market Avg. CAT Losses, More Reserve Releases Lower CAT Losses * Excludes Mortgage & Financial Guaranty insurers 2008 --2012. Including M&FG, 2008=105. 1, 2009=100. 7, 2010=102. 4, 2011=108. 2; 2012: Q 1=99. 0. Sources: A. M. Best, ISO. 99
 Underwriting Gain (Loss) 1975– 2012: Q 1* ($ Billions) Cumulative underwriting deficit from 1975 through 2011 is $479 B Large Underwriting Losses Are NOT Sustainable in Current Investment Environment * Includes mortgage and financial guaranty insurers in all years. Sources: A. M. Best, ISO; Insurance Information Institute. Underwriting losses in 2011 totaled $36. 5 B, the largest since 2001
 Number of Years with Underwriting Profits by Decade, 1920 s– 2010 s Number of Years with Underwriting Profits Persistently low interest rates will pressure the industry to return to an underwriting profit standard Underwriting Profits Were Common Before the 1980 s (40 of the 60 Years Before 1980 Had Combined Ratios Below 100) – But Then They Vanished. Not a Single Underwriting Profit Was Recorded in the 25 Years from 1979 Through 2003 * 2009 combined ratio excl. mort. and finl. guaranty insurers was 99. 3, which would bring the 2000 s total to 4 years with an u/w profit. **Data for the 2010 s includes 2010 and 2011. Note: Data for 1920– 1934 based on stock companies only. Sources: Insurance Information Institute research from A. M. Best Data. 101
 Combined Ratios by Predominant Business Segment, 2011 vs. 2010 (Percent) Source: ISO/PCI; Insurance Information Institute The combined ratios for both personal and commercial lines insurers jumped y similar amounts in 2011 102
 P/C Reserve Development, 1992– 2013 F Prior year reserve releases totaled $8. 8 billion in the first half of 2010, up from $7. 1 billion in the first half of 2009 Reserve Releases Remained Strong in 2010 But Tapered Off in 2011. Releases Are Expected to Further Diminish in 2012 and 2103 Note: 2005 reserve development excludes a $6 billion loss portfolio transfer between American Re and Munich Re. Including this transaction, total prior year adverse development in 2005 was $7 billion. The data from 2000 and subsequent years excludes development from financial guaranty and mortgage insurance. Sources: Barclays Capital; A. M. Best. 103
 P/C Estimated Loss Reserve Deficiency/ (Redundancy), Excl. Statutory Discount Line of Business 2011 Personal Auto Liability Homeowners Other Liab (incl. Prod Liab) Workers Compensation Commercial Multi Peril Commercial Auto Liability Medical Malpractice Reinsurance—Nonprop Assumed All Other Lines* Total Core Reserves Asbestos & Environmental Total P/C Industry -$1. 8 B -$0. 2 $4. 0 $8. 2 $1. 5 $0. 0 -$4. 0 $3. 4 -$2. 2 $8. 9 $7. 4 $16. 3 B Source: A. M. Best, P/C Review/Preview 2012; Insurance Information Institute. *Excluding mortgage and financial guaranty 104
 SURPLUS/CAPITAL/CAPACITY Have Large CAT Losses Reduced Capacity in the Industry, Pressuring Pricing? 105
 Policyholder Surplus, 2006: Q 4– 2012: Q 1 ($ Billions) 2011: Q 1 Previous Surplus Peak The Industry now has $1 of surplus for every $0. 80 of NPW, close to the strongest claimspaying status in its history. *Includes $22. 5 B of paid-in capital from a holding company parent for one insurer’s investment in a non-insurance business in early 2010. Sources: ISO, A. M. Best. Drop due to near-record 2011 CAT losses Surplus as of 3/31/12 hit an all time record high of $570. 7 B, 0. 7% or $3. 2 B above the previous record set as of 3/31/11. Quarterly Surplus Changes Since 2011: Q 1 Peak 11: Q 2: -$7. 4 B (-1. 0%) 11: Q 3: -$27. 9 B (-4. 6%) 11: Q 4: -$16. 2 B (-2. 5%) 12: Q 1: +$3. 2 B (+0. 7%) 107
 Performance by Segment: Personal Lines 108
 Private Passenger Auto Combined Ratio: 1993– 2012 P Private Passenger Auto Accounts for 34% of Industry Premiums and Remains the Profit Juggernaut of the P/C Insurance Industry Sources: A. M. Best (1990 -2012 F); Insurance Information Institute. 109
 Homeowners Insurance Combined Ratio: 1990– 2012 F Homeowners Performance Deteriorated in 2011 Due to Large Cat Losses. Extreme Regional Variation Can Be Expected Due to Local Catastrophe Loss Activity Sources: A. M. Best (1990 -2012 E); Insurance Information Institute. 110
 Homeowners Multi-Peril Loss & LAE Ratio, 2011: Highest 25 States TN and AL had the worst underwriting performance of all states in 2011 due to high tornado and storm losses Sources: SNL Financial; Insurance Information Institute. 111
 Homeowners Multi-Peril Loss & LAE Ratio, 2011: Lowest 25 States HI and FL had the best performance in 2011 due to the absence of hurricanes/tropical storms impacts in either state last year Sources: SNL Financial; Insurance Information Institute. 112
 REINSURANCE MARKET CONDITIONS Record Global Catastrophes Activity Pressured Pricing in Early 2012, but May Be Easing for 2013 117
 Global Property Catastrophe Rate on Line Index, 1990— 2012 (as of July 1) Property-Cat reinsurance pricing is up about 7% as of 7/1/12 but much more over the past 7 -12 years—a cost that must be reflected in LPI rates Sources: Guy Carpenter; Insurance Information Institute. 118
 Claim Trends in Auto Insurance Rising Costs Held in Check by Falling Frequency: Can That Pattern Be Sustained? 121
 Bodily Injury: Severity Trend Is Up, Frequency Decline Ended and Is Now Flat Annual Change, 2005 through 2012* Cost Pressures Will Increase if BI Severity Increases Continue or Frequency Ticks Up *2012 figure is for the 4 quarters ending with 2012: Q 1. Source: ISO/PCI Fast Track data; Insurance Information Institute 122
 Property Damage Liability: Severity is Up, Frequency Nearly Flat Since 2009 Annual Change, 2005 through 2012* Severity/Frequency Trends Have Been Volatile, But Rising Severity in 2011 Is a Concern *2012 figure is for the 4 quarters ending with 2012: Q 1. Source: ISO/PCI Fast Track data; Insurance Information Institute 123
 No-Fault (PIP) Liability: Severity Trend Remains Adverse* Annual Change, 2005 through 2012** Multiple States Are Experiencing Severe Fraud and Abuse Problems in their No-Fault Systems, Especially FL, MI, NY and NJ *No-fault states included are: FL, HI, KS, KY, MA, MI, MN, NY, ND and UT. **2012 figure is for the 4 quarters ending in 2012: Q 1. Source: ISO/PCI Fast Track data; Insurance Information Institute 124
 Collision Coverage: Severity Trend Is Up While Frequency Is Down in 2012* Annual Change, 2005 through 2012* The Recession, High Fuel Prices Have Helped Temper Frequency and Severity, But this Trend Will Likely Be Reversed Based on Evidence from Past Recoveries *2012 figure is for the 4 quarters ending with 2012: Q 1. Source: ISO/PCI Fast Track data; Insurance Information Institute 125
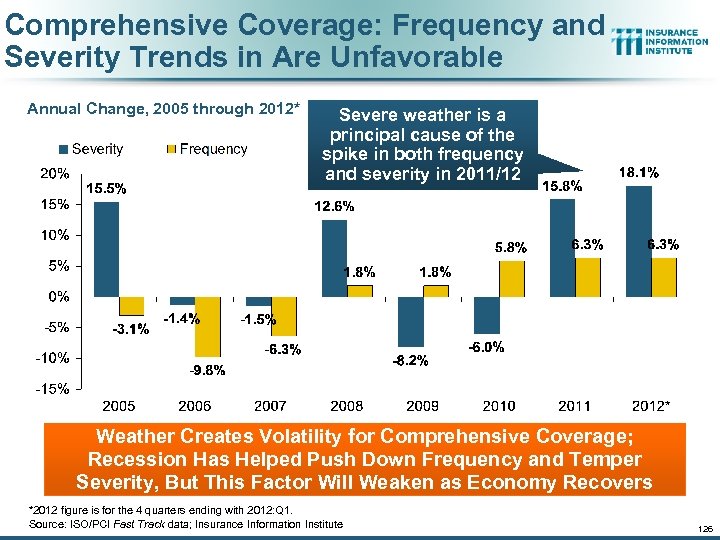 Comprehensive Coverage: Frequency and Severity Trends in Are Unfavorable Annual Change, 2005 through 2012* Severe weather is a principal cause of the spike in both frequency and severity in 2011/12 Weather Creates Volatility for Comprehensive Coverage; Recession Has Helped Push Down Frequency and Temper Severity, But This Factor Will Weaken as Economy Recovers *2012 figure is for the 4 quarters ending with 2012: Q 1. Source: ISO/PCI Fast Track data; Insurance Information Institute 126
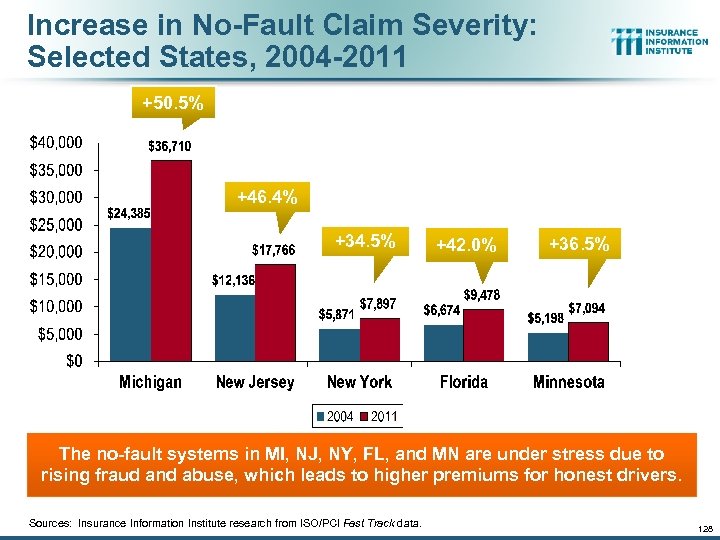 Increase in No-Fault Claim Severity: Selected States, 2004 -2011 +50. 5% +46. 4% +34. 5% +42. 0% +36. 5% The no-fault systems in MI, NJ, NY, FL, and MN are under stress due to rising fraud and abuse, which leads to higher premiums for honest drivers. Sources: Insurance Information Institute research from ISO/PCI Fast Track data. 128
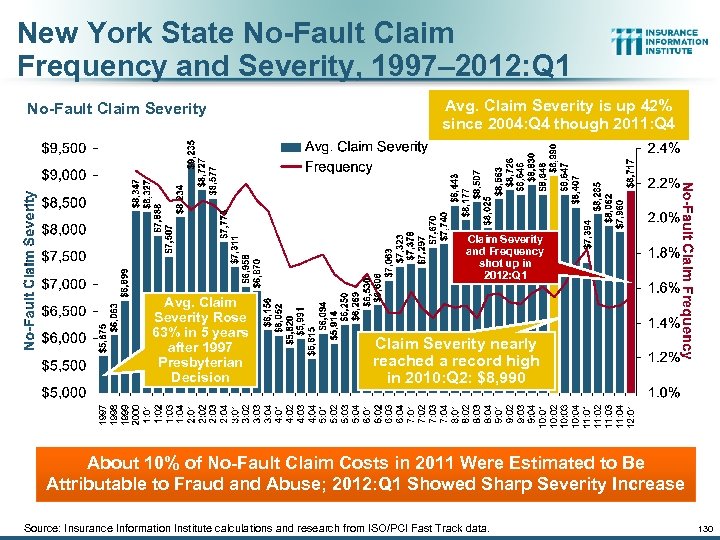 New York State No-Fault Claim Frequency and Severity, 1997– 2012: Q 1 No-Fault Claim Severity Avg. Claim Severity is up 42% since 2004: Q 4 though 2011: Q 4 Claim Severity and Frequency shot up in 2012: Q 1 Avg. Claim Severity Rose 63% in 5 years after 1997 Presbyterian Decision Claim Severity nearly reached a record high in 2010: Q 2: $8, 990 About 10% of No-Fault Claim Costs in 2011 Were Estimated to Be Attributable to Fraud and Abuse; 2012: Q 1 Showed Sharp Severity Increase Source: Insurance Information Institute calculations and research from ISO/PCI Fast Track data. 130
 Distribution Trends Distribution by Channel Type Continues to Evolve 132
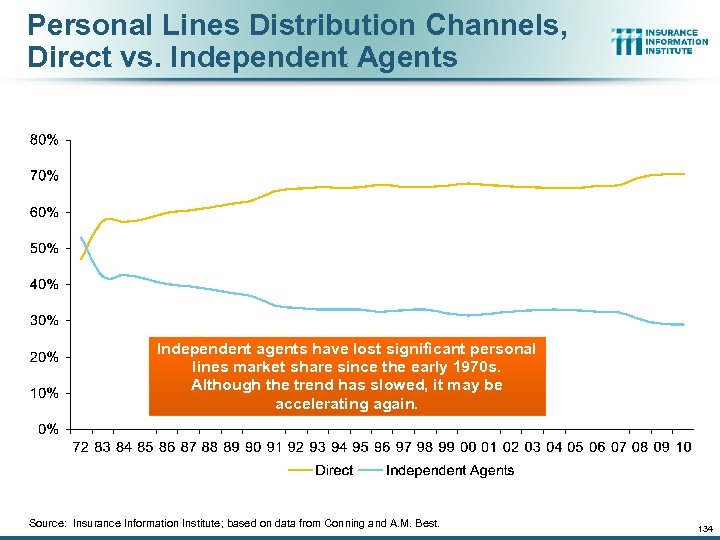 Personal Lines Distribution Channels, Direct vs. Independent Agents Independent agents have lost significant personal lines market share since the early 1970 s. Although the trend has slowed, it may be accelerating again. Source: Insurance Information Institute; based on data from Conning and A. M. Best. 134
 Usage-Based Insurance (UBI): Telematics UBI Is Catching On Among Insurers and Consumers 136
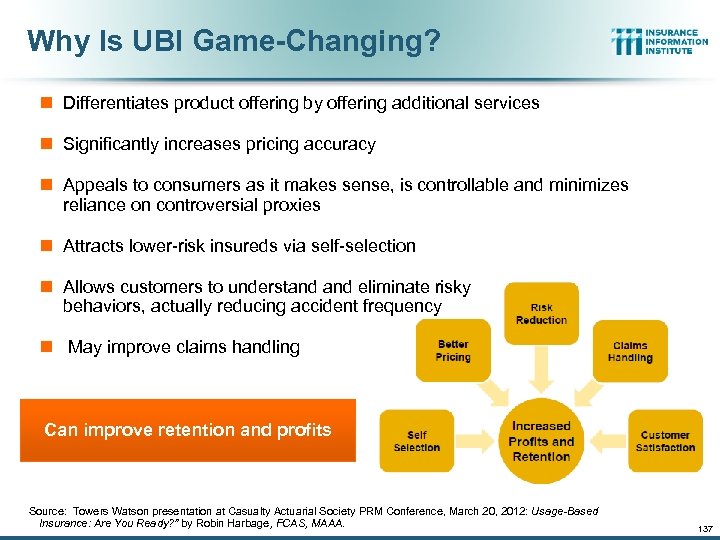 Why Is UBI Game-Changing? n Differentiates product offering by offering additional services n Significantly increases pricing accuracy n Appeals to consumers as it makes sense, is controllable and minimizes reliance on controversial proxies n Attracts lower-risk insureds via self-selection n Allows customers to understand eliminate risky behaviors, actually reducing accident frequency n May improve claims handling Can improve retention and profits Source: Towers Watson presentation at Casualty Actuarial Society PRM Conference, March 20, 2012: Usage-Based Insurance: Are You Ready? ” by Robin Harbage, FCAS, MAAA. 137
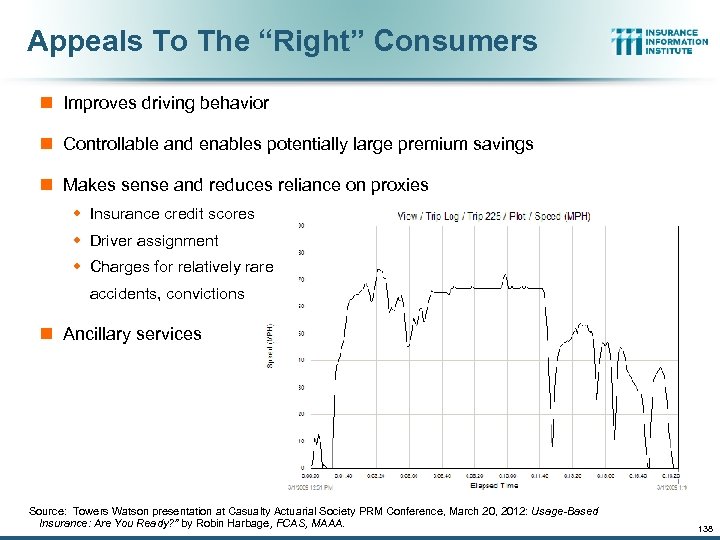 Appeals To The “Right” Consumers n Improves driving behavior n Controllable and enables potentially large premium savings n Makes sense and reduces reliance on proxies w Insurance credit scores w Driver assignment w Charges for relatively rare accidents, convictions n Ancillary services Source: Towers Watson presentation at Casualty Actuarial Society PRM Conference, March 20, 2012: Usage-Based Insurance: Are You Ready? ” by Robin Harbage, FCAS, MAAA. 138
 Current Market Landscape 139
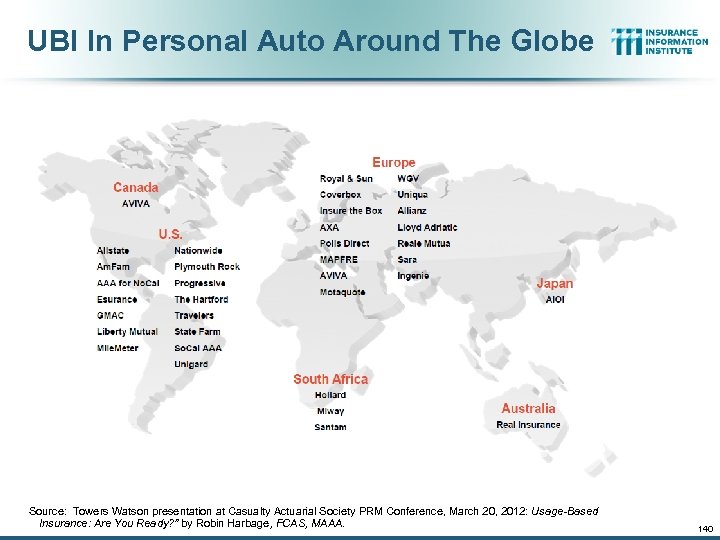 UBI In Personal Auto Around The Globe Source: Towers Watson presentation at Casualty Actuarial Society PRM Conference, March 20, 2012: Usage-Based Insurance: Are You Ready? ” by Robin Harbage, FCAS, MAAA. 140
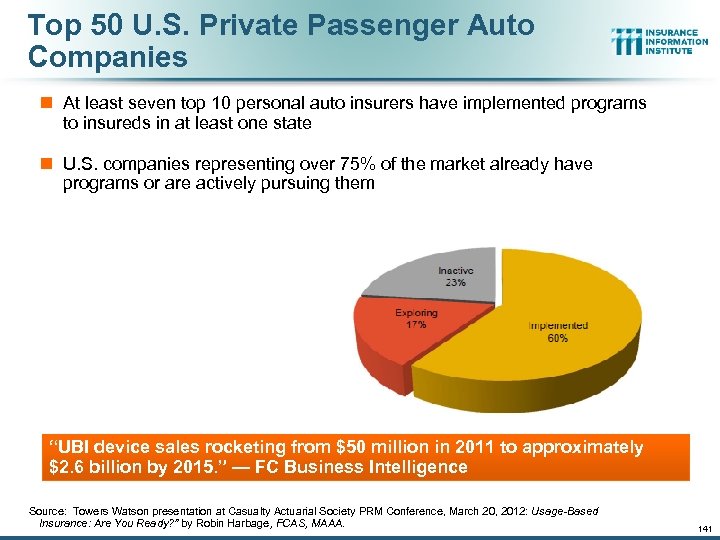 Top 50 U. S. Private Passenger Auto Companies n At least seven top 10 personal auto insurers have implemented programs to insureds in at least one state n U. S. companies representing over 75% of the market already have programs or are actively pursuing them “UBI device sales rocketing from $50 million in 2011 to approximately $2. 6 billion by 2015. ” — FC Business Intelligence Source: Towers Watson presentation at Casualty Actuarial Society PRM Conference, March 20, 2012: Usage-Based Insurance: Are You Ready? ” by Robin Harbage, FCAS, MAAA. 141
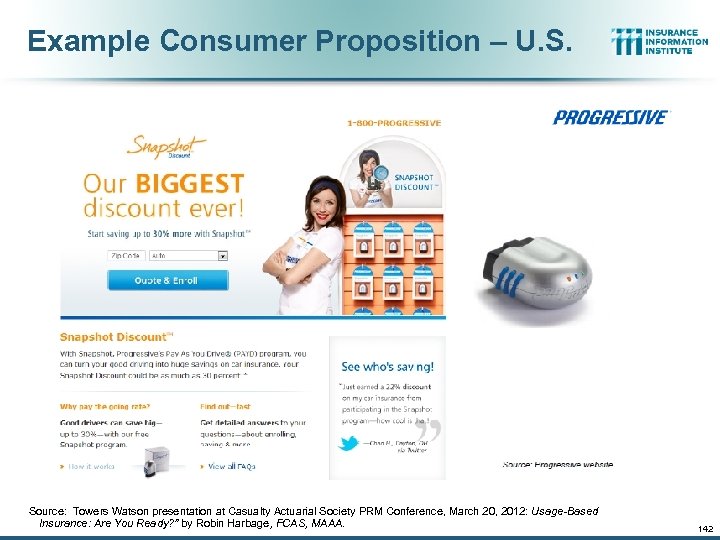 Example Consumer Proposition – U. S. Source: Towers Watson presentation at Casualty Actuarial Society PRM Conference, March 20, 2012: Usage-Based Insurance: Are You Ready? ” by Robin Harbage, FCAS, MAAA. 142
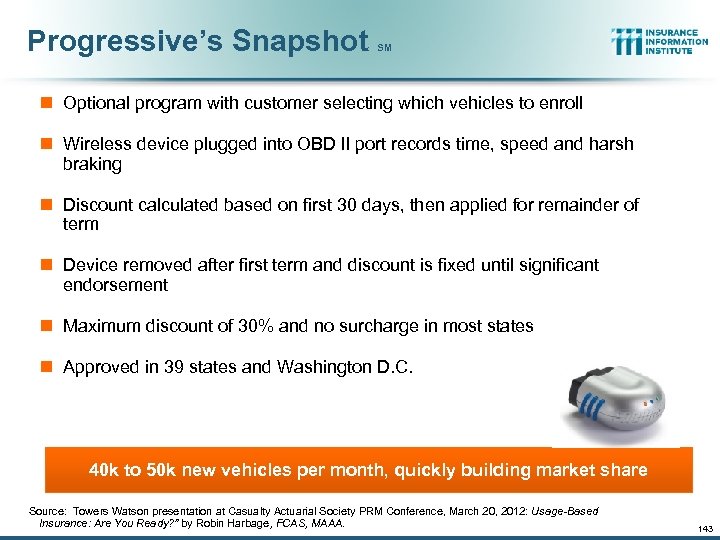 Progressive’s Snapshot SM n Optional program with customer selecting which vehicles to enroll n Wireless device plugged into OBD II port records time, speed and harsh braking n Discount calculated based on first 30 days, then applied for remainder of term n Device removed after first term and discount is fixed until significant endorsement n Maximum discount of 30% and no surcharge in most states n Approved in 39 states and Washington D. C. 40 k to 50 k new vehicles per month, quickly building market share Source: Towers Watson presentation at Casualty Actuarial Society PRM Conference, March 20, 2012: Usage-Based Insurance: Are You Ready? ” by Robin Harbage, FCAS, MAAA. 143
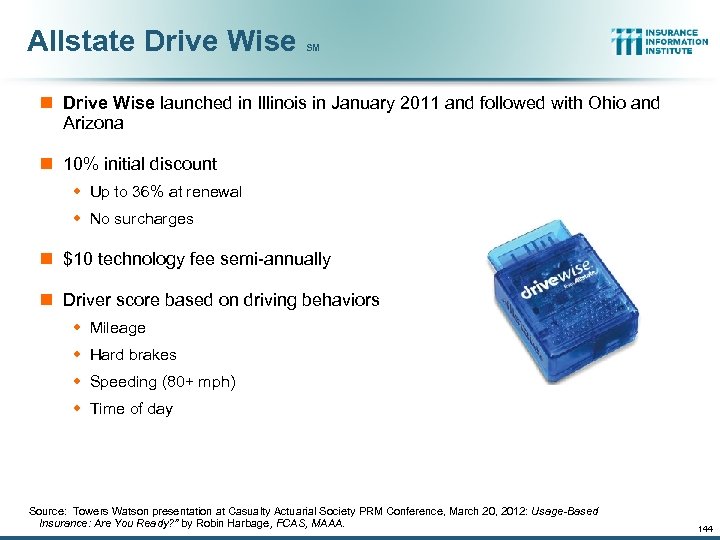 Allstate Drive Wise SM n Drive Wise launched in Illinois in January 2011 and followed with Ohio and Arizona n 10% initial discount w Up to 36% at renewal w No surcharges n $10 technology fee semi-annually n Driver score based on driving behaviors w Mileage w Hard brakes w Speeding (80+ mph) w Time of day Source: Towers Watson presentation at Casualty Actuarial Society PRM Conference, March 20, 2012: Usage-Based Insurance: Are You Ready? ” by Robin Harbage, FCAS, MAAA. 144
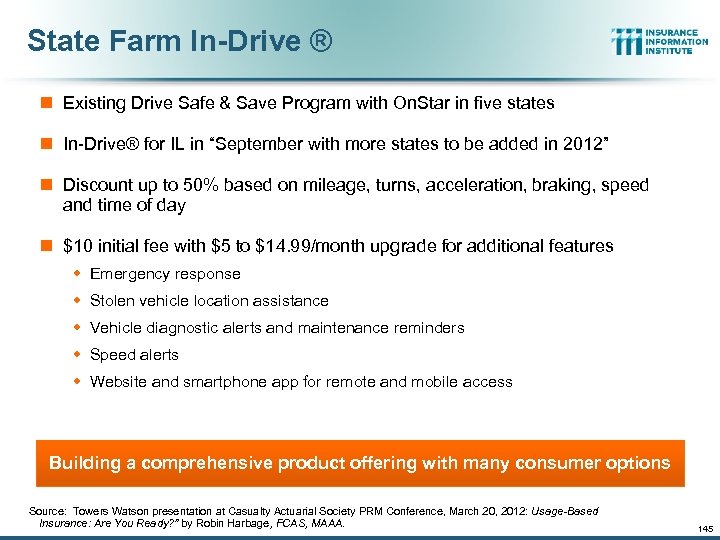 State Farm In-Drive ® n Existing Drive Safe & Save Program with On. Star in five states n In-Drive® for IL in “September with more states to be added in 2012” n Discount up to 50% based on mileage, turns, acceleration, braking, speed and time of day n $10 initial fee with $5 to $14. 99/month upgrade for additional features w Emergency response w Stolen vehicle location assistance w Vehicle diagnostic alerts and maintenance reminders w Speed alerts w Website and smartphone app for remote and mobile access Building a comprehensive product offering with many consumer options Source: Towers Watson presentation at Casualty Actuarial Society PRM Conference, March 20, 2012: Usage-Based Insurance: Are You Ready? ” by Robin Harbage, FCAS, MAAA. 145
 Data Availability 146
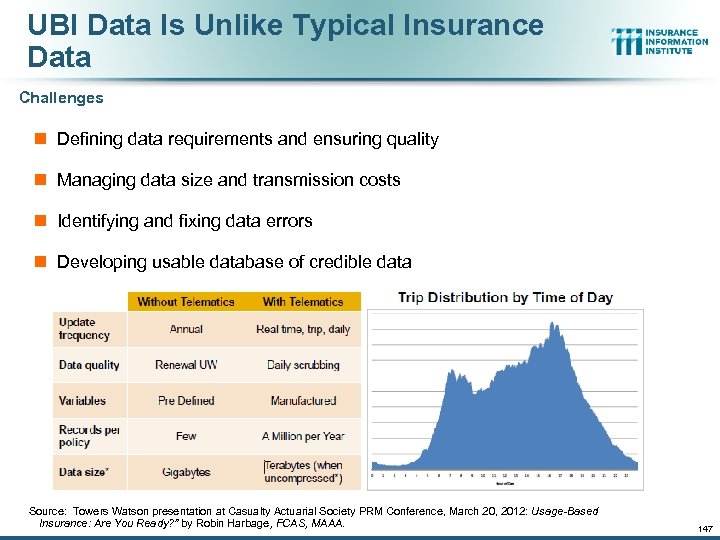 UBI Data Is Unlike Typical Insurance Data Challenges n Defining data requirements and ensuring quality n Managing data size and transmission costs n Identifying and fixing data errors n Developing usable database of credible data Source: Towers Watson presentation at Casualty Actuarial Society PRM Conference, March 20, 2012: Usage-Based Insurance: Are You Ready? ” by Robin Harbage, FCAS, MAAA. 147
 Overcoming Challenges 148
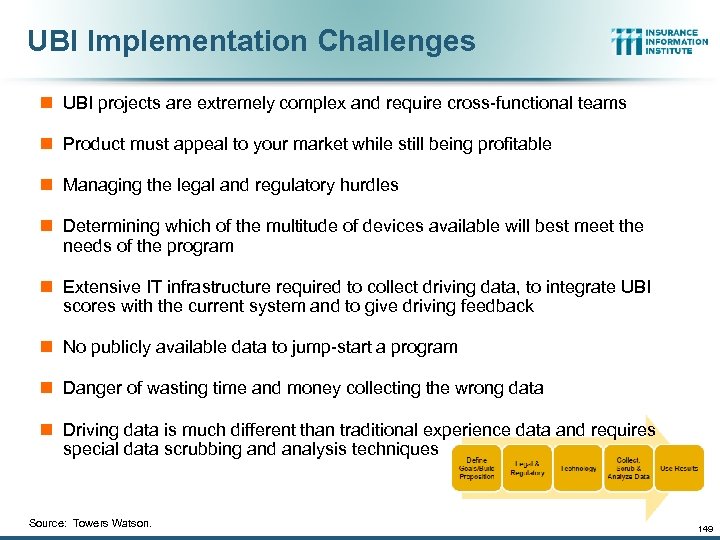 UBI Implementation Challenges n UBI projects are extremely complex and require cross-functional teams n Product must appeal to your market while still being profitable n Managing the legal and regulatory hurdles n Determining which of the multitude of devices available will best meet the needs of the program n Extensive IT infrastructure required to collect driving data, to integrate UBI scores with the current system and to give driving feedback n No publicly available data to jump-start a program n Danger of wasting time and money collecting the wrong data n Driving data is much different than traditional experience data and requires special data scrubbing and analysis techniques Source: Towers Watson. 149
 P/C Insurance Industry Financial Overview Profit Recovery Was Set Back in 2011 by High Catastrophe Loss & Other Factors 150
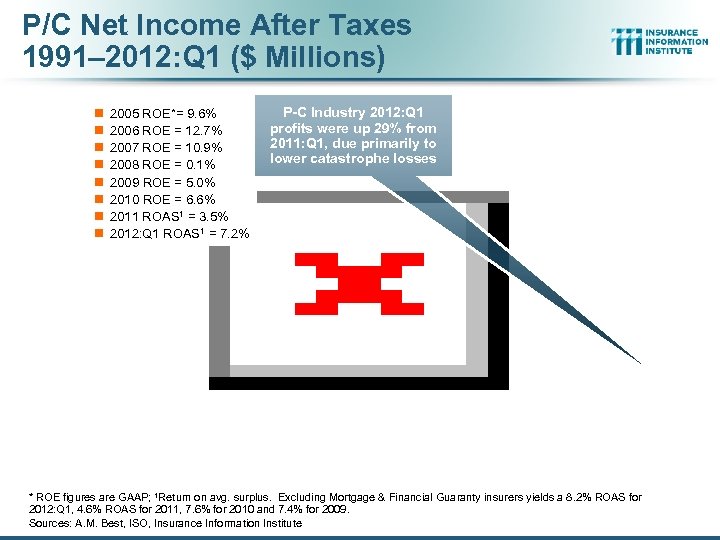 P/C Net Income After Taxes 1991– 2012: Q 1 ($ Millions) n n n n 2005 ROE*= 9. 6% 2006 ROE = 12. 7% 2007 ROE = 10. 9% 2008 ROE = 0. 1% 2009 ROE = 5. 0% 2010 ROE = 6. 6% 2011 ROAS 1 = 3. 5% 2012: Q 1 ROAS 1 = 7. 2% P-C Industry 2012: Q 1 profits were up 29% from 2011: Q 1, due primarily to lower catastrophe losses * ROE figures are GAAP; 1 Return on avg. surplus. Excluding Mortgage & Financial Guaranty insurers yields a 8. 2% ROAS for 2012: Q 1, 4. 6% ROAS for 2011, 7. 6% for 2010 and 7. 4% for 2009. Sources: A. M. Best, ISO, Insurance Information Institute
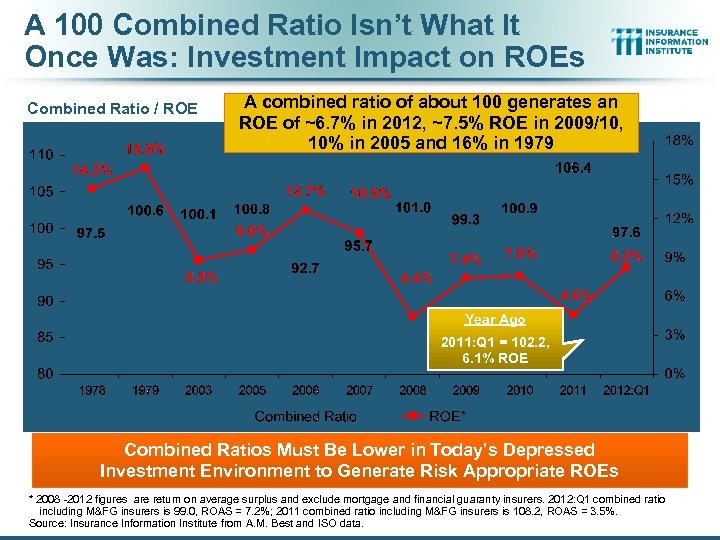 A 100 Combined Ratio Isn’t What It Once Was: Investment Impact on ROEs Combined Ratio / ROE A combined ratio of about 100 generates an ROE of ~6. 7% in 2012, ~7. 5% ROE in 2009/10, 10% in 2005 and 16% in 1979 Year Ago 2011: Q 1 = 102. 2, 6. 1% ROE Combined Ratios Must Be Lower in Today’s Depressed Investment Environment to Generate Risk Appropriate ROEs * 2008 -2012 figures are return on average surplus and exclude mortgage and financial guaranty insurers. 2012: Q 1 combined ratio including M&FG insurers is 99. 0, ROAS = 7. 2%; 2011 combined ratio including M&FG insurers is 108. 2, ROAS = 3. 5%. Source: Insurance Information Institute from A. M. Best and ISO data.
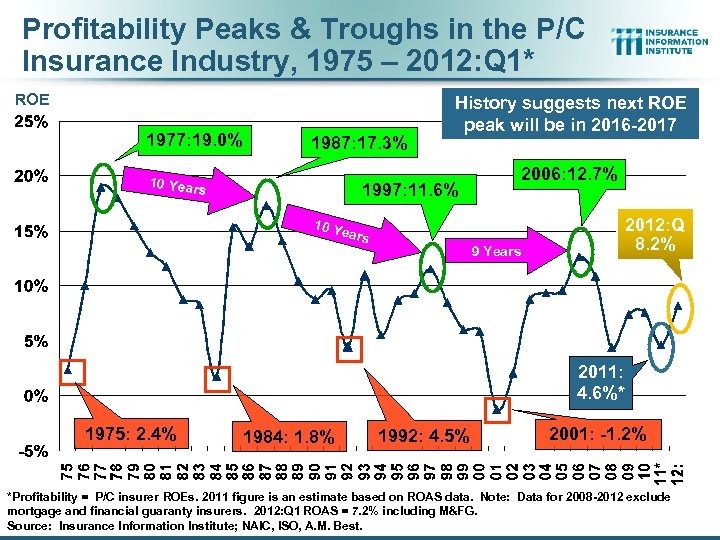 Profitability Peaks & Troughs in the P/C Insurance Industry, 1975 – 2012: Q 1* ROE 1977: 19. 0% 1987: 17. 3% 10 Years History suggests next ROE peak will be in 2016 -2017 1997: 11. 6% 2006: 12. 7% 2012: Q 8. 2% 10 Y ears 9 Years 2011: 4. 6%* 1975: 2. 4% 1984: 1. 8% 1992: 4. 5% 2001: -1. 2% *Profitability = P/C insurer ROEs. 2011 figure is an estimate based on ROAS data. Note: Data for 2008 -2012 exclude mortgage and financial guaranty insurers. 2012: Q 1 ROAS = 7. 2% including M&FG. Source: Insurance Information Institute; NAIC, ISO, A. M. Best.
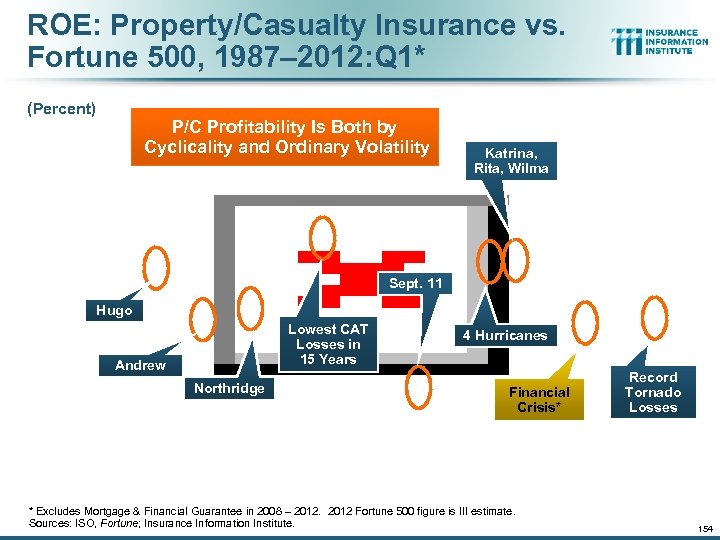 ROE: Property/Casualty Insurance vs. Fortune 500, 1987– 2012: Q 1* (Percent) P/C Profitability Is Both by Cyclicality and Ordinary Volatility Katrina, Rita, Wilma Sept. 11 Hugo Lowest CAT Losses in 15 Years Andrew Northridge 4 Hurricanes Financial Crisis* * Excludes Mortgage & Financial Guarantee in 2008 – 2012 Fortune 500 figure is III estimate. Sources: ISO, Fortune; Insurance Information Institute. Record Tornado Losses 154
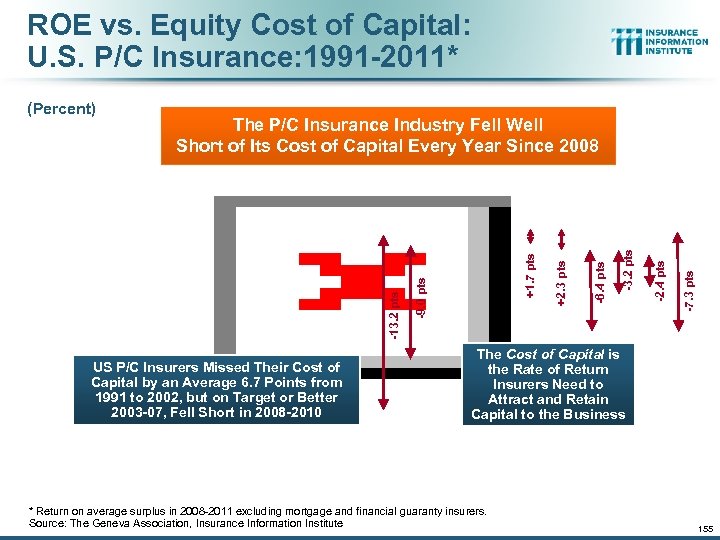 ROE vs. Equity Cost of Capital: U. S. P/C Insurance: 1991 -2011* US P/C Insurers Missed Their Cost of Capital by an Average 6. 7 Points from 1991 to 2002, but on Target or Better 2003 -07, Fell Short in 2008 -2010 -7. 3 pts -2. 4 pts -3. 2 pts -6. 4 pts +2. 3 pts -9. 0 pts +1. 7 pts The P/C Insurance Industry Fell Well Short of Its Cost of Capital Every Year Since 2008 -13. 2 pts (Percent) The Cost of Capital is the Rate of Return Insurers Need to Attract and Retain Capital to the Business * Return on average surplus in 2008 -2011 excluding mortgage and financial guaranty insurers. Source: The Geneva Association, Insurance Information Institute 155
 P/C Premium Growth Cycles Cyclicality is Driven Primarily by the Industry’s Own Underwriting Cycle, Not the Economy 156
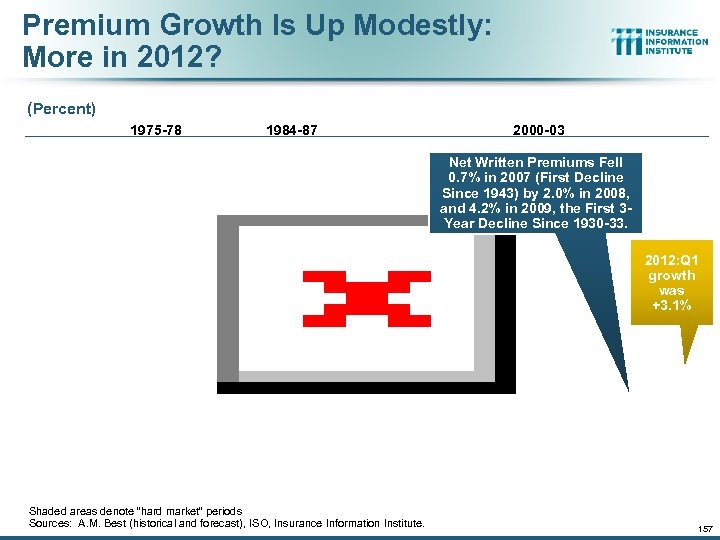 Premium Growth Is Up Modestly: More in 2012? (Percent) 1975 -78 1984 -87 2000 -03 Net Written Premiums Fell 0. 7% in 2007 (First Decline Since 1943) by 2. 0% in 2008, and 4. 2% in 2009, the First 3 Year Decline Since 1930 -33. 2012: Q 1 growth was +3. 1% Shaded areas denote “hard market” periods Sources: A. M. Best (historical and forecast), ISO, Insurance Information Institute. 157
 SURPLUS/CAPITAL/CAPACITY Have Large Catastrophe Losses Reduced Capacity in the Industry, Setting the Stage for a Market Turn? 158
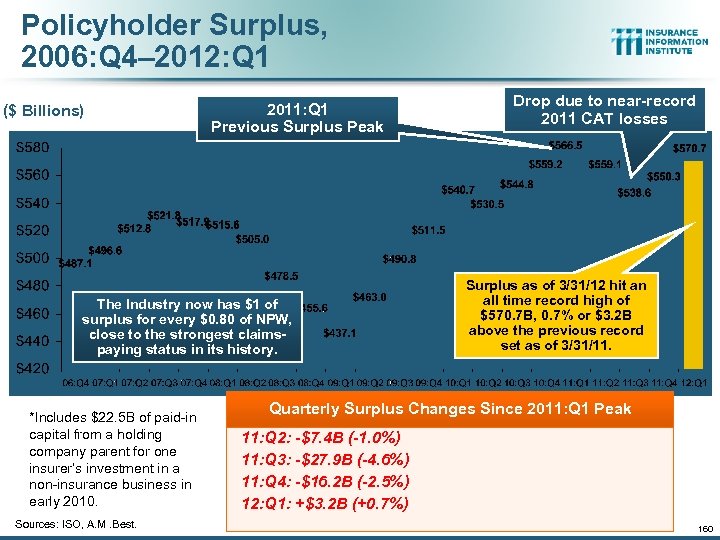 Policyholder Surplus, 2006: Q 4– 2012: Q 1 ($ Billions) 2011: Q 1 Previous Surplus Peak The Industry now has $1 of surplus for every $0. 80 of NPW, close to the strongest claimspaying status in its history. *Includes $22. 5 B of paid-in capital from a holding company parent for one insurer’s investment in a non-insurance business in early 2010. Sources: ISO, A. M. Best. Drop due to near-record 2011 CAT losses Surplus as of 3/31/12 hit an all time record high of $570. 7 B, 0. 7% or $3. 2 B above the previous record set as of 3/31/11. Quarterly Surplus Changes Since 2011: Q 1 Peak 11: Q 2: -$7. 4 B (-1. 0%) 11: Q 3: -$27. 9 B (-4. 6%) 11: Q 4: -$16. 2 B (-2. 5%) 12: Q 1: +$3. 2 B (+0. 7%) 160
 INVESTMENTS: THE NEW REALITY Investment Performance is a Key Driver of Profitability Depressed Yields Will Necessarily Influence Underwriting & Pricing 164
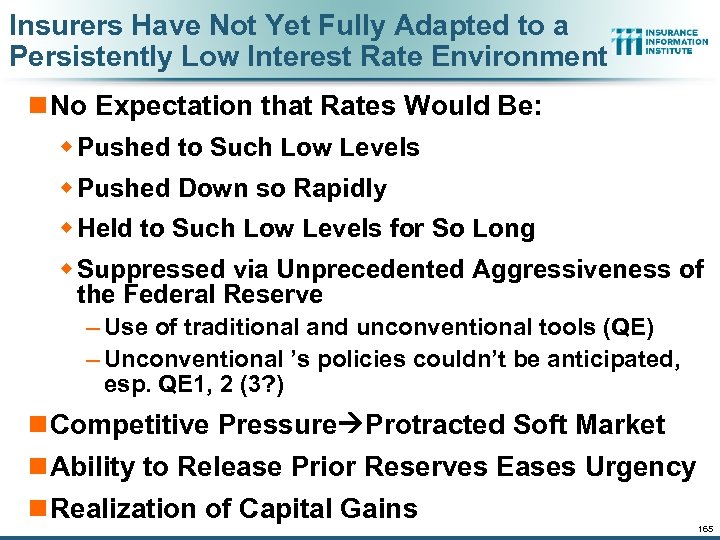 Insurers Have Not Yet Fully Adapted to a Persistently Low Interest Rate Environment n No Expectation that Rates Would Be: w Pushed to Such Low Levels w Pushed Down so Rapidly w Held to Such Low Levels for So Long w Suppressed via Unprecedented Aggressiveness of the Federal Reserve – Use of traditional and unconventional tools (QE) – Unconventional ’s policies couldn’t be anticipated, esp. QE 1, 2 (3? ) n Competitive Pressure Protracted Soft Market n Ability to Release Prior Reserves Eases Urgency n Realization of Capital Gains 165
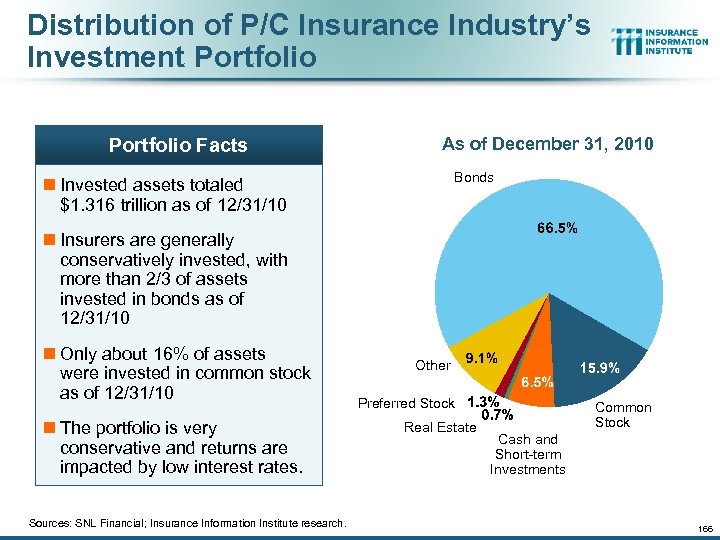 Distribution of P/C Insurance Industry’s Investment Portfolio Facts As of December 31, 2010 Bonds n Invested assets totaled $1. 316 trillion as of 12/31/10 n Insurers are generally conservatively invested, with more than 2/3 of assets invested in bonds as of 12/31/10 n Only about 16% of assets were invested in common stock as of 12/31/10 n The portfolio is very conservative and returns are impacted by low interest rates. Sources: SNL Financial; Insurance Information Institute research. Other Preferred Stock Real Estate Common Stock Cash and Short-term Investments 166
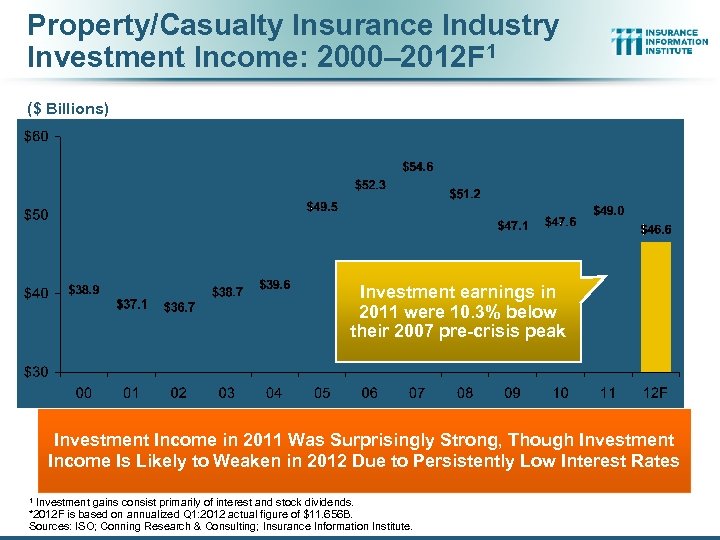 Property/Casualty Insurance Industry Investment Income: 2000– 2012 F 1 ($ Billions) Investment earnings in 2011 were 10. 3% below their 2007 pre-crisis peak Investment Income in 2011 Was Surprisingly Strong, Though Investment Income Is Likely to Weaken in 2012 Due to Persistently Low Interest Rates 1 Investment gains consist primarily of interest and stock dividends. *2012 F is based on annualized Q 1: 2012 actual figure of $11. 656 B. Sources: ISO; Conning Research & Consulting; Insurance Information Institute.
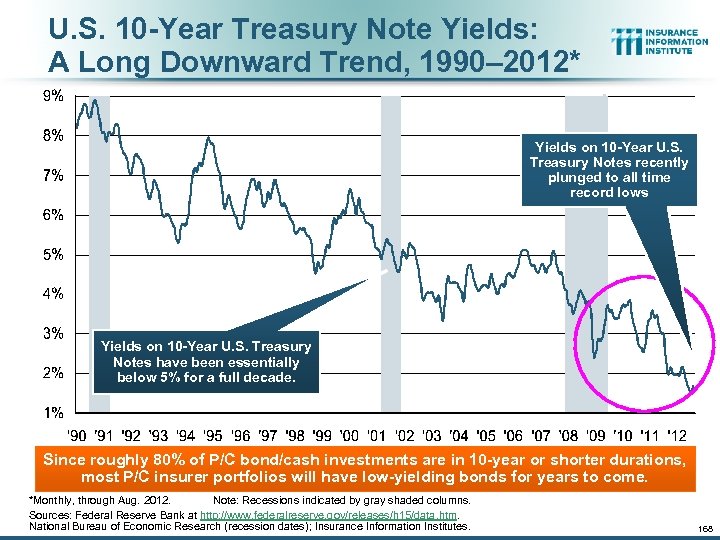 U. S. 10 -Year Treasury Note Yields: A Long Downward Trend, 1990– 2012* Yields on 10 -Year U. S. Treasury Notes recently plunged to all time record lows Yields on 10 -Year U. S. Treasury Notes have been essentially below 5% for a full decade. Since roughly 80% of P/C bond/cash investments are in 10 -year or shorter durations, most P/C insurer portfolios will have low-yielding bonds for years to come. *Monthly, through Aug. 2012. Note: Recessions indicated by gray shaded columns. Sources: Federal Reserve Bank at http: //www. federalreserve. gov/releases/h 15/data. htm. National Bureau of Economic Research (recession dates); Insurance Information Institutes. 168
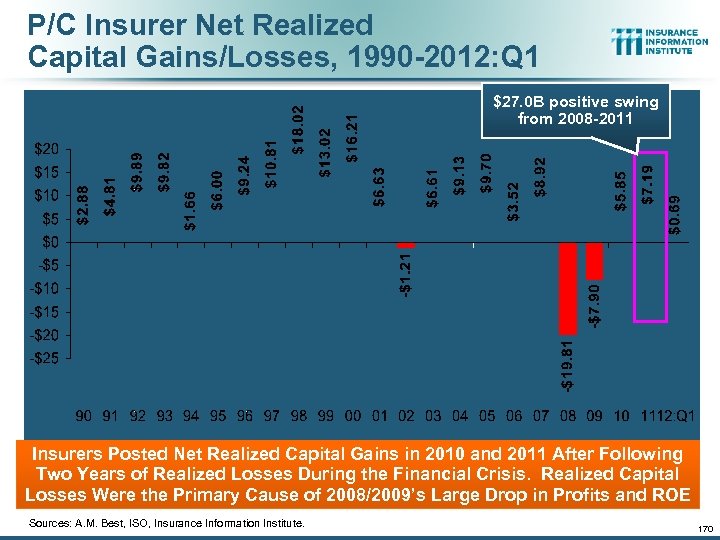 P/C Insurer Net Realized Capital Gains/Losses, 1990 -2012: Q 1 ($ Billions) $27. 0 B positive swing from 2008 -2011 Insurers Posted Net Realized Capital Gains in 2010 and 2011 After Following Two Years of Realized Losses During the Financial Crisis. Realized Capital Losses Were the Primary Cause of 2008/2009’s Large Drop in Profits and ROE Sources: A. M. Best, ISO, Insurance Information Institute. 170
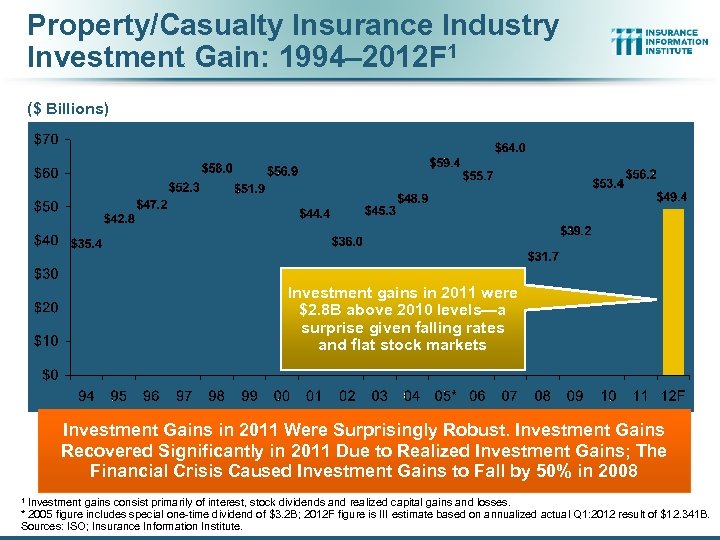 Property/Casualty Insurance Industry Investment Gain: 1994– 2012 F 1 ($ Billions) Investment gains in 2011 were $2. 8 B above 2010 levels—a surprise given falling rates and flat stock markets Investment Gains in 2011 Were Surprisingly Robust. Investment Gains Recovered Significantly in 2011 Due to Realized Investment Gains; The Financial Crisis Caused Investment Gains to Fall by 50% in 2008 1 Investment gains consist primarily of interest, stock dividends and realized capital gains and losses. * 2005 figure includes special one-time dividend of $3. 2 B; 2012 F figure is III estimate based on annualized actual Q 1: 2012 result of $12. 341 B. Sources: ISO; Insurance Information Institute.
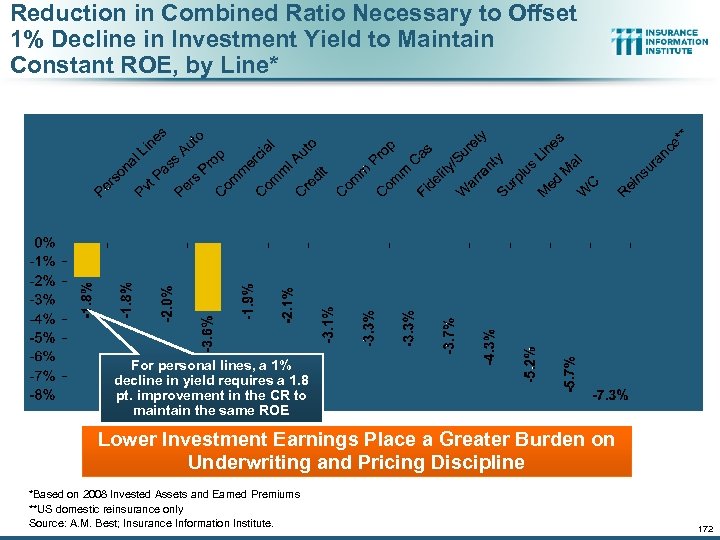 Reduction in Combined Ratio Necessary to Offset 1% Decline in Investment Yield to Maintain Constant ROE, by Line* For personal lines, a 1% decline in yield requires a 1. 8 pt. improvement in the CR to maintain the same ROE Lower Investment Earnings Place a Greater Burden on Underwriting and Pricing Discipline *Based on 2008 Invested Assets and Earned Premiums **US domestic reinsurance only Source: A. M. Best; Insurance Information Institute. 172
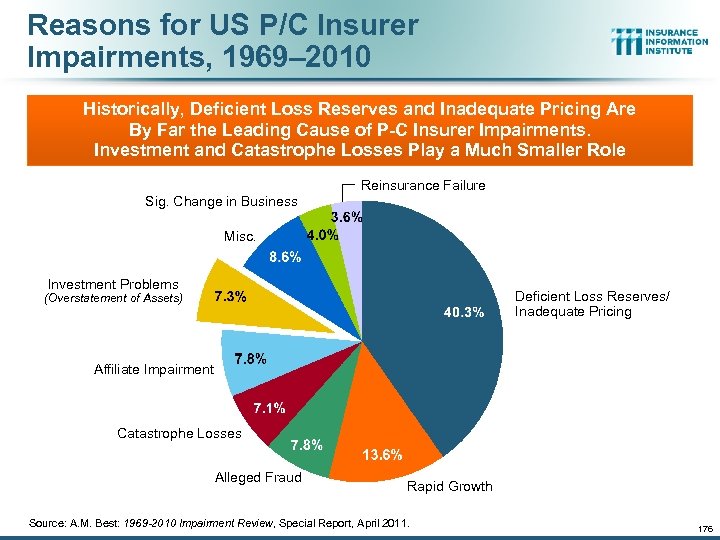 Reasons for US P/C Insurer Impairments, 1969– 2010 Historically, Deficient Loss Reserves and Inadequate Pricing Are By Far the Leading Cause of P-C Insurer Impairments. Investment and Catastrophe Losses Play a Much Smaller Role Reinsurance Failure Sig. Change in Business Misc. Investment Problems Deficient Loss Reserves/ Inadequate Pricing (Overstatement of Assets) Affiliate Impairment Catastrophe Losses Alleged Fraud Rapid Growth Source: A. M. Best: 1969 -2010 Impairment Review, Special Report, April 2011. 176
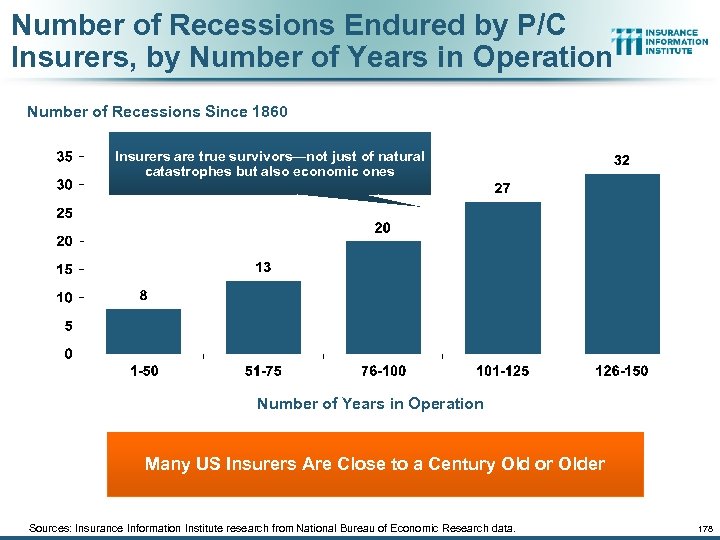 Number of Recessions Endured by P/C Insurers, by Number of Years in Operation Number of Recessions Since 1860 Insurers are true survivors—not just of natural catastrophes but also economic ones Number of Years in Operation Many US Insurers Are Close to a Century Old or Older Sources: Insurance Information Institute research from National Bureau of Economic Research data. 178
 Inflation Is it a Threat to Claim Cost Severities? 179
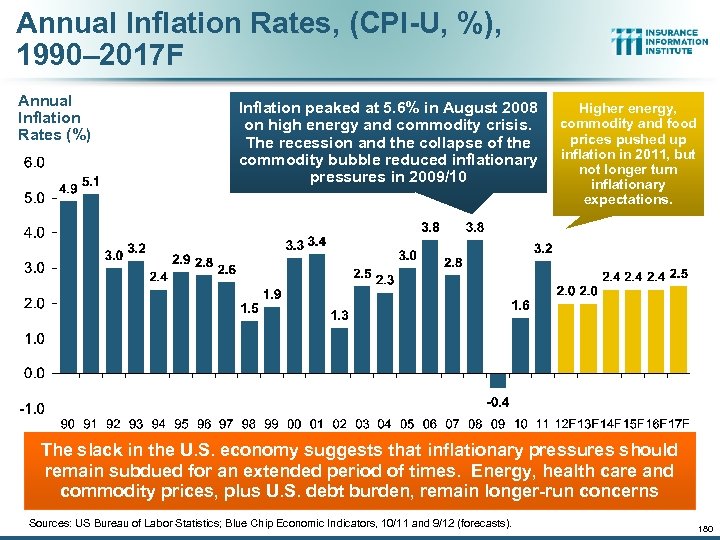 Annual Inflation Rates, (CPI-U, %), 1990– 2017 F Annual Inflation Rates (%) Inflation peaked at 5. 6% in August 2008 on high energy and commodity crisis. The recession and the collapse of the commodity bubble reduced inflationary pressures in 2009/10 Higher energy, commodity and food prices pushed up inflation in 2011, but not longer turn inflationary expectations. The slack in the U. S. economy suggests that inflationary pressures should remain subdued for an extended period of times. Energy, health care and commodity prices, plus U. S. debt burden, remain longer-run concerns Sources: US Bureau of Labor Statistics; Blue Chip Economic Indicators, 10/11 and 9/12 (forecasts). 180
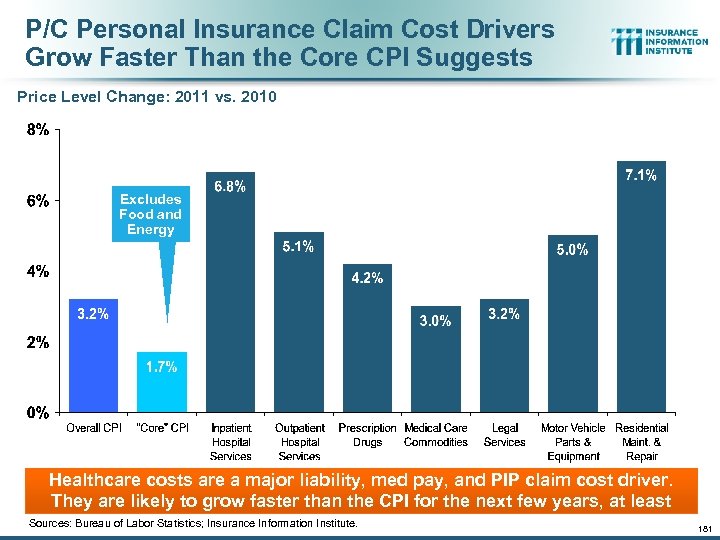 P/C Personal Insurance Claim Cost Drivers Grow Faster Than the Core CPI Suggests Price Level Change: 2011 vs. 2010 Excludes Food and Energy Healthcare costs are a major liability, med pay, and PIP claim cost driver. They are likely to grow faster than the CPI for the next few years, at least Sources: Bureau of Labor Statistics; Insurance Information Institute. 181
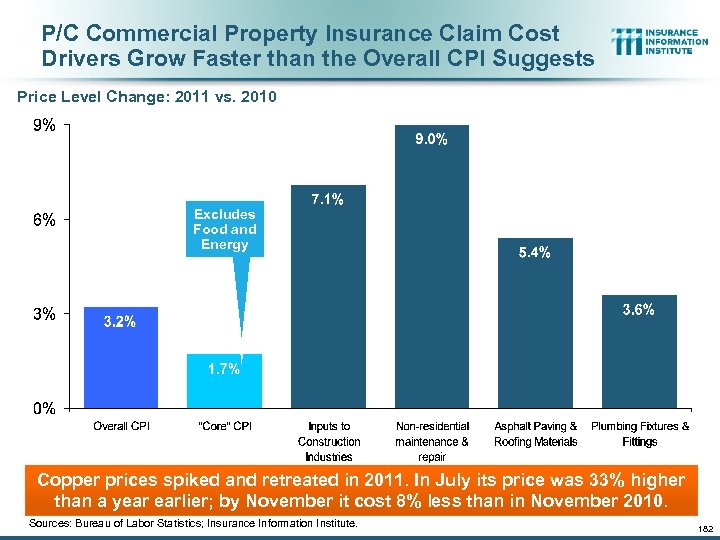 P/C Commercial Property Insurance Claim Cost Drivers Grow Faster than the Overall CPI Suggests Price Level Change: 2011 vs. 2010 Excludes Food and Energy Copper prices spiked and retreated in 2011. In July its price was 33% higher than a year earlier; by November it cost 8% less than in November 2010. Sources: Bureau of Labor Statistics; Insurance Information Institute. 182
 Regulatory Environment & Financial Services Reform State Regulatory Environments Vary Tremendously and Can Impact Insurer Profitability and Ability to Compete 184
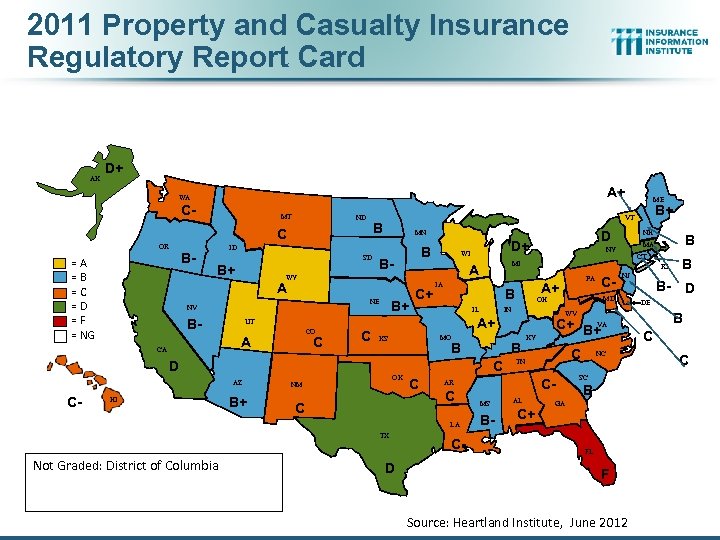 2011 Property and Casualty Insurance Regulatory Report Card AK AL D+ A+ WA C- MT ND OR B- =A =B =C =D =F = NG SD B- WY NE NV B- B+ A C C IL OK KY VA C+ B+ TN NM TX D C- C NC SC B FL F Source: Heartland Institute, June 2012 B B- D DE WV B C C- NJ MD OH IN B PA A+ B MO KS CT RI AR C CSource: James Madison Institute, February 2008. AL C GA MS B+ C C+ BLA AZ Not Graded: District of Columbia IA B MA NY MI A+ D HI C+ UT CO D+ WI A A CA C- B NH D MN ID B+ B+ VT B C ME B C C
 Insurance Information Institute Online: www. iii. org Thank you for your time and your attention! Twitter: twitter. com/bob_hartwig
