

7cbbf9cf86141edb874358e3cc15beb6.ppt
- Количество слайдов: 26
 Not-so The Marginal Value of Weather Warning Systems ^ Benjamin M. Miller University of California, San Diego
 What causes disaster deaths?
 What causes disaster deaths?
 U. S. Tornado Warning History & Infrastructure • First successful tornado warning – – • Outdoor Warning Sirens – • NOAA now has over 1, 000 transmitters which cover most of the U. S. Television/Radio – • Originated as air-raid sirens in WWII. NOAA Weather Radio/SAME Receiver – • Tinker Air Force Base, Oklahoma City, 1948 National Weather Service begins Watch/Warning system in 1953 Warnings issued through the EBS/EAS Commercial Mobile Alert System
 Research Question • Do warning systems causally reduce deaths and injuries? • How much? NOAA radio transmitters
 In the Literature • Responsiveness to warning systems is mostly case studies: Balluz et. al (2000) Liu et. al (1994) • Survey of 146 individuals following March 1, 1997 tornadoes in Arkansas Survey roughly 194 households in two Alabama areas after tornado warnings. “In the area without sirens, only 28. 9% of 194 respondents heard a tornado warning of these, 73. 2% first received the warning from radios or television. In the area with sirens, 88. 1% of 193 respondents heard a warning, and 61. 8% first received the warning from a siren. ” These are great, but the counter-factual is not clear. How would people have fared without a particular warning system?
 Identifying Variation • Transmitter broadcast area – – • Very endogenous: correlated with population density and other factors correlated with the number of fatalities and injuries. Could control for some but not all of these factors Date of transmitter installation – – – Compare tornado outcomes between counties which both eventually get transmitter coverage Compare tornado outcomes within the same county before/after transmitter installation In either case, can’t control for concurrent regional changes
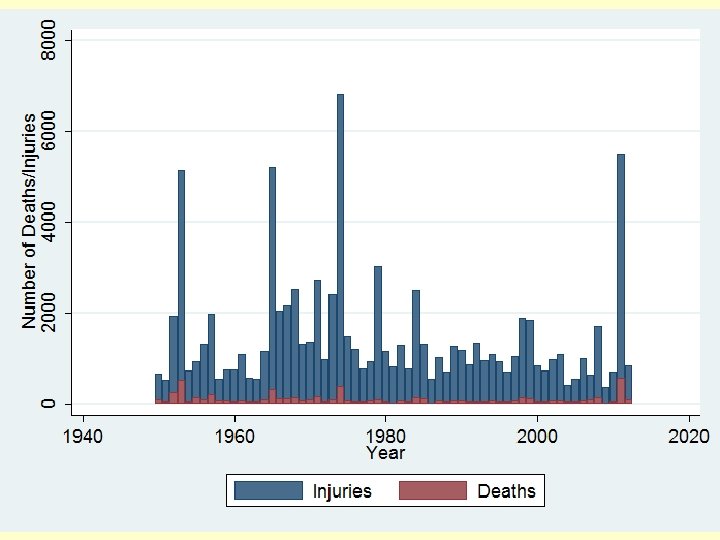
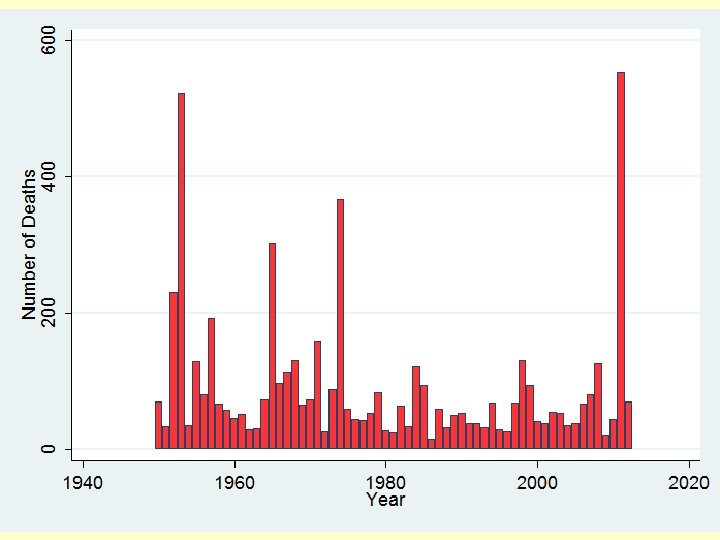
 Data • Tornado Characteristics 57, 120 recorded tornadoes from 1950 -2012 Counties passed through (Enhanced) Fujita scale Death, injuries, and sometimes damages • State-tornado level County Characteristics Which transmitters broadcast in the county, date of installation/deactivation County-level population data from Decennial Census, with annual intercensal estimates State-decade-level housing types (ex. mobile, detached house, etc. ) from the Historical Census of Housing
 Number of Tornadoes, 1950 - 2012
 Number of EF 3+ Tornadoes, 1950 - 2012
 Number of NOAA Transmitters: Jan 1, 1950
 Number of NOAA Transmitters: Jan 1, 1960
 Number of NOAA Transmitters: Jan 1, 1970
 Number of NOAA Transmitters: Jan 1, 1980
 Number of NOAA Transmitters: Jan 1, 1990
 Number of NOAA Transmitters: Jan 1, 2000
 Number of NOAA Transmitters: Jan 1, 2010
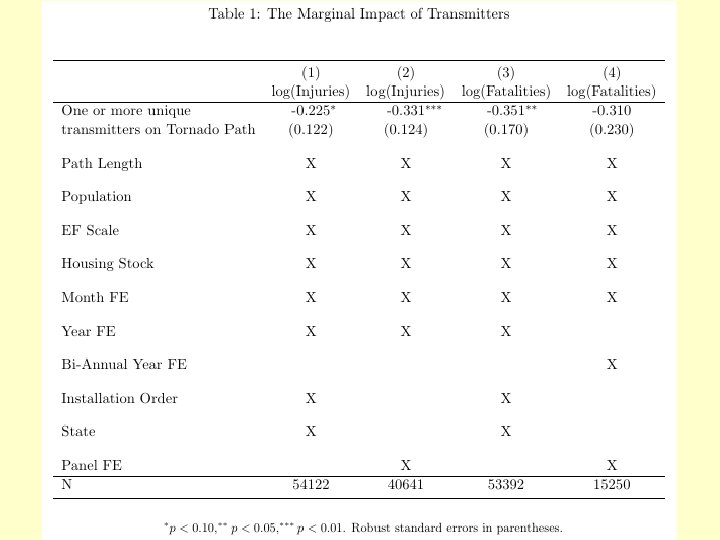
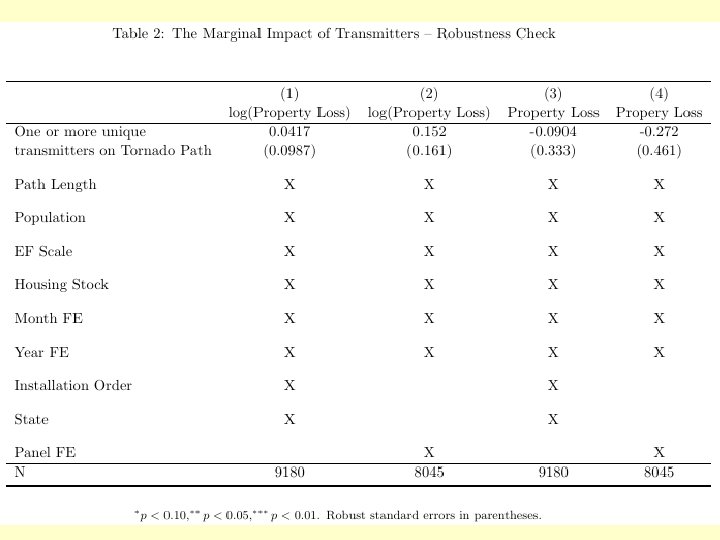
![Empirical Analysis log(Fatalities/Injuries/Property Damagei) = β[Transmitter Coverage]i + γ[Controlsi] + εi • Transmitter Coverage](https://present5.com/presentation/7cbbf9cf86141edb874358e3cc15beb6/image-20.jpg "Empirical Analysis log(Fatalities/Injuries/Property Damagei) = β[Transmitter Coverage]i + γ[Controlsi] + εi • Transmitter Coverage") Empirical Analysis log(Fatalities/Injuries/Property Damagei) = β[Transmitter Coverage]i + γ[Controlsi] + εi • Transmitter Coverage • One or more transmitters broadcasting over the tornado path β is the percent change attributed to transmitter coverage Controls • Population, Date of transmitter installation, (Enhanced) Fujita Scale, Path length, State Fixed Effects, Month & Year Fixed Effects, Distribution of home types Could add income, county size, demographics. . . County FE Count Data OLS biased, use Poisson regression
Empirical Analysis log(Fatalities/Injuries/Property Damagei) = β[Transmitter Coverage]i + γ[Controlsi] + εi • Transmitter Coverage • One or more transmitters broadcasting over the tornado path β is the percent change attributed to transmitter coverage Controls • Population, Date of transmitter installation, (Enhanced) Fujita Scale, Path length, State Fixed Effects, Month & Year Fixed Effects, Distribution of home types Could add income, county size, demographics. . . County FE Count Data OLS biased, use Poisson regression
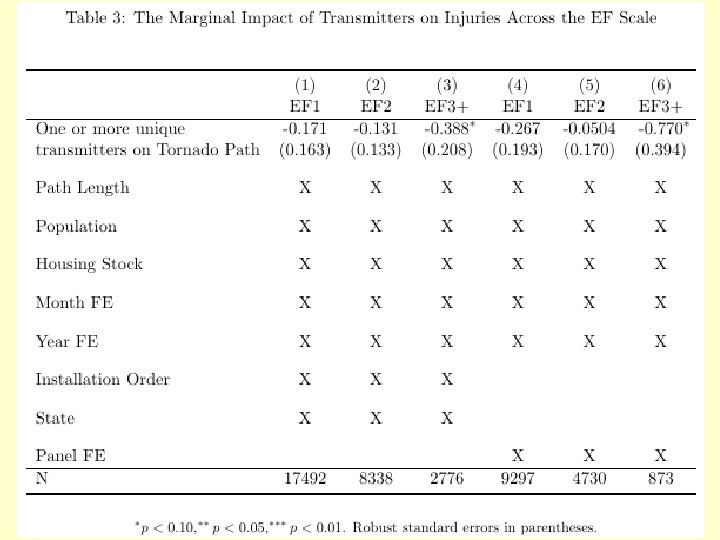
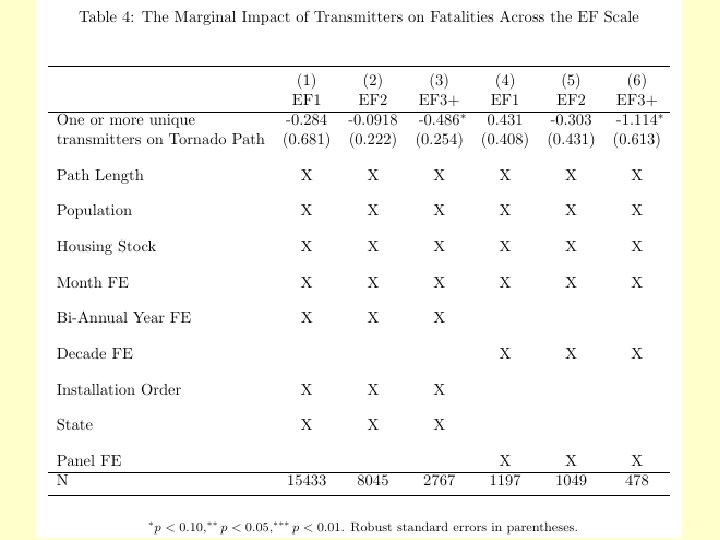
 Conclusion • • • Significant causal reduction in injuries and fatalities On average, about 30% reduction Most causal prevention of deaths/injuries comes from higher EF Scale tornadoes Other stuff: Any benefit from multiple transmitters? Benefits decline over time as replaced by new technology? Importance for choosing optimal investment within and across warning systems
 Thank you! Any and all comments/suggestions are completely welcome.