
Measuring cells Syllabus reference: •


- Размер: 5.8 Mегабайта
- Количество слайдов: 36
Описание презентации Measuring cells Syllabus reference: • по слайдам
Measuring cells
Syllabus reference:
• This symbol in the corner of a slide indicates a picture, diagram or table taken from your text book
To accurately measure the size of cellular structures we need a suitable scale:
Ideally, we need a scale we can see directly alongside the cells we are observing:
Start by putting a ruler under the microscope:
Appearance of ruler at medium magnification
Appearance of tissue at medium magnification
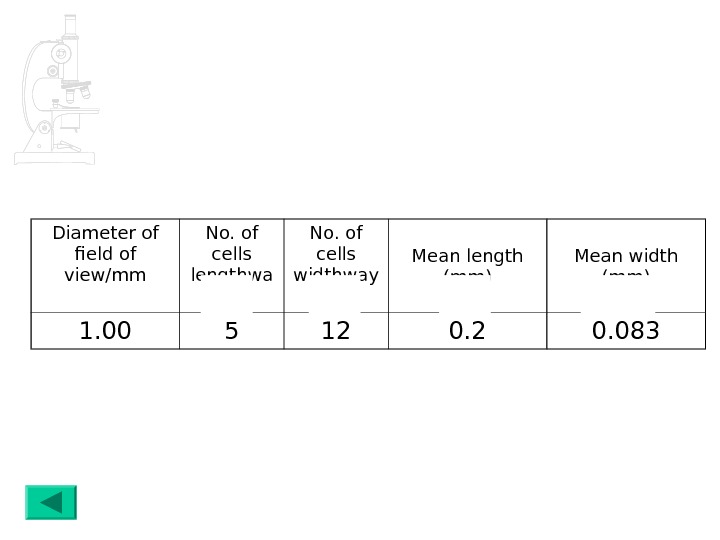
Estimating cell size at medium magnification 1 mm 5 1 ÷ 5 = 0. 2 mm 12 1 ÷ 12 = 0. 083 mm
Diameter of field of view/mm No. of cells lengthwa ys No. of cells widthway s Mean length (mm) Mean width (mm) 1. 00 5 12 0.
Diameter of field of view/mm No. of cells lengthwa ys No. of cells widthway s Mean length (mm) Mean width (mm) 1. 00 5 12 0. 083 Mean length of cells = 0. 2 x 1000 = 200 µ m 1 mm = 1000 µm Mean width of cells = 0. 083 x 1000 = 83 µ m
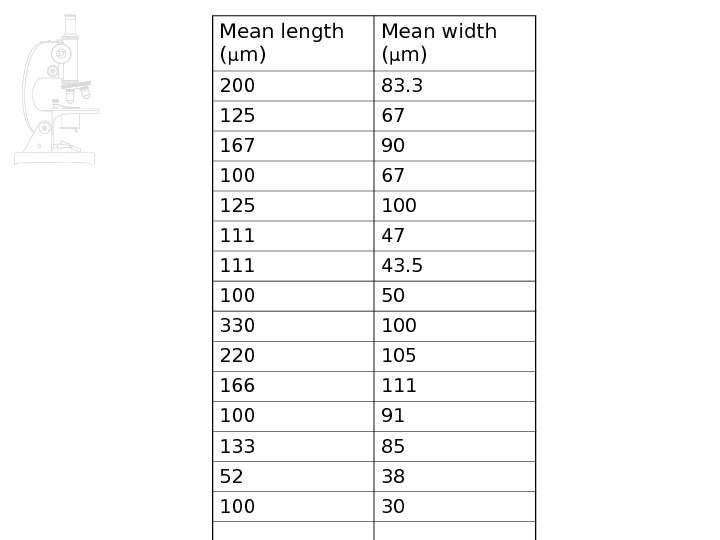
Mean length ( µ m) Mean width ( µ m) 200 83. 3 125 67 167 90 100 67 125 100 111 47 111 43.
Mean length ( µ m) Mean width ( µ m)
The graticule a more suitable ‘ruler’ for measuring cells • The slide graticule: • The eyepiece graticule:
The stage graticule shows true lengths stage graticule
The eyepiece graticule has regular divisions. These need to be calibrated for each magnification stage graticuleeyepiece graticule e. g. x
stage graticuleeyepiece graticule e. g. x 400 The eyepiece graticule has regular divisions. These need to be calibrated for each magnification
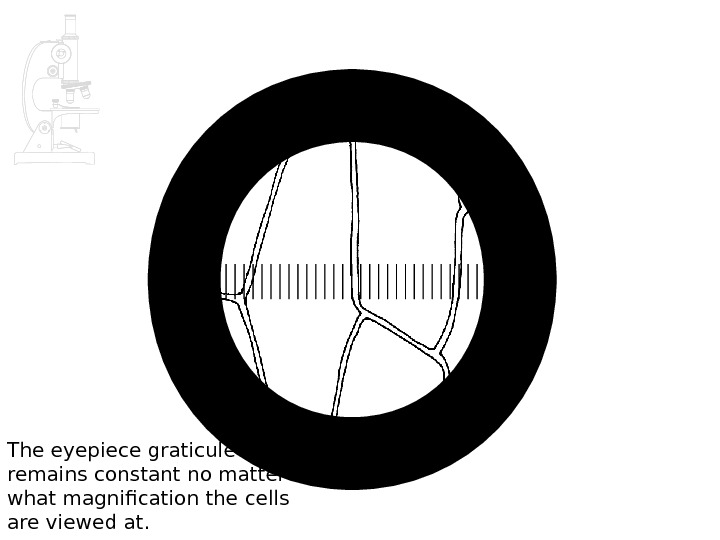
The eyepiece graticule remains constant no matter what magnification the cells are viewed at.
The eyepiece graticule remains constant no matter what magnification the cells are viewed at.
The eyepiece graticule remains constant no matter what magnification the cells are viewed at.
Eyepiece & stage graticules Low magnification High magnification
Figure 4. 3 Stage micrometer viewed at x 100 magnification. The total length of the micrometer is 1 mm total length = 1 mm which is 1000 μ m on this scale, 94 divisions = 1000 μ m Therefore, 1 division on the eyepiece graticule represents 1000 ÷ 94 = 10. 6 μ m at this magnification.
Figure 4. 1 Cells of onion epidermis as viewed at x 100 magnification with a graticule in the eyepiece of the microscope We know that at this magnification, 1 division on the eyepiece graticule represents 10. 6 μ m Therefore the total length of the eyepiece graticule represents 10. 6 x 100 = 1060 μ m at this magnification. In the two columns covered by the graticule there is an average of five cells in the length of the graticule Therefore the average length of one cell is 1060 ÷ 5 = 212 μ m 1060 μ m
remember that each division here is 10 μ m. Figure 4. 4 Part of the stage micrometer viewed at x 400 magnification so the length shown by the bracket is 240 μ m on this scale, 90 divisions = 240 μ m Therefore, 1 division on the eyepiece graticule represents 240 ÷ 90 = 2. 67 μ m at this magnification.
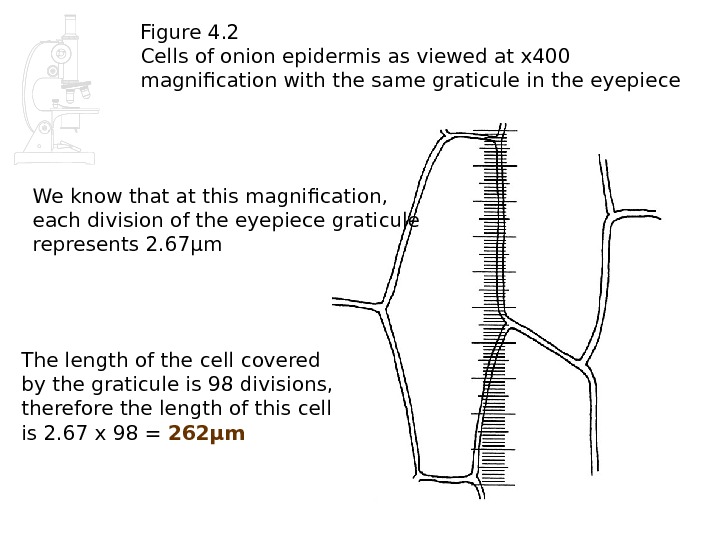
Figure 4. 2 Cells of onion epidermis as viewed at x 400 magnification with the same graticule in the eyepiece The length of the cell covered by the graticule is 98 divisions, therefore the length of this cell is 2. 67 x 98 = 262 μ m. We know that at this magnification, each division of the eyepiece graticule represents 2. 67 μ m
We now have two measurements for the length of an onion cell; 212 μ m and 262 μ m. Which of these is the more accurate estimate of the length of onion epidermal cells? • The answer from Q. 2 [212 μμ m]m] • because this is a mean of several cells. • Only one cell was measured in Q. 3, and this one may not be representative.
Estimating cell width. Figure 4. 5. Cells of the onion epidermis as viewed at x 100 magnification with a graticule in the eyepiece of the microscope Remember the total length of the eyepiece graticule represents 1060 μ m at this magnification There approximately thirteen cells in the length of the graticule Therefore the average width of one cell is 1060 ÷ 13 = 81. 5 μ m
Figure 4. 6. Cells of the onion epidermis as viewed at x 400 magnification with the same graticule in the eyepiece of the microscope Remember, we know that at this magnification, each division of the eyepiece graticule represents 2. 67 μ m Here, two cells span 62 divisions on the eyepiece graticule. This represents 2. 67 x 62 = 165. 5 μ m 62 divisions Therefore the average width of one cell is 165. 5 ÷ 2 = 82. 8 μ m
Comparison of estimates from Ws 1 with those from Ws 3 • The answers on Ws 1 are means of several samples • Whilst the answers on Ws 3 are based on a single sample • The variety of onion used may be different • The samples may have come from onions at different stages of growth
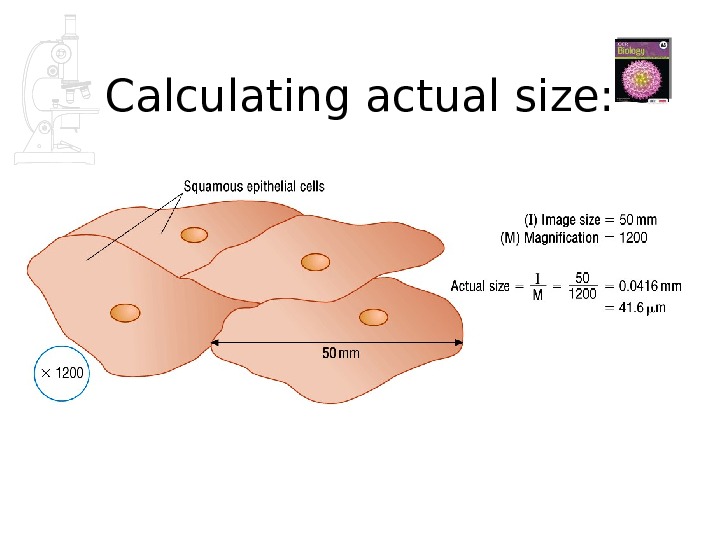
Calculating actual size:
Calculating magnification & actual size :
Calculating actual size :
Calculating magnification :
Calculating magnification & actual size :
Calculating actual size: