
Market Analysis, Highest and Best Use and Vacant


- Размер: 2.1 Mегабайта
- Количество слайдов: 40
Описание презентации Market Analysis, Highest and Best Use and Vacant по слайдам
Market Analysis, Highest and Best Use and Vacant Land The Case Study of a 66 Acre Vacant Parcel of Land Wayne Foss, DBA, MAI, CRE, FRICS Foss Consulting Group Email: wfoss@fossconsult. com
2 The Subject Property • Size: 66 Acres • Shape: Rectangular, almost square • Location: 0. 75 miles west of a major north-south freeway that is lined with new multistory office and retail buildings, and 0. 25 miles south of a proposed northbelt loop freeway. • Zoning: Office and Retail uses
3 The Purpose of the Assignment • The Highest and Best Use of the Site – Facts to Consider • Doubtful that most probable use is as zoned – Many nearby office and retail buildings standing vacant • Only comparable sales were to users • Subject is probably a long-term investment • Truly comparable land sales may be difficult to identify because the subject’s actual use is questionable • Must test financial feasibility. Subject’s potential use must be tested
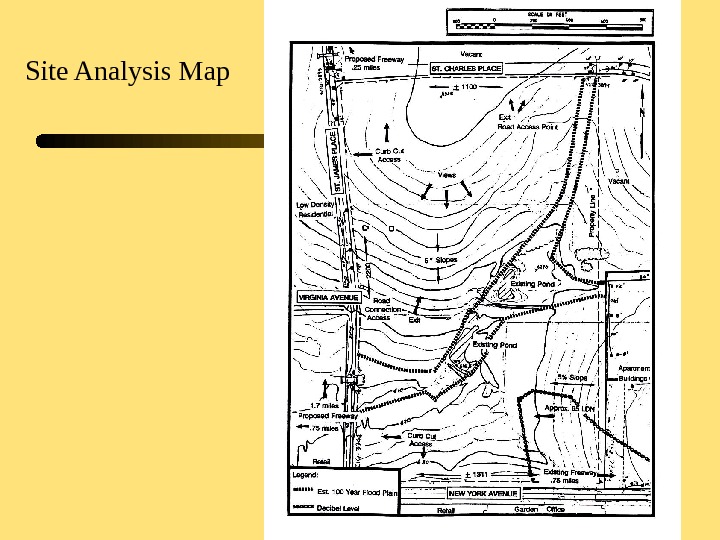
4 Site Analysis Map
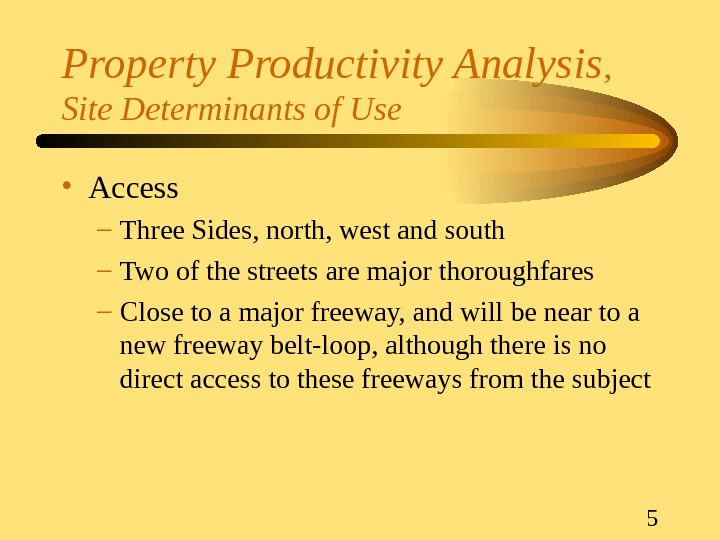
5 Property Productivity Analysis , Site Determinants of Use • Access – Three Sides, north, west and south – Two of the streets are major thoroughfares – Close to a major freeway, and will be near to a new freeway belt-loop, although there is no direct access to these freeways from the subject
6 Property Productivity Analysis , Site Determinants of Use • Physical Characteristics – 66 Acres, gentle slope from northeast to southwest – Drainage is a consideration: creek on the property – Noise Pollution: a 65 -decibel reading was taken on the southeasterly portion of the site. Source is a nearby airport.
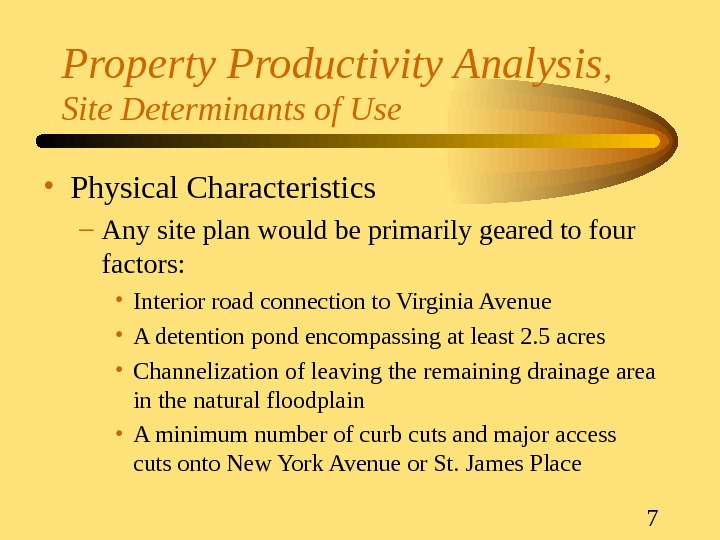
7 Property Productivity Analysis , Site Determinants of Use • Physical Characteristics – Any site plan would be primarily geared to four factors: • Interior road connection to Virginia Avenue • A detention pond encompassing at least 2. 5 acres • Channelization of leaving the remaining drainage area in the natural floodplain • A minimum number of curb cuts and major access cuts onto New York Avenue or St. James Place
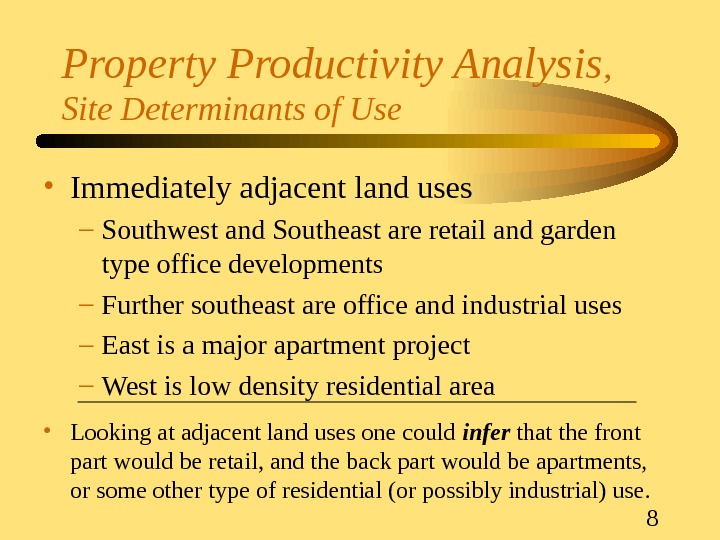
8 Property Productivity Analysis , Site Determinants of Use • Immediately adjacent land uses – Southwest and Southeast are retail and garden type office developments – Further southeast are office and industrial uses – East is a major apartment project – West is low density residential area • Looking at adjacent land uses one could infer that the front part would be retail, and the back part would be apartments, or some other type of residential (or possibly industrial) use.
9 Property Productivity Analysis , Site Determinants of Use • Zoning and Legal Constraints – Front Part: • Approximately 16 acres is general retail use – Rear Part: • Multi-story offices – City Planning did not reveal any obstacle to rezoning the land to apartment use or to light industrial use. – Zoning does not appear to present any major constraints on the land use possibilities.
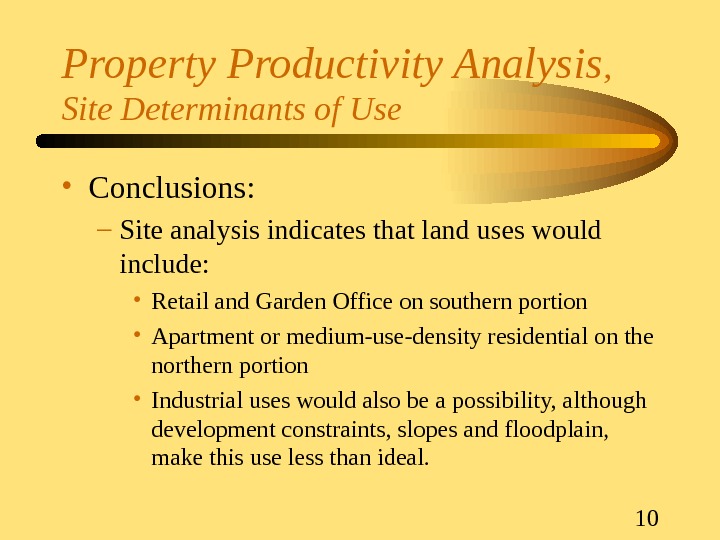
10 Property Productivity Analysis , Site Determinants of Use • Conclusions: – Site analysis indicates that land uses would include: • Retail and Garden Office on southern portion • Apartment or medium-use-density residential on the northern portion • Industrial uses would also be a possibility, although development constraints, slopes and floodplain, make this use less than ideal.
11 Property Productivity Analysis , Location Determinants of Use • City, Regional and Neighborhood Growth – Focus in terms of how it supports a mixed use development – Where will growth most likely occur, and how much? – Linkages and Land use associations – Economic concept; questions to be considered • Close to what? Far from what? • Access to/from what? • Competing with what? And where? • Influences by what?
12 Property Productivity Analysis , Location Determinants of Use • Area Accessibility (Linkages) – Streets: • New York Avenue & St. James Place – Major north-south and east-west arterial highways • 0. 75 miles from major north-south regional freeway – Air transportation • Good access to air transportation (southeast) • 12 miles from major metro-area airport – Traffic Counts • currently 20, 000 ADT, with forecast of 40, 000 ADT in 10 to 15 yrs
13 Property Productivity Analysis , Location Determinants of Use • Area Accessibility (Linkages) – Future • Proposed east-west beltway (north) – Neighborhood characteristics • on periphery of a prestigious north metro office district • high income housing found within 5 miles • moderate income housing adjacent to subject • considered slightly inferior to areas east of the north-south freeway – Conclusions • access to the subject is very good • traffic congestion in area might be considered somewhat negative for residential uses in the near term. Highway improvements nearby may negate this problem.
14 Land Use Linkages Map
15 Property Productivity Analysis , Urban Growth Structure • Existing Growth Pattern – analyze overall growth pattern in the area • Intensity of Use (floor area ratio) – number of square feet of building area per unit of land area – High intensity uses along the north-south freeway, and at major intersections with neighborhood collector streets – Lower intensity uses farther from the freeway and bordering the high intensity uses – Conclusion • marginal transitional location between – more intense uses toward the north-south freeway – less intense uses to the west.
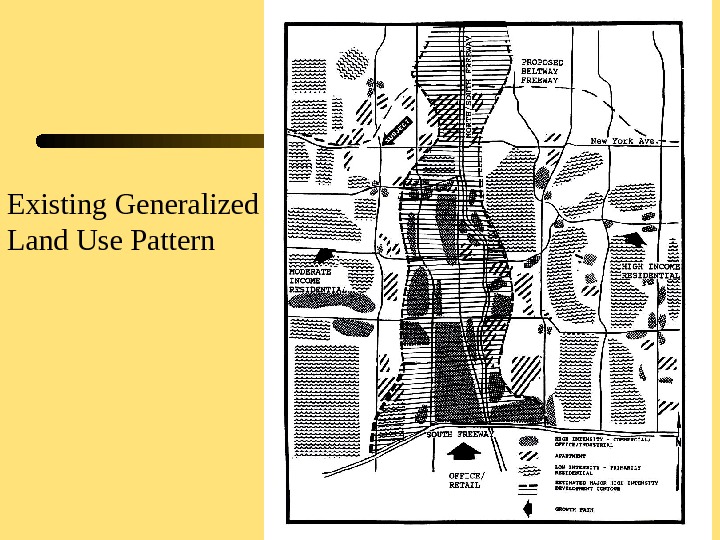
16 Existing Generalized Land Use Pattern
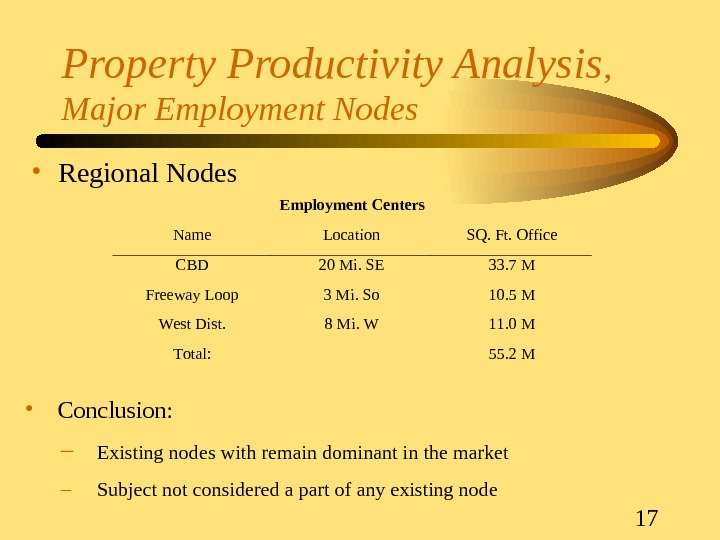
17 Property Productivity Analysis , Major Employment Nodes • Regional Nodes. Employment Centers Name. Location. SQ. Ft. Office CBD 20 Mi. SE 33. 7 M Freeway Loop 3 Mi. So 10. 5 M West Dist. 8 Mi. W 11. 0 M Total: 55. 2 M • Conclusion: – Existing nodes with remain dominant in the market – Subject not considered a part of any existing node
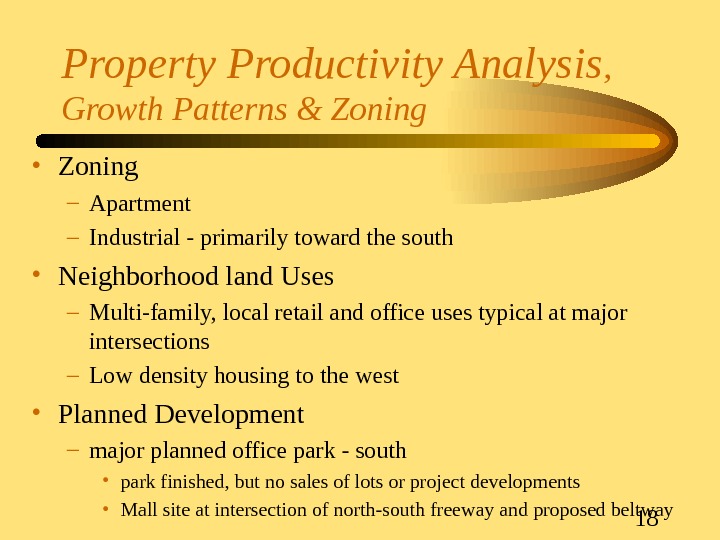
18 Property Productivity Analysis , Growth Patterns & Zoning • Zoning – Apartment – Industrial — primarily toward the south • Neighborhood land Uses – Multi-family, local retail and office uses typical at major intersections – Low density housing to the west • Planned Development – major planned office park — south • park finished, but no sales of lots or project developments • Mall site at intersection of north-south freeway and proposed beltway
19 Property Productivity Analysis , Summary Subject Use Location Analysis Score Office — Multi-Story 5 Multi-family Residential 13 Office — Garden 14 Single Family Residential 6 Retail — Regional 6 Industrial 10 Retail — Community 13 Summary of Land Use Matrix
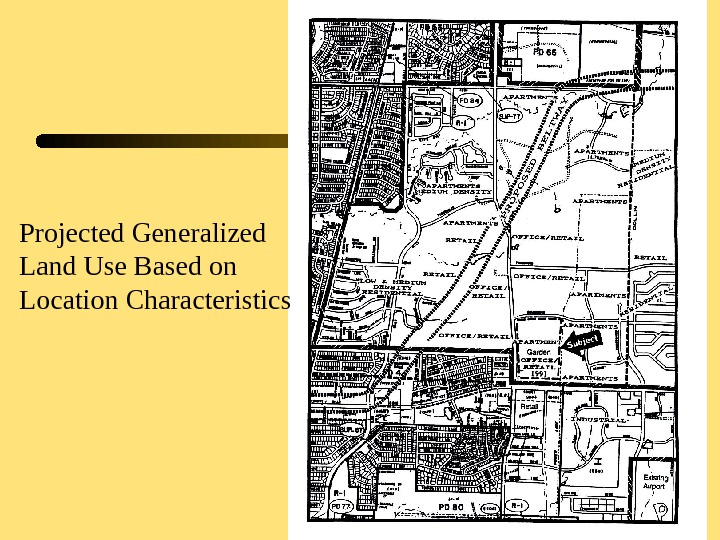
20 Projected Generalized Land Use Based on Location Characteristics
21 Market Determinants of Use , Demand Supply — Retail • Fundamental Analysis: Estimated Average Household Income (current) $ 38, 750 Less taxes & non-retail expenditures @ 57% $ 22, 080 Household effective retail buying power $ 16, 670 Estimated households in four years x 32, 945 Estimated total effective retail buying power (rd) $ 549, 000 Divided by dollars per SF of sales $200 Estimated total supportable retail space in four years 2, 745, 000 sf – Economic Development Dept Estimate: 3, 155, 000 sf – Conclusion: 3, 000 sf
22 Market Determinants of Use , Demand Supply — Retail • Current Supply – Planning Dept. estimate: 2, 746, 230 sf – Real Estate Data Co. estimate: 2, 306, 150 sf – Acme Research study: 2, 584, 000 sf – Conclusion: 2, 500, 000 sf • Future supply (planned within 4 years): 1, 337, 239 sf – Expected to be developed (67%) 890, 966 sf
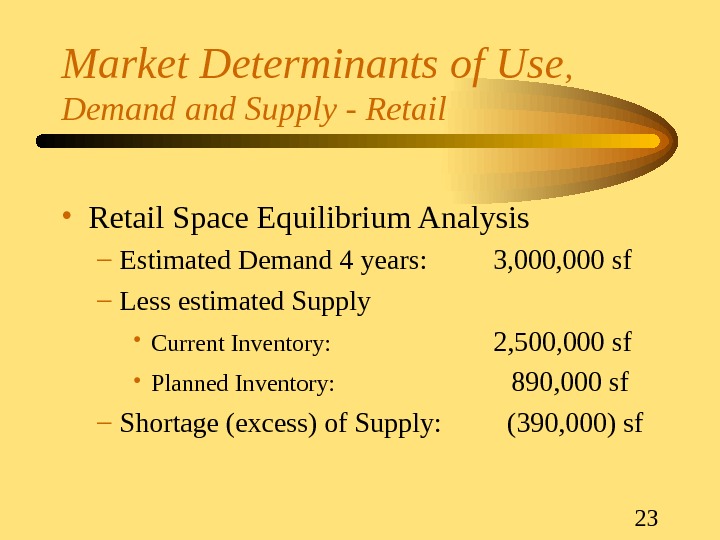
23 Market Determinants of Use , Demand Supply — Retail • Retail Space Equilibrium Analysis – Estimated Demand 4 years: 3, 000 sf – Less estimated Supply • Current Inventory: 2, 500, 000 sf • Planned Inventory: 890, 000 sf – Shortage (excess) of Supply: (390, 000) sf
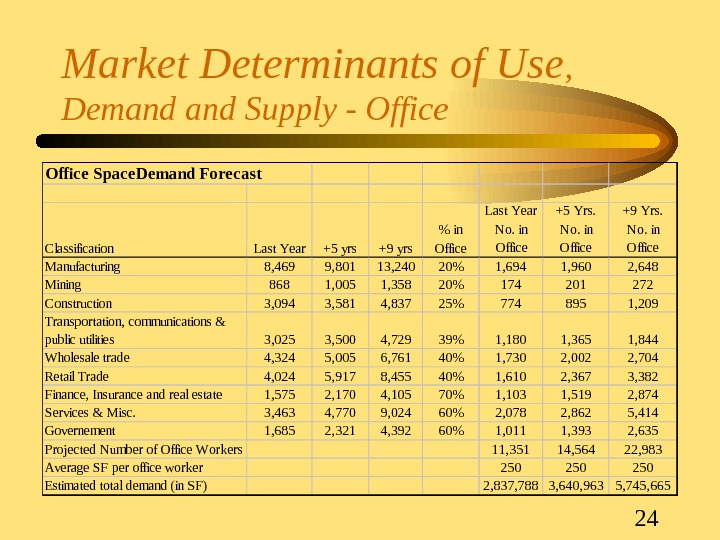
24 Market Determinants of Use , Demand Supply — Office Space. Demand Forecast Classification Last Year +5 yrs +9 yrs % in Office Last Year No. in Office +5 Yrs. No. in Office +9 Yrs. No. in Office Manufacturing 8, 469 9, 801 13, 240 20% 1, 694 1, 960 2, 648 Mining 868 1, 005 1, 358 20% 174 201 272 Construction 3, 094 3, 581 4, 837 25% 774 895 1, 209 Transportation, communications & public utilities 3, 025 3, 500 4, 729 39% 1, 180 1, 365 1, 844 Wholesale trade 4, 324 5, 005 6, 761 40% 1, 730 2, 002 2, 704 Retail Trade 4, 024 5, 917 8, 455 40% 1, 610 2, 367 3, 382 Finance, Insurance and real estate 1, 575 2, 170 4, 105 70% 1, 103 1, 519 2, 874 Services & Misc. 3, 463 4, 770 9, 024 60% 2, 078 2, 862 5, 414 Governement 1, 685 2, 321 4, 392 60% 1, 011 1, 393 2, 635 Projected Number of Office Workers 11, 351 14, 564 22, 983 Average SF per office worker 250 250 Estimated total demand (in SF) 2, 837, 788 3, 640, 963 5, 745,
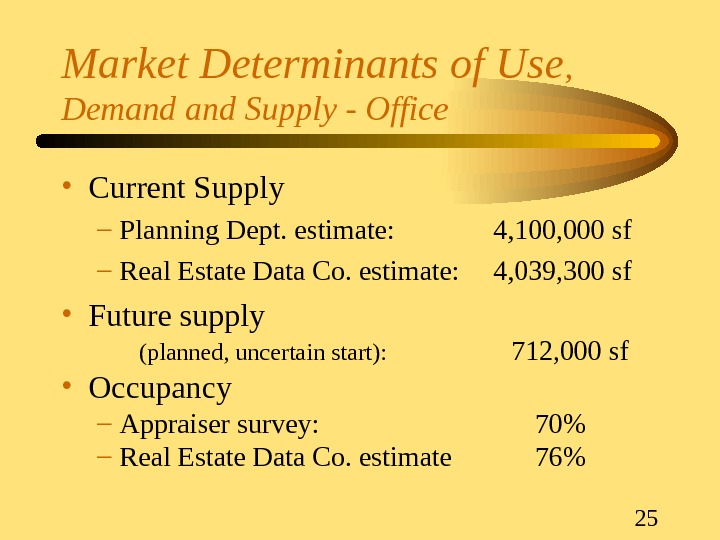
25 Market Determinants of Use , Demand Supply — Office • Current Supply – Planning Dept. estimate: 4, 100, 000 sf – Real Estate Data Co. estimate: 4, 039, 300 sf • Future supply (planned, uncertain start): 712, 000 sf • Occupancy – Appraiser survey: 70% – Real Estate Data Co. estimate 76%
26 Market Determinants of Use , Demand Supply — Office • Office Space Equilibrium Analysis – Current Demand: 2, 987, 105 sf (Including 5% frictional vacancy) – Less estimated Supply: 4, 100, 000 sf – Shortage (excess) of Supply: (1, 112, 895) sf – Demand in 5 Years: 3, 640, 500 sf – Total Current Demand: 2, 837, 750 sf – Five year demand increment 802, 750 sf – Yearly demand increment 160, 550 sf
27 Market Determinants of Use , Demand Supply — Office • Office Space Equilibrium Analysis – Current Supply: 4, 100, 000 sf – Less current demand: 2, 987, 105 sf – Current Oversupply: (1, 112, 895) sf – Divided by annual growth in demand: 1, 112, 895 sf 160, 550 sf = Approximate 7 year supply
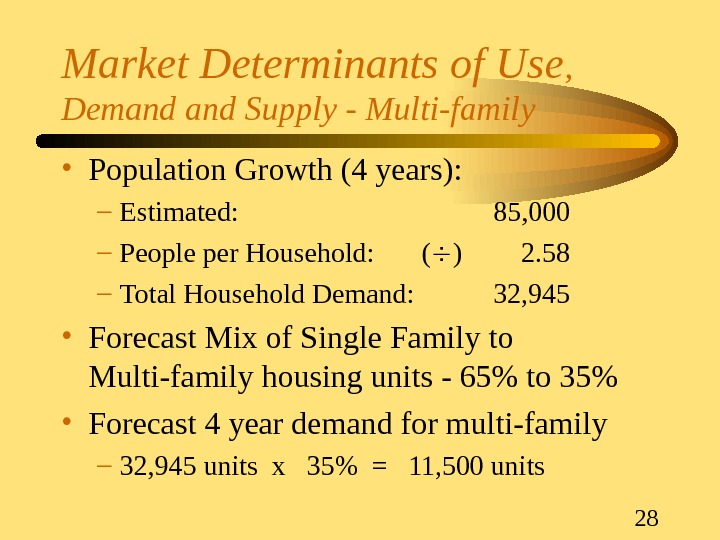
28 Market Determinants of Use , Demand Supply — Multi-family • Population Growth (4 years): – Estimated: 85, 000 – People per Household: ( ) 2. 58 – Total Household Demand: 32, 945 • Forecast Mix of Single Family to Multi-family housing units — 65% to 35% • Forecast 4 year demand for multi-family – 32, 945 units x 35% = 11, 500 units
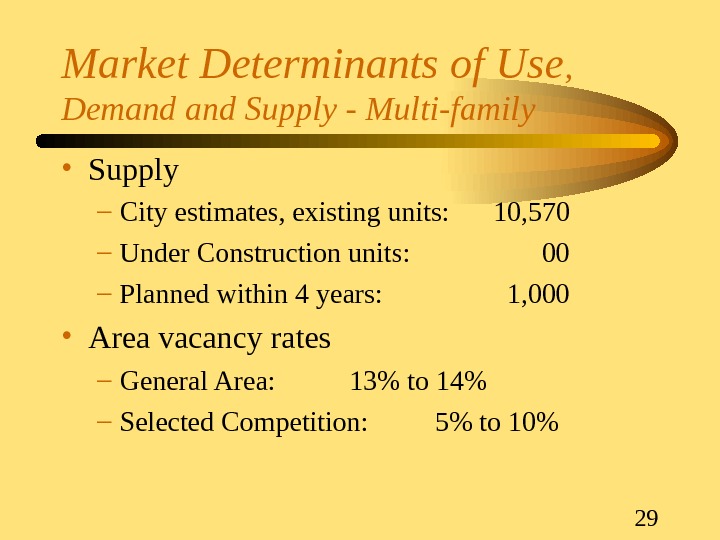
29 Market Determinants of Use , Demand Supply — Multi-family • Supply – City estimates, existing units: 10, 570 – Under Construction units: 00 – Planned within 4 years: 1, 000 • Area vacancy rates – General Area: 13% to 14% – Selected Competition: 5% to 10%
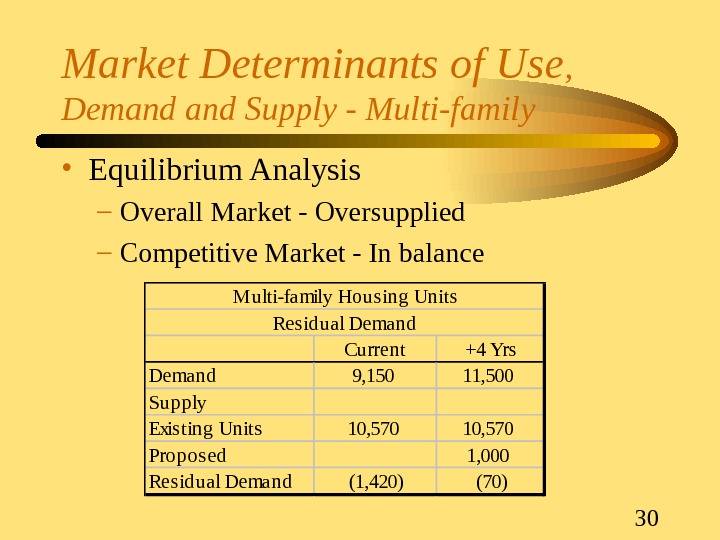
30 Market Determinants of Use , Demand Supply — Multi-family • Equilibrium Analysis – Overall Market — Oversupplied – Competitive Market — In balance. Current+4 Yrs Demand 9, 15011, 500 Supply Exis ting Units 10, 570 Propos ed 1, 000 Res idual Demand(1, 420)(70) Multi-family Hous ing Units Res idual Demand
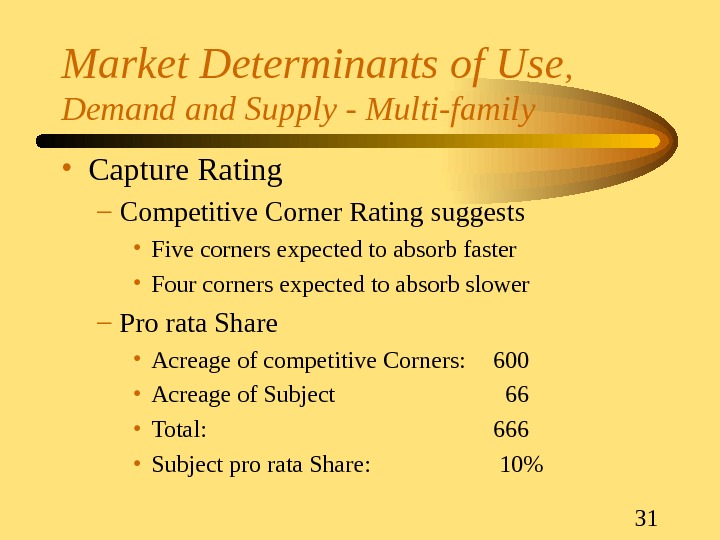
31 Market Determinants of Use , Demand Supply — Multi-family • Capture Rating – Competitive Corner Rating suggests • Five corners expected to absorb faster • Four corners expected to absorb slower – Pro rata Share • Acreage of competitive Corners: 600 • Acreage of Subject 66 • Total: 666 • Subject pro rata Share: 10%
32 Financial Analysis of Land Use Mix • Procedure: To each type of land use – Assign relative user values – Assign absorption estimates • Judgement and Experience must be applied • Address Uncertainty and Risk – adjusting the discount rate – uncertain land uses can be revised along more conservative lines – reconcile different risks and values
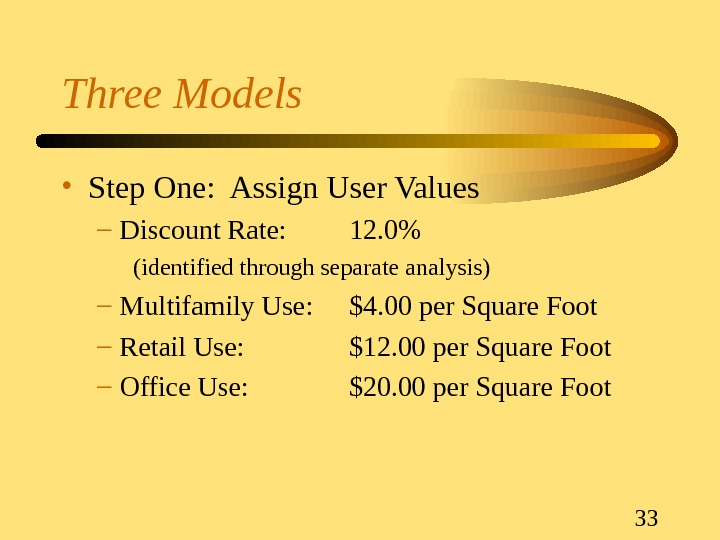
33 Three Models • Step One: Assign User Values – Discount Rate: 12. 0% (identified through separate analysis) – Multifamily Use: $4. 00 per Square Foot – Retail Use: $12. 00 per Square Foot – Office Use: $20. 00 per Square Foot
34 Three Models • Step Two: Consider Development Cost make adjustments if cost is significant • Step Three: Forecast site sales – or, average absorption over time – starts when demand exceeds supply
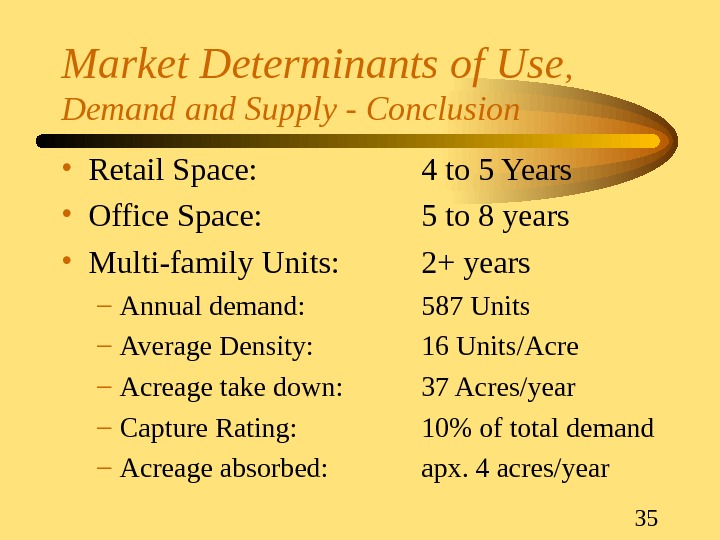
35 Market Determinants of Use , Demand Supply — Conclusion • Retail Space: 4 to 5 Years • Office Space: 5 to 8 years • Multi-family Units: 2+ years – Annual demand: 587 Units – Average Density: 16 Units/Acre – Acreage take down: 37 Acres/year – Capture Rating: 10% of total demand – Acreage absorbed: apx. 4 acres/year
36 Three Suggested Models
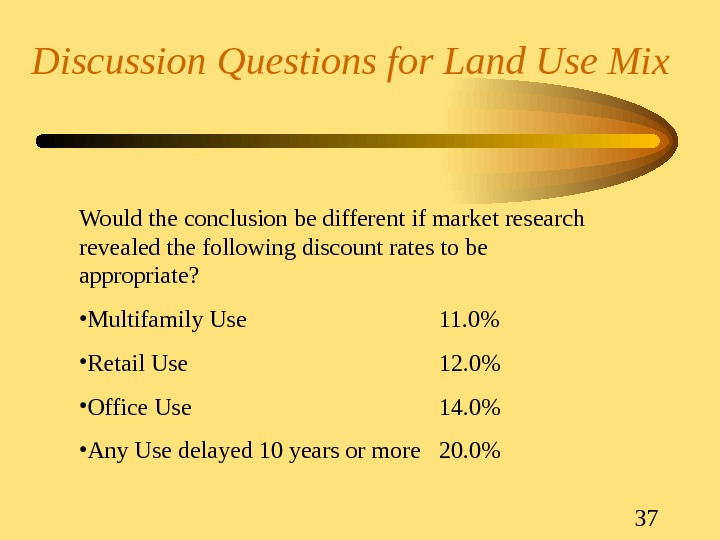
37 Discussion Questions for Land Use Mix Would the conclusion be different if market research revealed the following discount rates to be appropriate? • Multifamily Use 11. 0% • Retail Use 12. 0% • Office Use 14. 0% • Any Use delayed 10 years or more 20. 0%
39 Highest and Best Use Concept Plan
40 So That’s — — — A Case Study: Vacant Land Wayne Foss, DBA, MAI, CRE, FRICS Fullerton, CA USA Email: waynefoss@usa. net