
Magnetic Resonance Assessment and Therapy Monitoring of Cardiac


circulation_2008_apr_117_13_1745-9_figures.ppt
- Размер: 2.5 Mегабайта
- Количество слайдов: 10
Описание презентации Magnetic Resonance Assessment and Therapy Monitoring of Cardiac по слайдам
Magnetic Resonance Assessment and Therapy Monitoring of Cardiac Involvement in Churg-Strauss Syndrome by Hannibal Baccouche, Ali Yilmaz, Dominik Alscher, Karin Klingel, Jose Fernando Val-Bernal, and Heiko Mahrholdt Circulation Volume 117(13): 1745 -1749 April 1, 2008 Copyright © American Heart Association
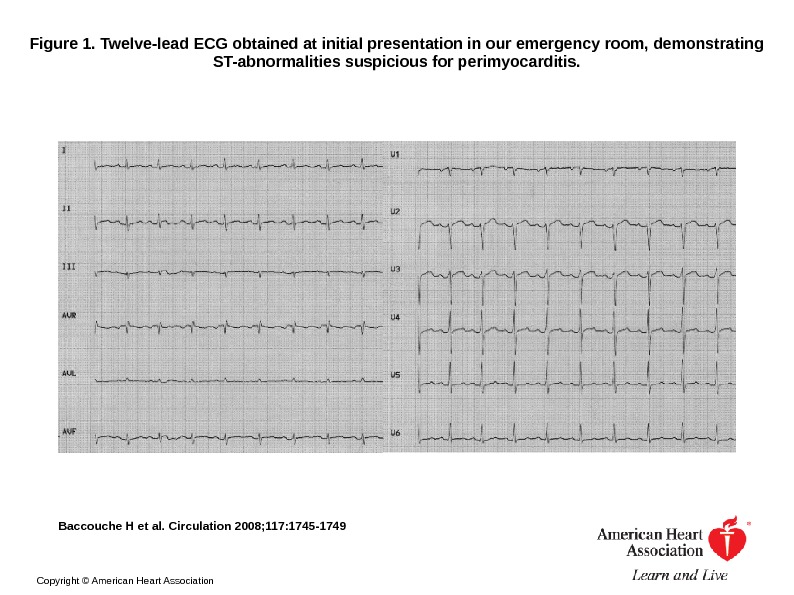
Figure 1. Twelve-lead ECG obtained at initial presentation in our emergency room, demonstrating ST-abnormalities suspicious for perimyocarditis. Baccouche H et al. Circulation 2008; 117: 1745 -1749 Copyright © American Heart Association
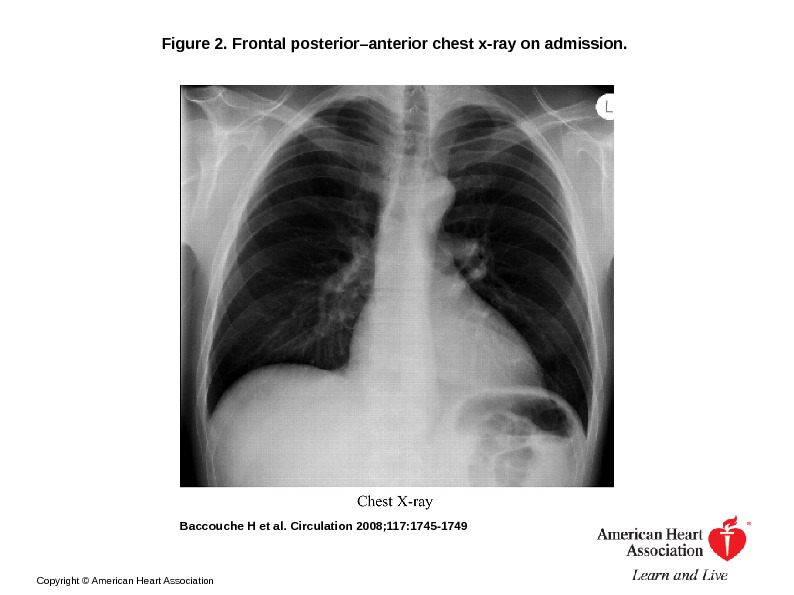
Figure 2. Frontal posterior–anterior chest x-ray on admission. Baccouche H et al. Circulation 2008; 117: 1745 -1749 Copyright © American Heart Association
Figure 3. Transthoracic echocardiogram (TTE) after chest x-ray. Baccouche H et al. Circulation 2008; 117: 1745 -1749 Copyright © American Heart Association
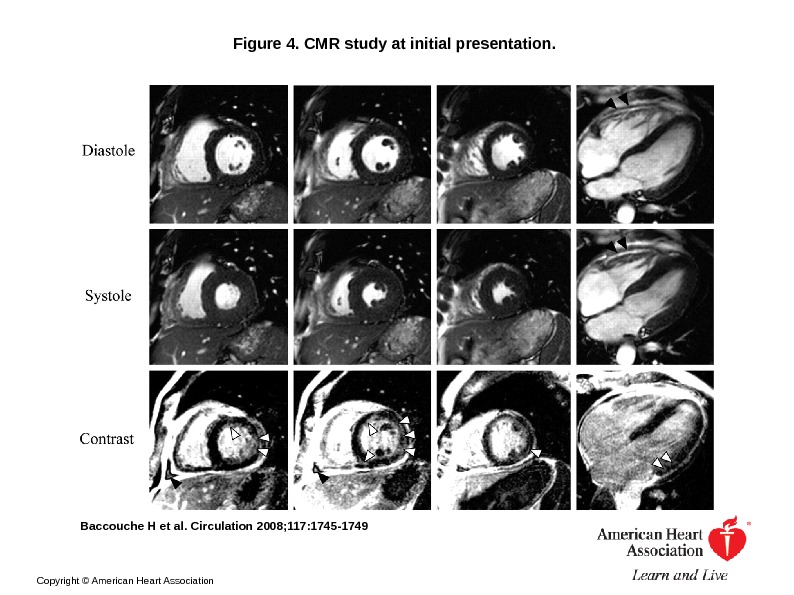
Figure 4. CMR study at initial presentation. Baccouche H et al. Circulation 2008; 117: 1745 -1749 Copyright © American Heart Association
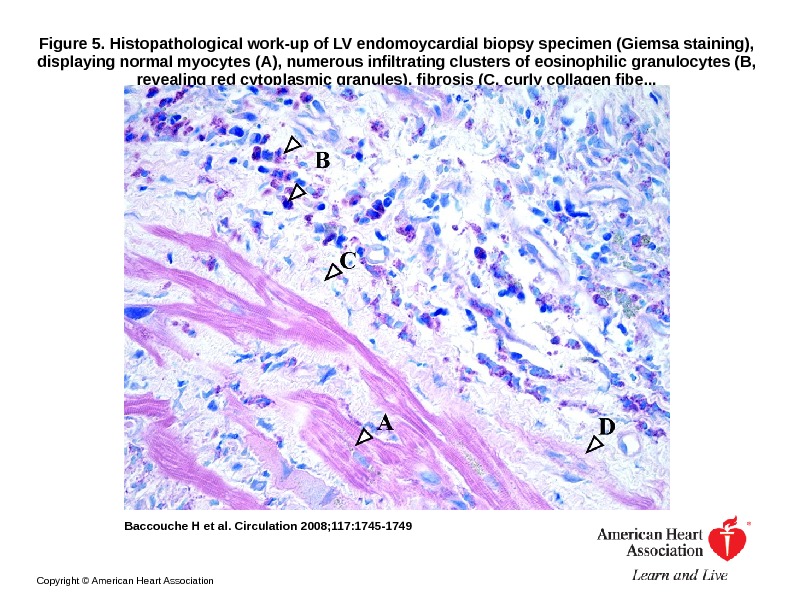
Figure 5. Histopathological work-up of LV endomoycardial biopsy specimen (Giemsa staining), displaying normal myocytes (A), numerous infiltrating clusters of eosinophilic granulocytes (B, revealing red cytoplasmic granules), fibrosis (C, curly collagen fibe. . . Baccouche H et al. Circulation 2008; 117: 1745 -1749 Copyright © American Heart Association
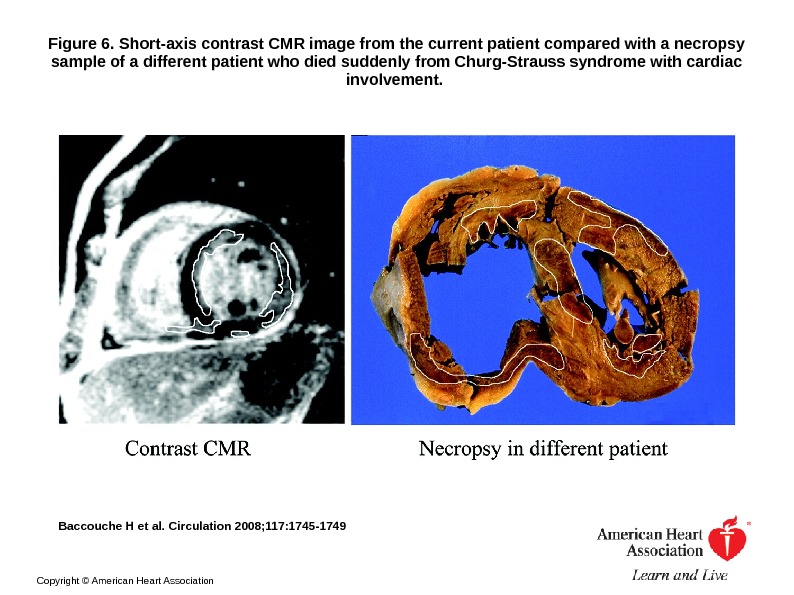
Figure 6. Short-axis contrast CMR image from the current patient compared with a necropsy sample of a different patient who died suddenly from Churg-Strauss syndrome with cardiac involvement. Baccouche H et al. Circulation 2008; 117: 1745 -1749 Copyright © American Heart Association
Figure 7. Follow-up CMR after 2 months of immunosuppressive therapy using the same CMR protocol as described above. Baccouche H et al. Circulation 2008; 117: 1745 -1749 Copyright © American Heart Association
Figure 8. Quantitative plot visualizing the extent of late gadolinium enhancement before (left panel) and after 2 months of immunosuppressive treatment (right panel) as gray-scale maps representing signal intensity in the American Heart Association/American. . . Baccouche H et al. Circulation 2008; 117: 1745 -1749 Copyright © American Heart Association
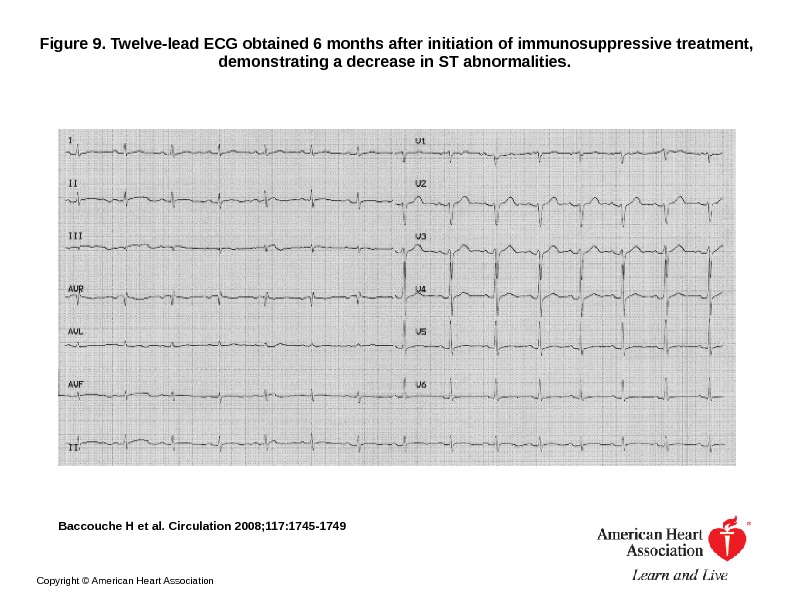
Figure 9. Twelve-lead ECG obtained 6 months after initiation of immunosuppressive treatment, demonstrating a decrease in ST abnormalities. Baccouche H et al. Circulation 2008; 117: 1745 -1749 Copyright © American Heart Association