
Larson & Farber, Elementary Statistics: Picturing the


measures_of_central_tendencies.ppt
- Размер: 1.9 Mегабайта
- Количество слайдов: 41
Описание презентации Larson & Farber, Elementary Statistics: Picturing the по слайдам
Larson & Farber, Elementary Statistics: Picturing the World , 3 e 1 Data Description- Measures of Central Tendencies
Larson & Farber, Elementary Statistics: Picturing the World , 3 e 2 Outline Warm up review of key statistical terms Introduction Measures of Central Tendency Mean Median & Mode, all for an ungrouped and grouped data.
Larson & Farber, Elementary Statistics: Picturing the World , 3 e 3 Objectives Summarize data using the measures of central tendency, such as the mean, median, mode, and midrange. familiarize & work with grouped & ungrouped data calculating the mean, mode & median inin either grouped or or ungrouped data define key concepts of a frequency distribution table
Larson & Farber, Elementary Statistics: Picturing the World , 3 e 41 -10 The Mean (arithmetic average) The mean is defined to be the sum of the data values divided by the total number of values. We will compute two means : one for the sample and one for a finite population of values.
Larson & Farber, Elementary Statistics: Picturing the World , 3 e 51 -10 The Mean (arithmetic average) The mean , in most cases, is not an actual data value
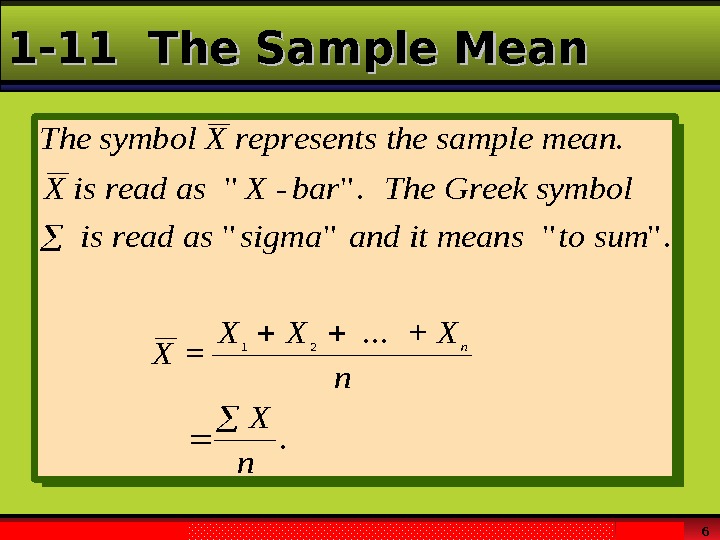
Larson & Farber, Elementary Statistics: Picturing the World , 3 e 61 -11 The Sample Mean. Thesymbol. Xrepresentsthesamplemean Xisreadas. Xbar. The. Greeksymbol isreadassigmaanditmeanstosum X XXX n n . «-«. » = + «»». . .
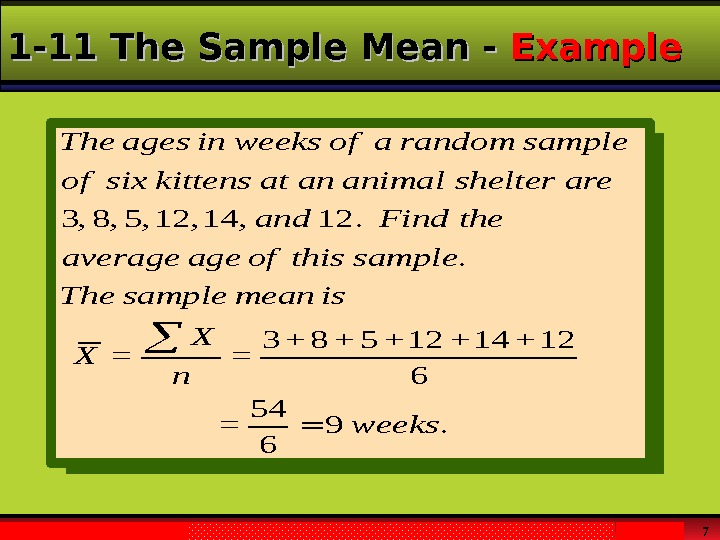
Larson & Farber, Elementary Statistics: Picturing the World , 3 e 71 -11 The Sample Mean — Example. 9 6 54 = 6 12+14+12+5+8+3 == . . 12 , 14 , 12 , 5 , 8 , 3 weeks n X X ismeansample. The samplethisofageaverage the. Findand areshelteranimalanatkittenssixof samplerandomaofweeksinages. The
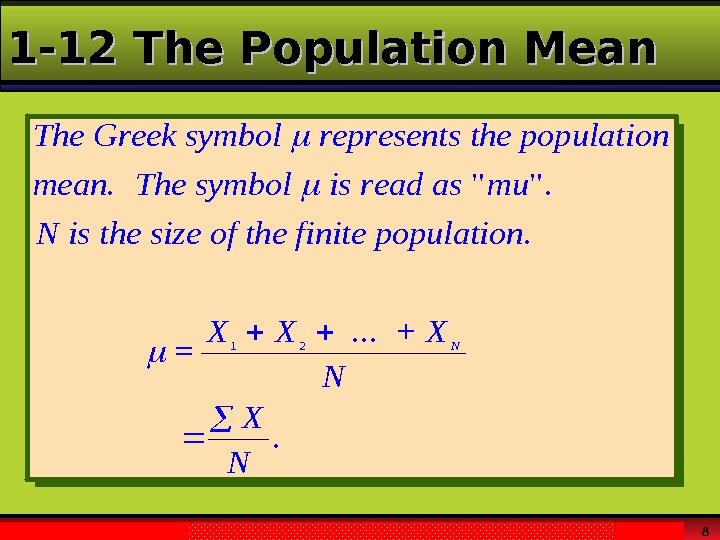
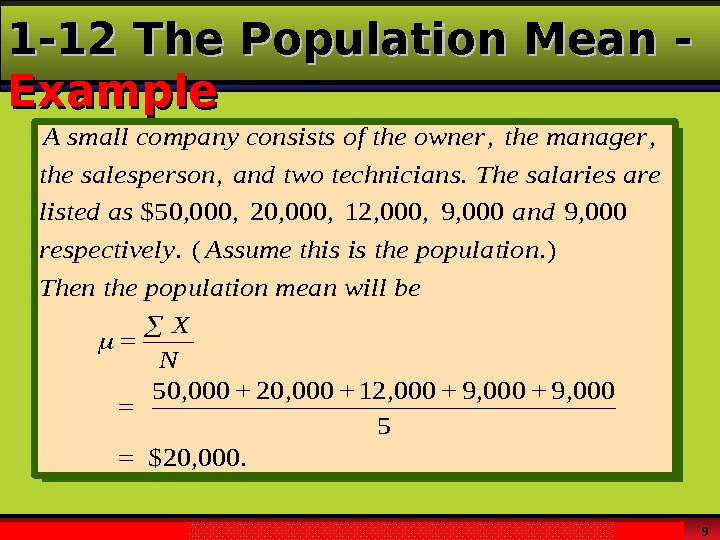
Larson & Farber, Elementary Statistics: Picturing the World , 3 e 81 -12 The Population Mean. The. Greeksymbolrepresentsthepopulation mean. Thesymbolisreadasmu Nisthesizeofthefinitepopulation XXX N N . » = + «. . .
Larson & Farber, Elementary Statistics: Picturing the World , 3 e 91 -12 The Population Mean — Example. Asmallcompanyconsistsoftheownerthemanager thesalespersonandtwotechnicians. Thesalariesare listedasand respectively. Assumethisisthepopulation Thenthepopulationmeanwillbe X N , , , . $50, , , , , . ( . ) = = 50, 000+20, 000+12, 000+9, 000 5 = 00020000120009000 $20, 000.
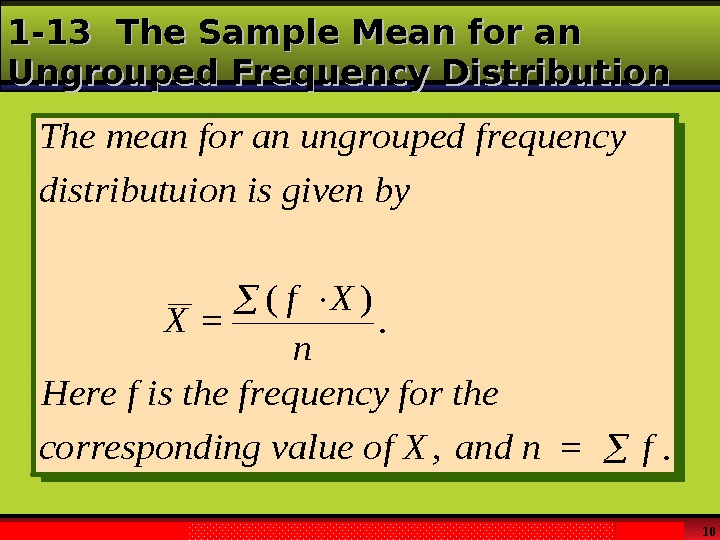
Larson & Farber, Elementary Statistics: Picturing the World , 3 e 101 -13 The Sample Mean for an Ungrouped Frequency Distribution. Themeanforanungroupedfrequency distributuionisgivenby X f. X n Herefisthefrequencyforthe correspondingvalueof. Xandnf = () , =. .
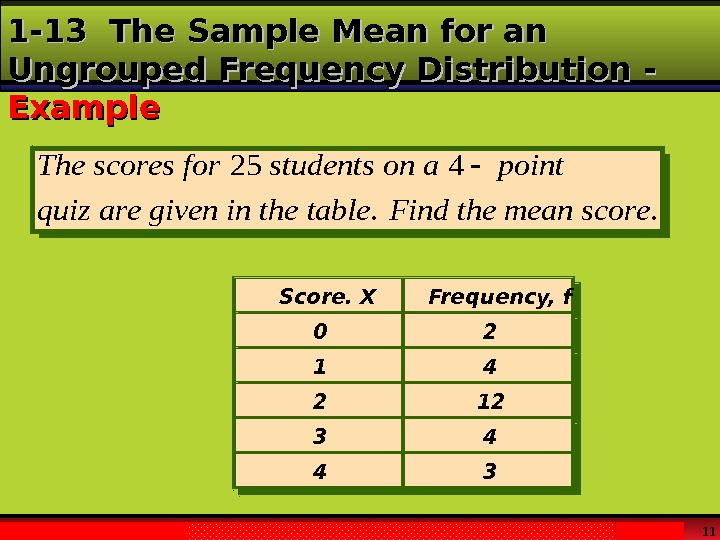
Larson & Farber, Elementary Statistics: Picturing the World , 3 e 111 -13 The Sample Mean for an Ungrouped Frequency Distribution — Example. Thescoresforstudentsonapoint quizaregiveninthetable. Findthemeanscore . 254. Score, X Frequency, f 0 2 1 4 2 12 3 4 4 3 5 Score, X 0 2 1 4 2 12 3 4 4 3 5 Frequency, f
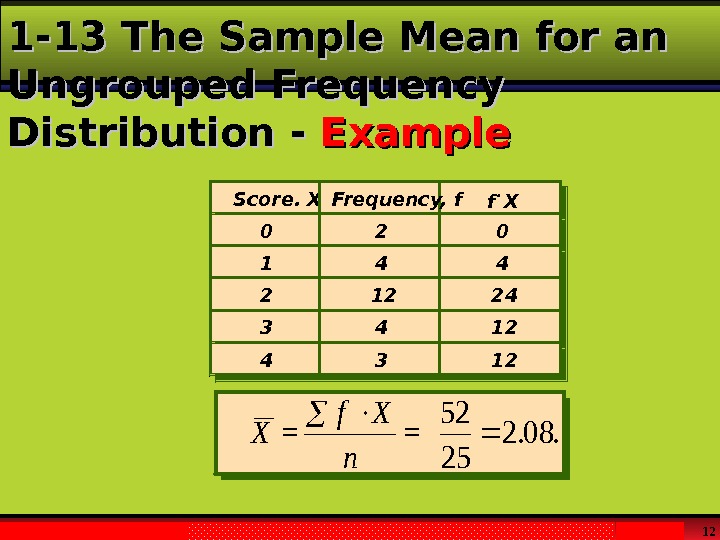
Larson & Farber, Elementary Statistics: Picturing the World , 3 e 12 Score, X Frequency, f f X 0 2 0 1 4 4 2 12 24 3 4 12 4 3 12 5 Score, X X 0 2 0 1 4 4 2 12 24 3 4 12 4 3 12 5 == 52 25 X f. X n 208. . 1 -13 The Sample Mean for an Ungrouped Frequency Distribution — Example Frequency, f f
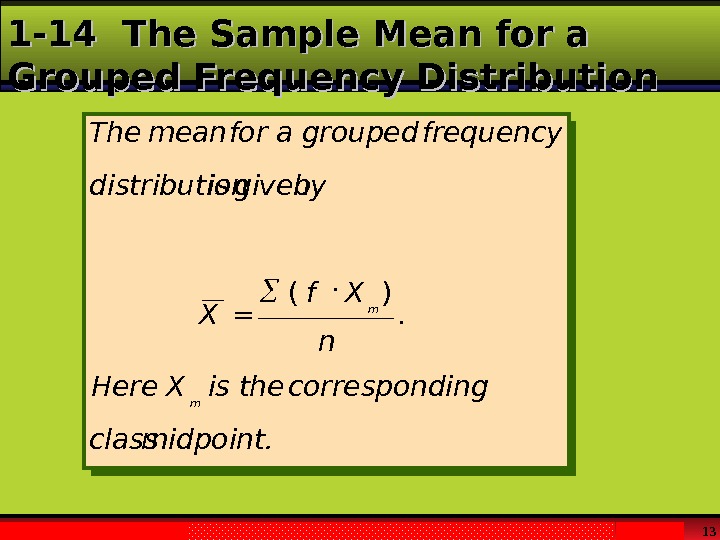
Larson & Farber, Elementary Statistics: Picturing the World , 3 e 131 -14 The Sample Mean for a Grouped Frequency Distribution The mean for a grouped frequency distribution is given by X f X n Here X is the corresponding class midpoint. m m = ( ) .
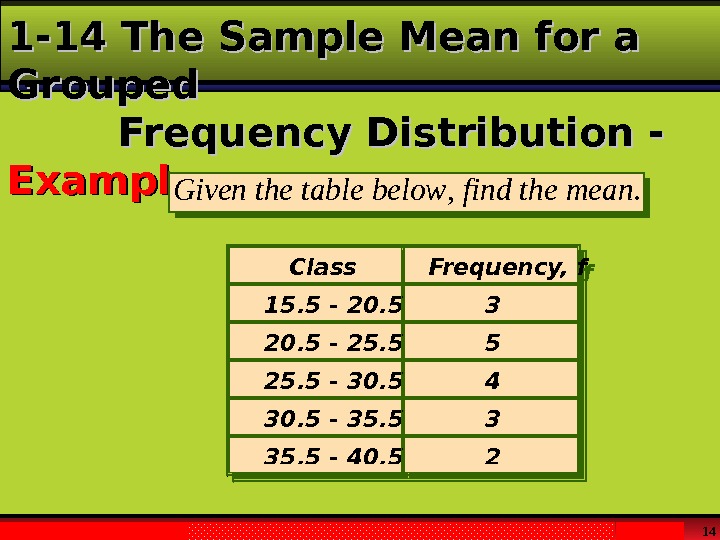
Larson & Farber, Elementary Statistics: Picturing the World , 3 e 141 -14 The Sample Mean for a Grouped Frequency Distribution — Example. Giventhetablebelowfindthemean , . Class Frequency, f 15. 5 — 20. 5 3 20. 5 — 25. 5 5 25. 5 — 30. 5 4 30. 5 — 35. 5 3 35. 5 — 40. 5 2 5 Class 15. 5 — 20. 5 3 20. 5 — 25. 5 5 25. 5 — 30. 5 4 30. 5 — 35. 5 3 35. 5 — 40. 5 2 5 Frequency, f
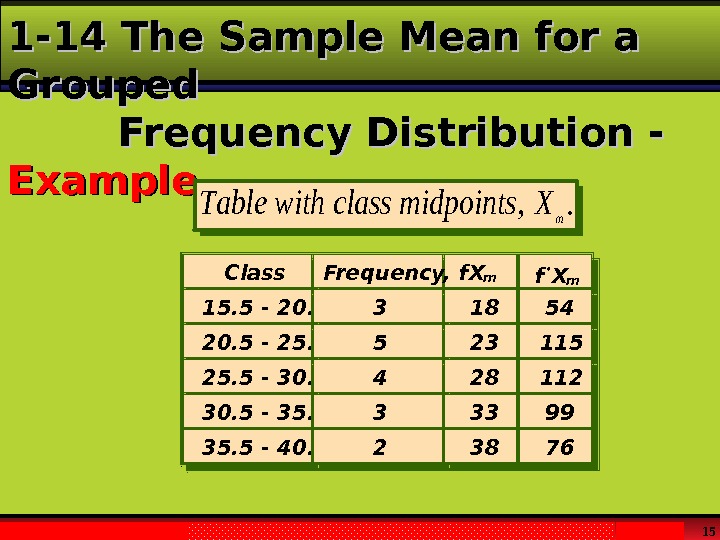
Larson & Farber, Elementary Statistics: Picturing the World , 3 e 151 -14 The Sample Mean for a Grouped Frequency Distribution — Example. Tablewithclassmidpoints. Xm , . Class Frequency, f X m f X m 15. 5 — 20. 5 3 18 54 20. 5 — 25. 5 5 23 115 25. 5 — 30. 5 4 28 112 30. 5 — 35. 5 3 33 99 35. 5 — 40. 5 2 38 76 5 Class X X 15. 5 — 20. 5 3 18 54 20. 5 — 25. 5 5 23 115 25. 5 — 30. 5 4 28 112 30. 5 — 35. 5 3 33 99 35. 5 — 40. 5 2 38 76 5 Frequency, f m
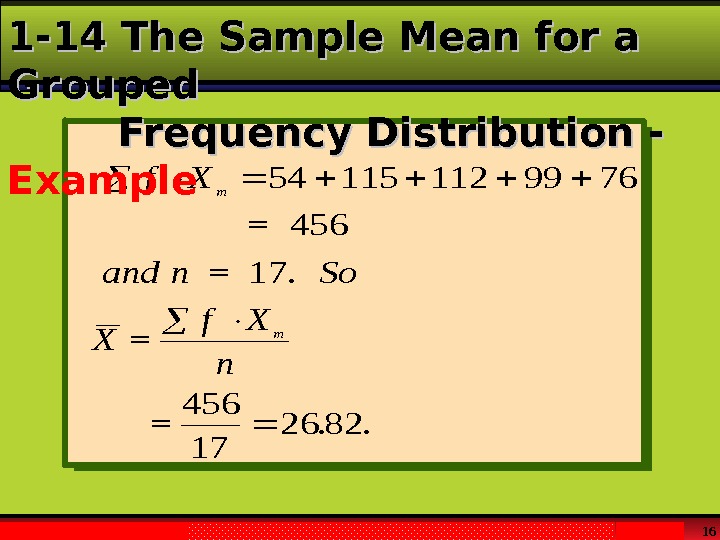
Larson & Farber, Elementary Statistics: Picturing the World , 3 e 16 = =. = = f. X andn. So X f. X n m m 541151129976 456 17 2682. . 1 -14 The Sample Mean for a Grouped Frequency Distribution — Example
Larson & Farber, Elementary Statistics: Picturing the World , 3 e 172 -10 The Median When a data set is ordered, it is called a data array. The median is defined to be the midpoint of the data array. The symbol used to denote the median is MDMD.
Larson & Farber, Elementary Statistics: Picturing the World , 3 e 182 -11 The Median — Example The weights (in pounds) of seven army recruits are 180, 201, 220, 191, 219, 209, and 186. Find the median. Arrange the data in order and select the middle point.
Larson & Farber, Elementary Statistics: Picturing the World , 3 e 192 -11 The Median — Example Data array: 180, 186, 191, 201 , 209, 219, 220. The median, MD = 201.
Larson & Farber, Elementary Statistics: Picturing the World , 3 e 202 -11 The Median In the previous example, there was an odd number of values in the data set. In this case it is easy to select the middle number in the data array.
Larson & Farber, Elementary Statistics: Picturing the World , 3 e 212 -11 The Median When there is an even number of values in the data set, the median is obtained by taking the average of the two middle numbers.
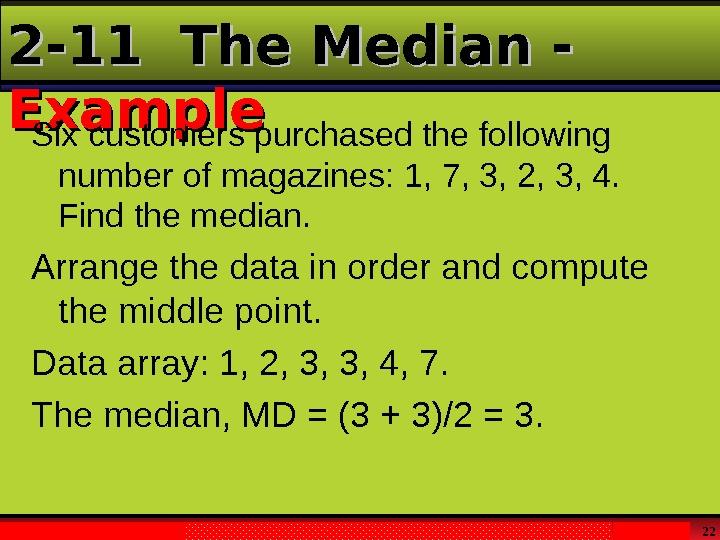
Larson & Farber, Elementary Statistics: Picturing the World , 3 e 222 -11 The Median — Example Six customers purchased the following number of magazines: 1, 7, 3, 2, 3, 4. Find the median. Arrange the data in order and compute the middle point. Data array: 1, 2, 3, 3, 4, 7. The median, MD = (3 + 3)/2 = 3.
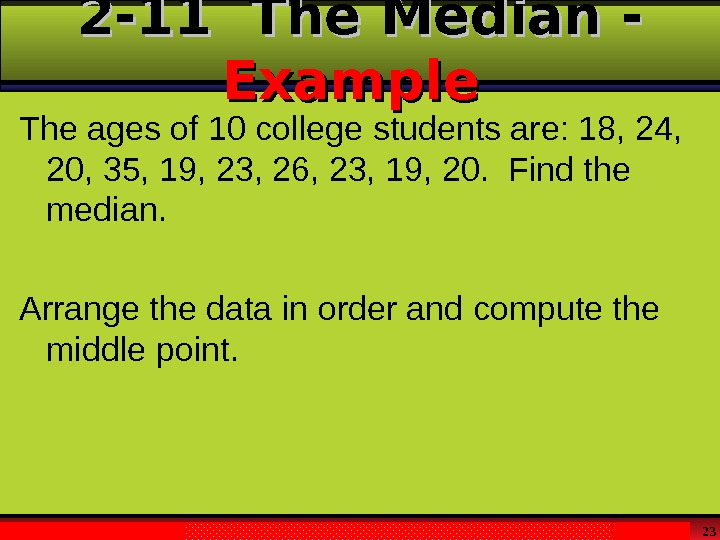
Larson & Farber, Elementary Statistics: Picturing the World , 3 e 232 -11 The Median — Example The ages of 10 college students are: 18, 24, 20, 35, 19, 23, 26, 23, 19, 20. Find the median. Arrange the data in order and compute the middle point.
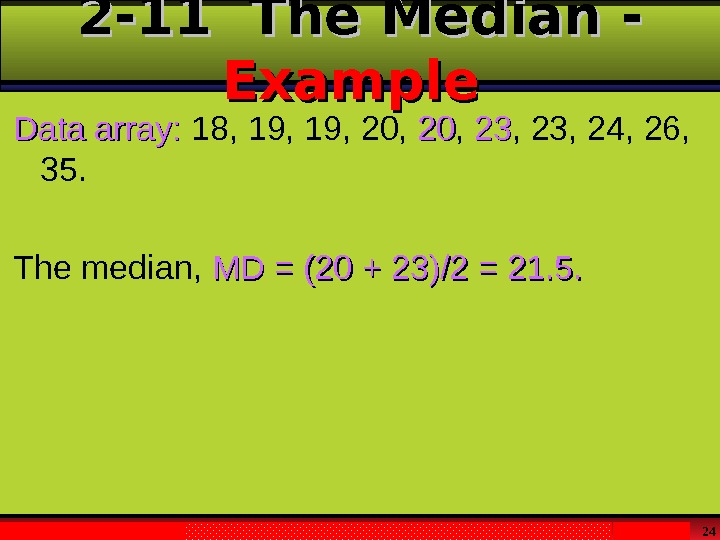
Larson & Farber, Elementary Statistics: Picturing the World , 3 e 242 -11 The Median — Example Data array: 18, 19, 20, 2020 , 2323 , 23, 24, 26, 35. The median, MD = (20 + 23)/2 = 21. 5.
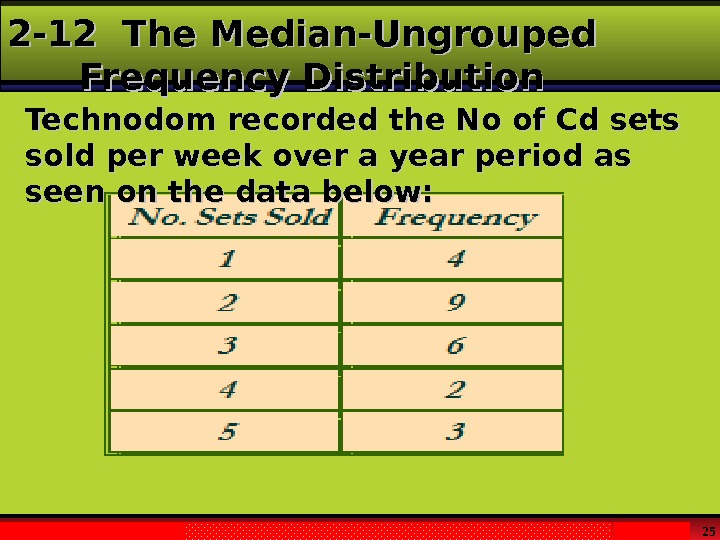
Larson & Farber, Elementary Statistics: Picturing the World , 3 e 252 -12 The Median-Ungrouped Frequency Distribution Technodom recorded the No of Cd sets sold per week over a year period as seen on the data below:
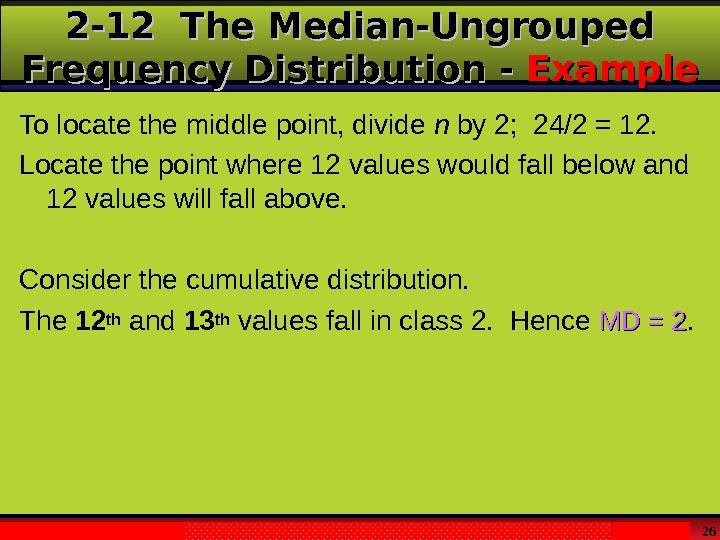
Larson & Farber, Elementary Statistics: Picturing the World , 3 e 262 -12 The Median-Ungrouped Frequency Distribution — Example To locate the middle point, divide n by 2; 24/2 = 12. Locate the point where 12 values would fall below and 12 values will fall above. Consider the cumulative distribution. The 12 th and 13 th values fall in class 2. Hence MD = 2.
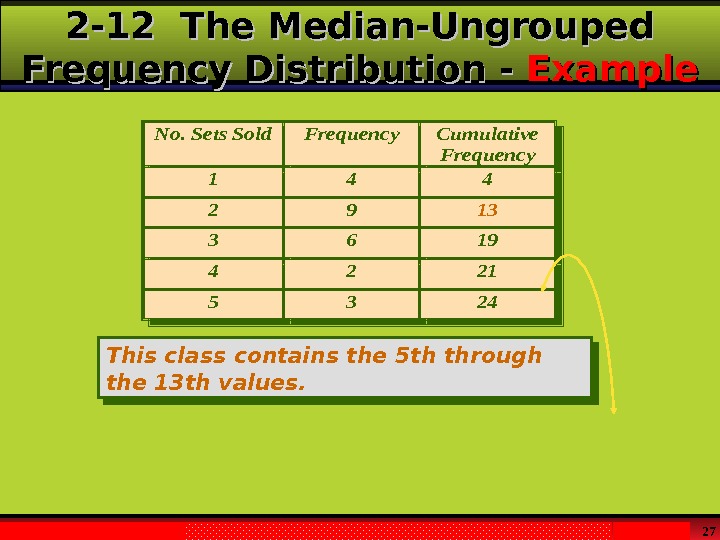
Larson & Farber, Elementary Statistics: Picturing the World , 3 e 27 No. Sets Sold. Frequency. Cumulative Frequency 144 2913 3619 4221 5324 This class contains the 5 th through the 13 th values. 2 -12 The Median-Ungrouped Frequency Distribution — Example
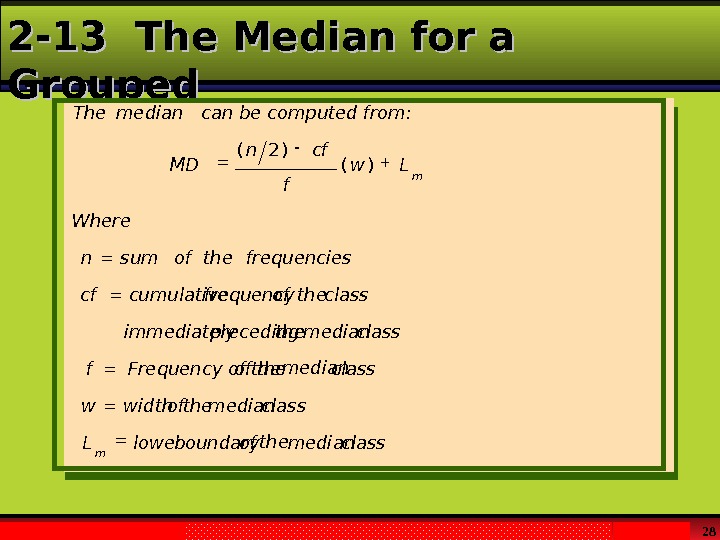
Larson & Farber, Elementary Statistics: Picturing the World , 3 e 282 -13 The Median for a Grouped Frequency Distribution classmedianthe ofboundarylower. L classmediantheofwidthw classmedian theof. Frequency of the f classmediantheprecedingimmediately classtheoffrequencycumulativecf frequenciestheofsumn. Where Lw f cfn MD can be computed from: median. The m m )()2(
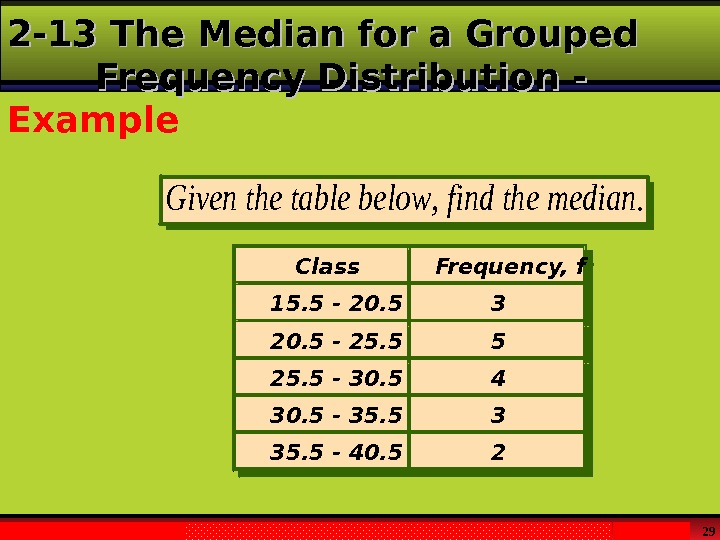
Larson & Farber, Elementary Statistics: Picturing the World , 3 e 292 -13 The Median for a Grouped Frequency Distribution — Example. Giventhetablebelowfindthemedian , . Class Frequency, f 15. 5 — 20. 5 3 20. 5 — 25. 5 5 25. 5 — 30. 5 4 30. 5 — 35. 5 3 35. 5 — 40. 5 2 5 Class 15. 5 — 20. 5 3 20. 5 — 25. 5 5 25. 5 — 30. 5 4 30. 5 — 35. 5 3 35. 5 — 40. 5 2 5 Frequency, f
Larson & Farber, Elementary Statistics: Picturing the World , 3 e 30 Tablewithcumulativefrequencies . Class Frequency, f Cumulative Frequency 15. 5 — 20. 5 3 3 20. 5 — 25. 5 5 8 25. 5 — 30. 5 4 12 30. 5 — 35. 5 3 15 35. 5 — 40. 5 2 17 5 Class Cumulative 15. 5 — 20. 5 3 3 20. 5 — 25. 5 5 8 25. 5 — 30. 5 4 12 30. 5 — 35. 5 3 15 35. 5 — 40. 5 2 17 52 -13 The Median for a Grouped Frequency Distribution — Example Frequency, f Frequency
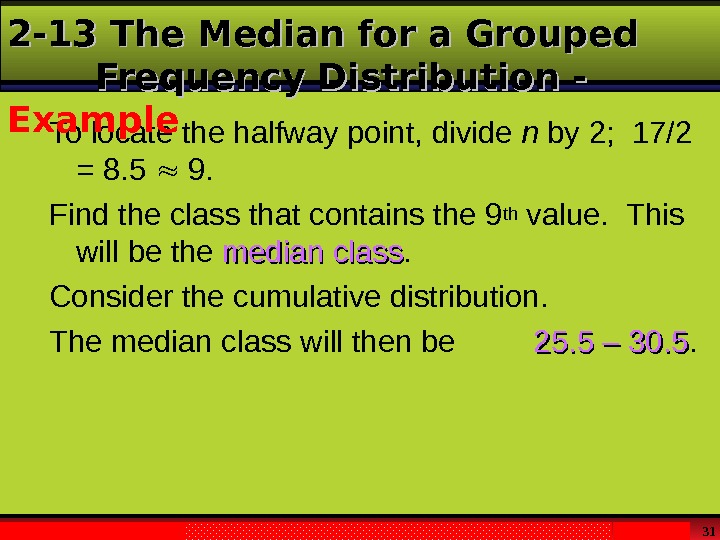
Larson & Farber, Elementary Statistics: Picturing the World , 3 e 31 To locate the halfway point, divide n by 2; 17/2 = 8. 5 9. Find the class that contains the 9 th value. This will be the median class. Consider the cumulative distribution. The median class will then be 25. 5 – 30. 5. 2 -13 The Median for a Grouped Frequency Distribution — Example
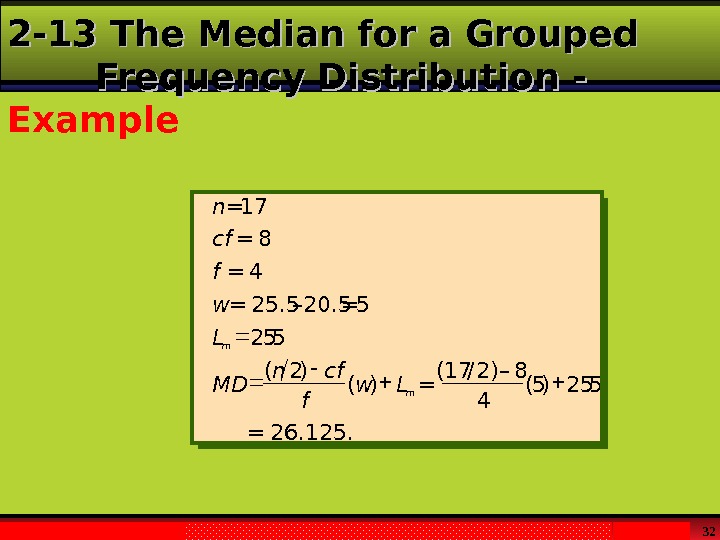
Larson & Farber, Elementary Statistics: Picturing the World , 3 e 322 -13 The Median for a Grouped Frequency Distribution — Example = 17 = = – 20. 5 = 5 ( ) = (17 / 2) – 8 4 = 26. 125. n cf f w L MD n cf f w Lm m 8 4 25. 5 25 5 . ( ).
Larson & Farber, Elementary Statistics: Picturing the World , 3 e 333 -10 The Mode The mode is defined to be the value that occurs most often in a data set. A data set can have more than one mode. A data set is said to have no mode if all values occur with equal frequency.
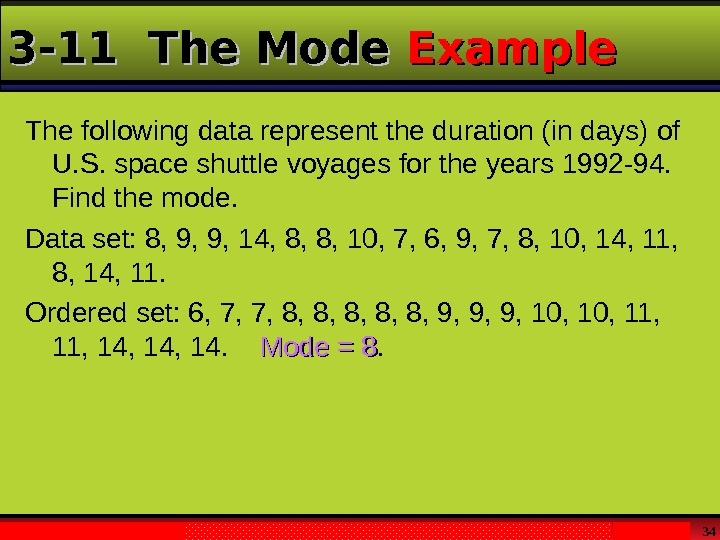
Larson & Farber, Elementary Statistics: Picturing the World , 3 e 343 -11 The Mode Example The following data represent the duration (in days) of U. S. space shuttle voyages for the years 1992 -94. Find the mode. Data set: 8, 9, 9, 14, 8, 8, 10, 7, 6, 9, 7, 8, 10, 14, 11, 8, 14, 11. Ordered set: 6, 7, 7, 8, 8, 8, 9, 9, 9, 10, 11, 14, 14. Mode = 8.
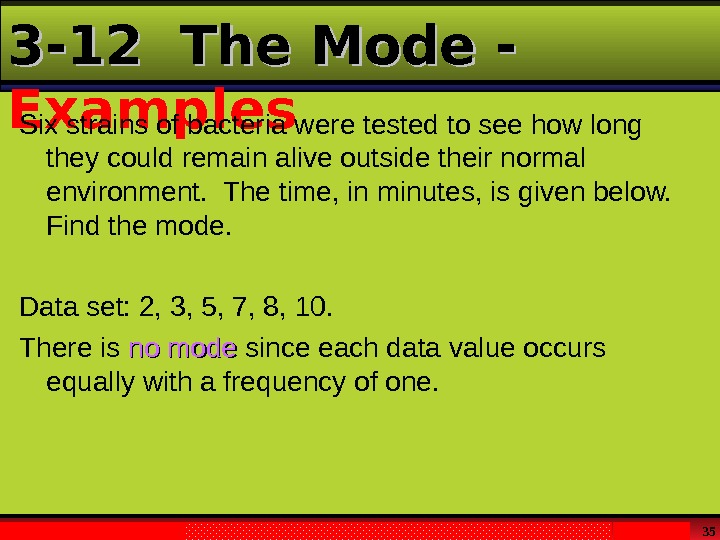
Larson & Farber, Elementary Statistics: Picturing the World , 3 e 353 -12 The Mode — Examples Six strains of bacteria were tested to see how long they could remain alive outside their normal environment. The time, in minutes, is given below. Find the mode. Data set: 2, 3, 5, 7, 8, 10. There is no mode since each data value occurs equally with a frequency of one.
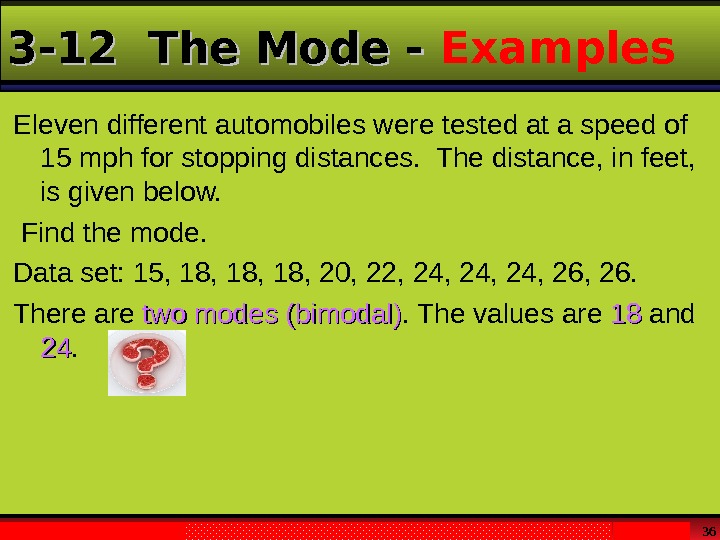
Larson & Farber, Elementary Statistics: Picturing the World , 3 e 363 -12 The Mode — Examples Eleven different automobiles were tested at a speed of 15 mph for stopping distances. The distance, in feet, is given below. Find the mode. Data set: 15, 18, 18, 20, 22, 24, 24, 26. There are two modes (bimodal). The values are 1818 and 2424.
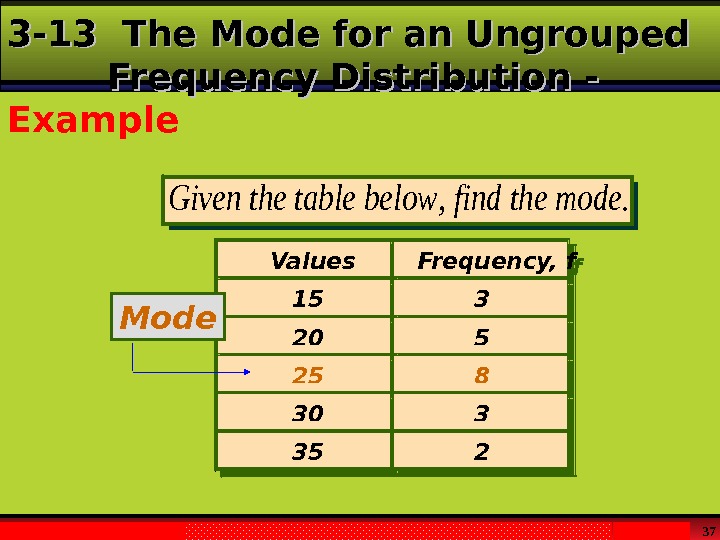
Larson & Farber, Elementary Statistics: Picturing the World , 3 e 373 -13 The Mode for an Ungrouped Frequency Distribution — Example. Giventhetablebelowfindthe , . mode Values Frequency, f 15 3 20 5 25 8 30 3 35 2 5 Values 15 3 20 5 25 8 30 3 35 2 5 Mode Frequency, f
Larson & Farber, Elementary Statistics: Picturing the World , 3 e 383 -13 The Mode for an Ungrouped Frequency Distribution — Example The mode for grouped data is the modal class. The modal class is the class with the largest frequency. Sometimes the midpoint of the class is used rather than the boundaries.
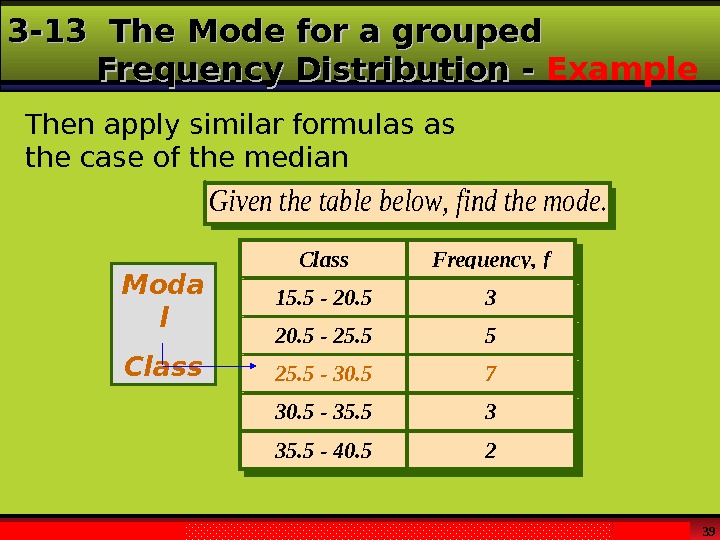
Larson & Farber, Elementary Statistics: Picturing the World , 3 e 393 -13 The Mode for a grouped Frequency Distribution — Example. Giventhetablebelowfindthe , . mode Class. Frequency, f 15. 5 — 20. 53 20. 5 — 25. 55 25. 5 — 30. 57 30. 5 — 35. 53 35. 5 — 40. 52 5 Class. Frequency, f 15. 5 — 20. 53 20. 5 — 25. 55 25. 5 — 30. 57 30. 5 — 35. 53 35. 5 — 40. 525 Moda l Class. Then apply similar formulas as the case of the median
Larson & Farber, Elementary Statistics: Picturing the World , 3 e 403 -14 The Weighted Mean The weighted mean is used when the values in a data set are not all equally represented. The weighted mean of a variable XX is found by multiplying each value by its corresponding weight and dividing the sum of the products by the sum of the weights.
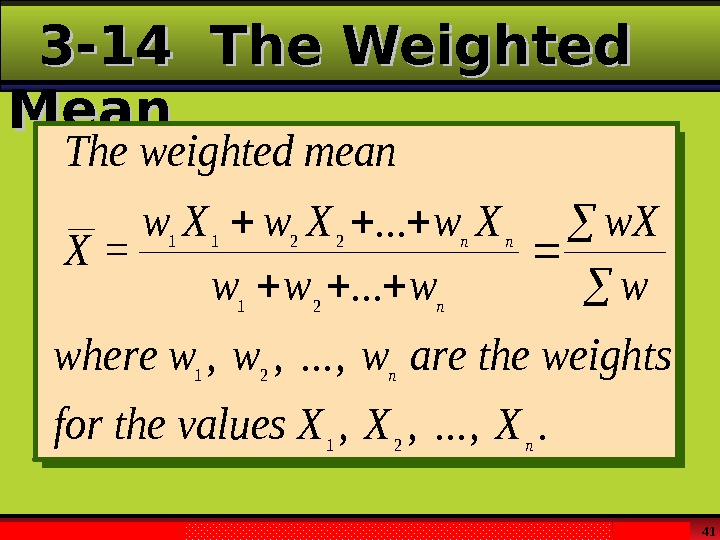
Larson & Farber, Elementary Statistics: Picturing the World , 3 e 41 3 -14 The Weighted Mean = Theweightedmean X w. Xw. X www w. X w wherewwwaretheweights forthevalues. XXX nn n 1122 12 12 12 . . . , , . . . , .