Key performance indicator of SRI «Caspimunaigas» LLP

godovoy_otchet_eng.pptx
- Размер: 10.0 Мб
- Автор:
- Количество слайдов: 25
Описание презентации Key performance indicator of SRI «Caspimunaigas» LLP по слайдам
 Key performance indicator of SRI «Caspimunaigas» LLP per 2016 Atyrau,
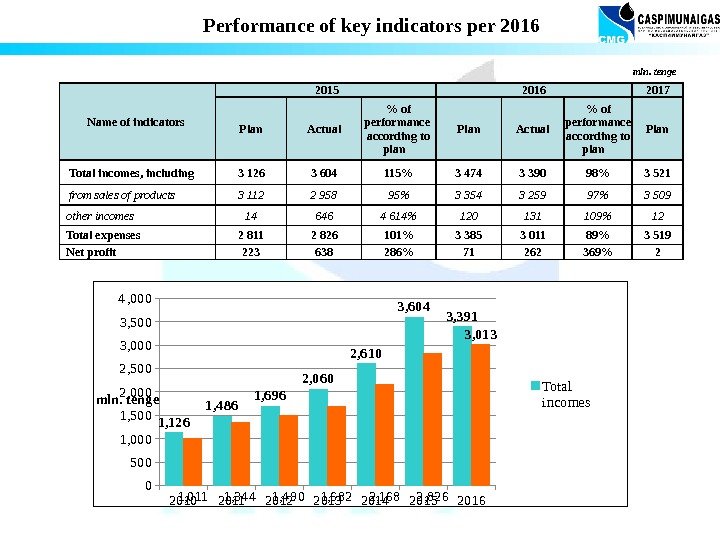
 Performance of key indicators per 2016 Name of indicators 2015 2016 2017 Plan Actual % of performance according to plan Plan Total incomes, including 3 126 3 604 115% 3 474 3 390 98% 3 521 from sales of products 3 112 2 958 95% 3 354 3 259 97% 3 509 other incomes 14 646 4 614% 120 131 109% 12 Total expenses 2 811 2 826 101% 3 385 3 011 89% 3 519 Net profit 223 638 286% 71 262 369% 2 mln. tenge 2010201120122013201420152016 0 500 1, 000 1, 500 2, 000 2, 500 3, 000 3, 500 4 , 000 1, 126 1, 4 861, 696 2, 060 2, 610 3, 6043, 391 1, 0111, 34 41, 4 901, 6822, 1682, 826 3, 013 Total incomesmln. teng e
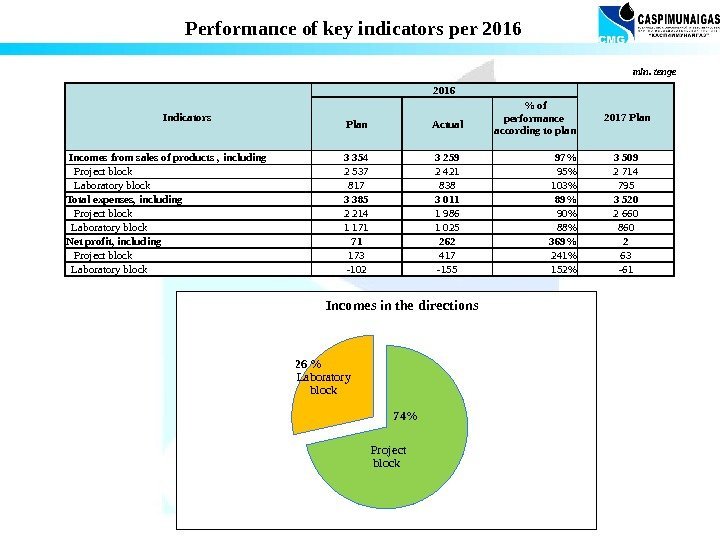
 Performance of key indicators per 2016 mln. tenge Indicators 2016 2017 Plan Actual % of performance according to plan Incomes from sales of products , including 3 354 3 259 97% 3 509 Project block 2 537 2 421 95% 2 714 Laboratory block 817 838 103% 795 Total expenses, including 3 385 3 011 89% 3 520 Project block 2 214 1 986 90% 2 660 Laboratory block 1 171 1 025 88% 860 Net profit, including 71 262 369% 2 Project block 173 417 241% 63 Laboratory block -102 -155 152% -61 Incomes in the directions 7 4 %26 % Laboratory block Proje ct block
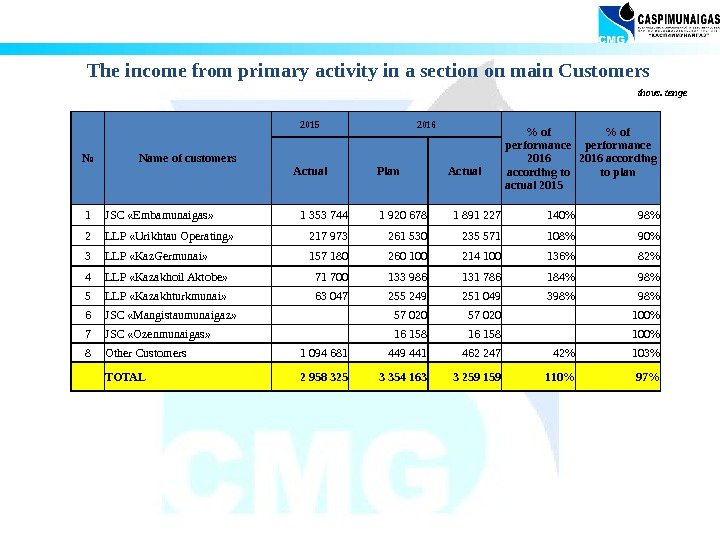
 The income from primary activity in a section on main Customers № Name of customers 2015 2016 % of performance 2016 according to actual 2015 % of performance 2016 according to plan. Actual Plan Actual 1 JSC «Embamunaigas» 1 353 744 1 920 678 1 891 227 140% 98% 2 LLP «Urikhtau Operating» 217 973 261 530 235 571 108% 90% 3 LLP «Kaz. Germunai» 157 180 260 100 214 100 136% 82% 4 LLP «Kazakhoil Aktobe» 71 700 133 986 131 786 184% 98% 5 LLP «Kazakhturkmunai» 63 047 255 249 251 049 398% 6 JSC «Mangistaumunaigaz» 57 020 100% 7 JSC «Ozenmunaigas» 16 158 100% 8 Other Customers 1 094 681 449 441 462 247 42% 103% TOTAL 2 958 325 3 354 163 3 259 110% 97% thous. tenge
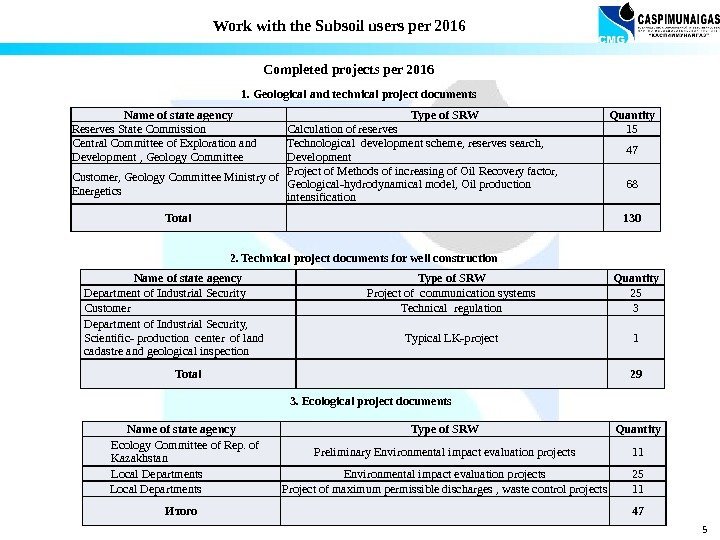
 5 Name of state agency Type of SRW Quantity Reserves State Commission Calculation of reserves 15 Central Committee of Exploration and Development , Geology Committee Technological development scheme, reserves search, Development 47 Customer, Geology Committee Ministry of Energetics Project of Methods of increasing of Oil Recovery factor, Geological-hydrodynamical model, Oil production intensification 68 Total 130 Completed projects per 2016 Work with the Subsoil users per 2016 1. Geological and technical project documents 2. Technical project documents for well construction 3. Ecological project documents Name of state agency Type of SRW Quantity Department of Industrial Security Project of communication systems 25 Customer Technical regulation 3 Department of Industrial Security, Scientific- production center of land cadastre and geological inspection Typical LK-project 1 Total 29 Name of state agency Type of SRW Quantity Ecology Committee of Rep. of Kazakhstan Preliminary Environmental impact evaluation projects 11 Local Departments Environmental impact evaluation projects 25 Local Departments Project of maximum permissible discharges , waste control projects 11 Итого
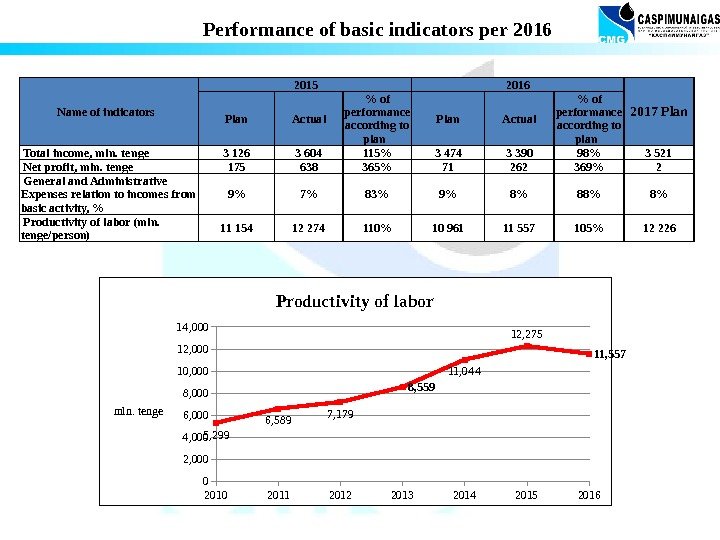
 Performance of basic indicators per 2016 Name of indicators 2015 2016 2017 Plan Actual % of performance according to plan Total income, mln. tenge 3 126 3 604 115% 3 474 3 390 98% 3 521 Net profit, mln. tenge 175 638 365% 71 262 369% 2 General and Administrative Expenses relation to incomes from basic activity, % 9% 7% 83% 9% 8% 8% Productivity of labor (mln. tenge/person) 11 154 12 274 110% 10 961 11 557 105% 12 2262010201120122013201420152016 0 2, 000 4 , 000 6, 000 8, 000 10, 000 12, 000 14 , 000 5 , 299 6, 5 897, 179 8, 559 11, 04 4 12, 275 11, 557 Productivity of labor mln. te nge
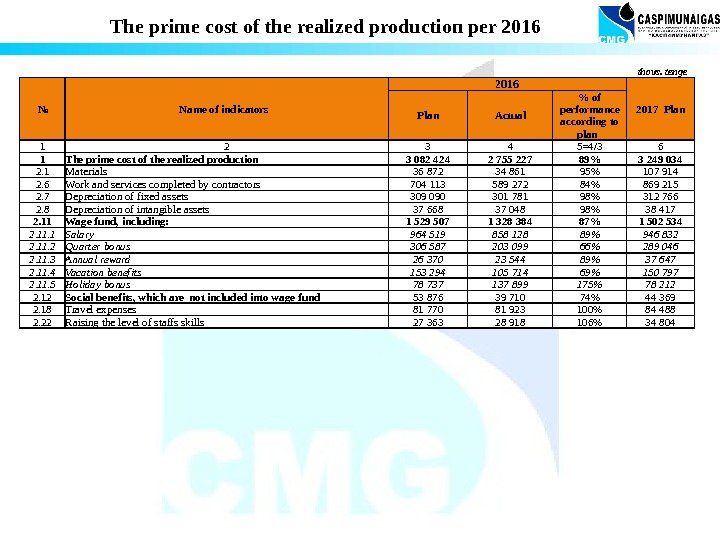
 The prime cost of the realized production per 2016 № Name of indicators 2016 2017 Plan Actual % of performance according to plan 1 2 3 4 5=4/3 6 1 The prime cost of the realized production 3 082 424 2 755 227 89% 3 249 034 2. 1 Materials 36 872 34 861 95% 107 914 2. 6 Work and services completed by contractors 704 113 589 272 84% 869 215 2. 7 Depreciation of fixed assets 309 090 301 781 98% 312 766 2. 8 Depreciation of intangible assets 37 668 37 048 98% 38 417 2. 11 Wage fund, including: 1 529 507 1 328 384 87% 1 502 534 2. 11. 1 Salary 964 519 858 128 89% 946 832 2. 11. 2 Quarter bonus 306 587 203 099 66% 289 046 2. 11. 3 Annual reward 26 370 23 544 89% 37 647 2. 11. 4 Vacation benefits 153 294 105 714 69% 150 797 2. 11. 5 Holiday bonus 78 737 137 899 175% 78 212 2. 12 Social benefits, which are not included into wage fund 53 876 39 710 74% 44 369 2. 18 Travel expenses 81 770 81 923 100% 84 488 2. 22 Raising the level of staffs skills 27 363 28 918 106% 34 804 thous. tenge
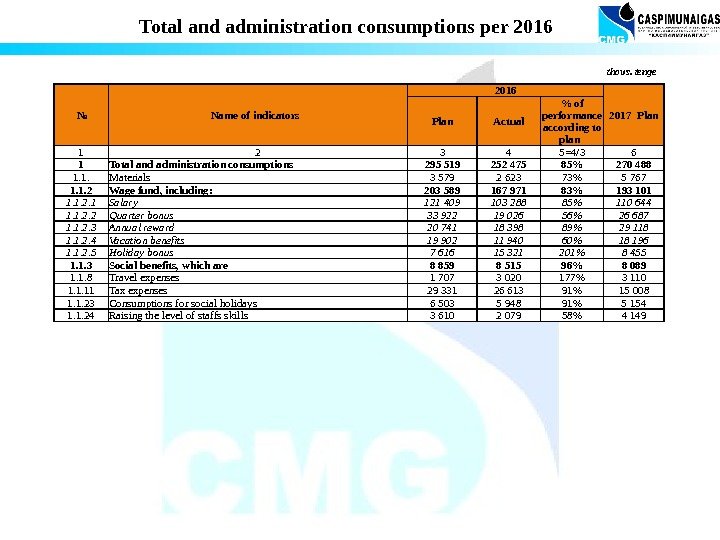
 Total and administration consumptions per 2016 № Name of indicators 2016 2017 Plan Actual % of performance according to plan 1 2 3 4 5=4/3 6 1 Total and administration consumptions 295 519 252 475 85% 270 488 1. 1. Materials 3 579 2 623 73% 5 767 1. 1. 2 Wage fund, including: 203 589 167 971 83% 193 101 1. 1. 2. 1 Salary 121 409 103 288 85% 110 644 1. 1. 2. 2 Quarter bonus 33 922 19 026 56% 26 687 1. 1. 2. 3 Annual reward 20 741 18 398 89% 29 118 1. 1. 2. 4 Vacation benefits 19 902 11 940 60% 18 196 1. 1. 2. 5 Holiday bonus 7 616 15 321 201% 8 455 1. 1. 3 Social benefits, which are 8 859 8 515 96% 8 089 1. 1. 8 Travel expenses 1 707 3 020 177% 3 110 1. 1. 11 Tax expenses 29 331 26 613 91% 15 008 1. 1. 23 Consumptions for social holidays 6 503 5 948 91% 5 154 1. 1. 24 Raising the level of staffs skills 3 610 2 079 58% 4 149 thous. tenge
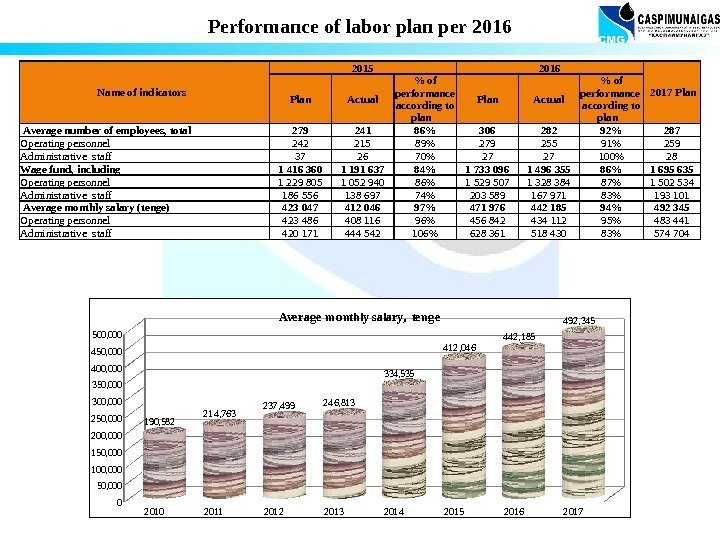
 Performance of labor plan per 2016 Name of indicators 2015 2016 2017 Plan Actual % of performance according to plan Average number of employees, total 279 241 86% 306 282 92% 287 Operating personnel 242 215 89% 279 255 91% 259 Administrative staff 37 26 70% 27 27 100% 28 Wage fund, including 1 416 360 1 191 637 84% 1 733 096 1 496 355 86% 1 695 635 Operating personnel 1 229 805 1 052 940 86% 1 529 507 1 328 384 87% 1 502 534 Administrative staff 186 556 138 697 74% 203 589 167 971 83% 193 101 Average monthly salary (tenge) 423 047 412 046 97% 471 976 442 185 94% 492 345 Operating personnel 423 486 408 116 96% 456 842 434 112 95% 483 441 Administrative staff 420 171 444 542 106% 628 361 518 430 83% 574 704 2010 2011 2012 2013 2014 2015 2016 2017050, 000100, 000150, 000200, 000250, 000 300, 000350, 000400, 000450, 000 500, 000 190, 582 214, 763 237, 499 246, 813 334, 535 412, 046 442, 185 492, 345 Ave rag e mo nthly s alary, te ng e
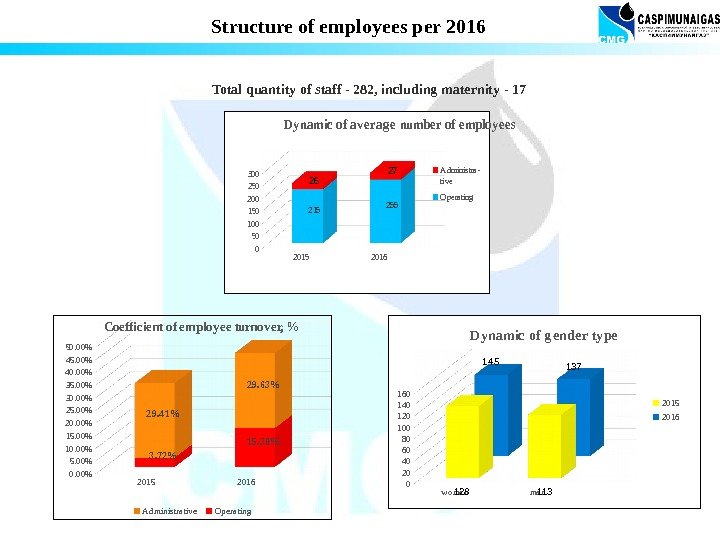
 Structure of employees per 2016 Total quantity of staff — 282, including maternity — 17 2015 20160. 00% 5. 00%10. 00% 15. 00%20. 00% 25. 00%30. 00% 35. 00%40. 00% 45. 00%50. 00% 3. 72% 15. 38%29. 4 1% 29. 63%Coefficient of employee turnover, % Ad ministra tive Ope ra ting woma n 020406080100120140160 128 113145 137 Dynamic of g ender type 2015 2016201520160 50 100 150 200 250 300 215255 26 27 Dynamic of averag e number of employees Ad ministra- tive Ope rating
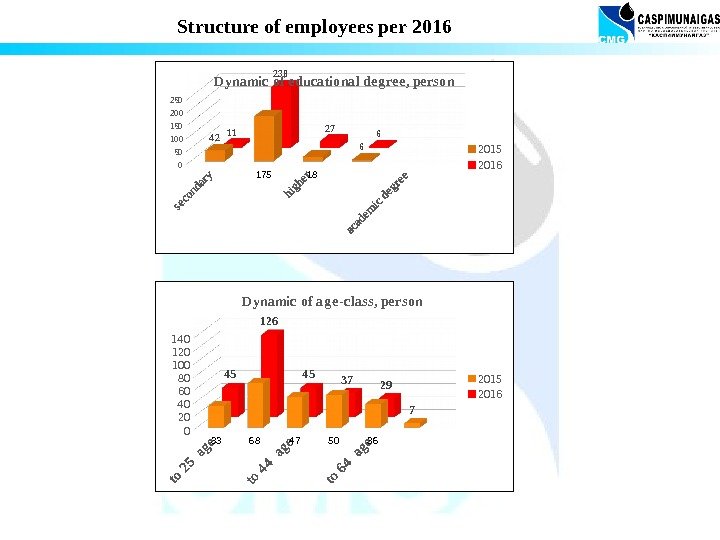
 Structure of employees per 2016 050100 150200 250 4 2 175 18 611 238 27 6 Dynamic of educational deg ree, person 2015 2016 0204 0 608010012014 0 33 68 47 50 36 74 5 126 4 5 3 7 29 Dynamic of ag e-class, person
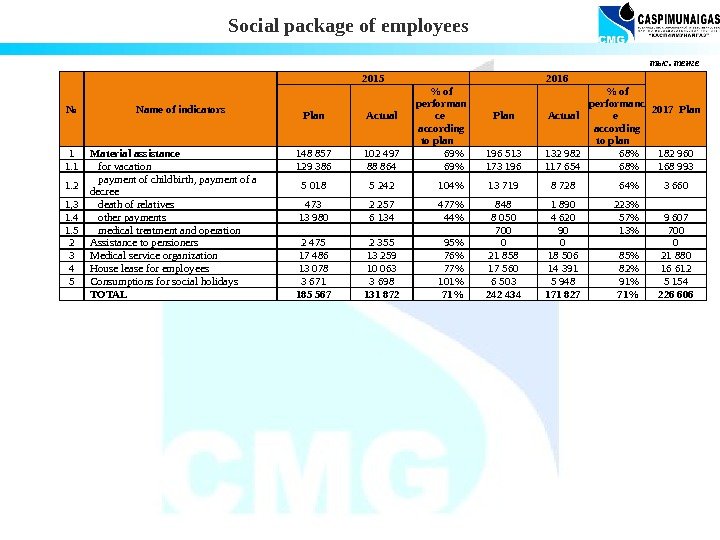
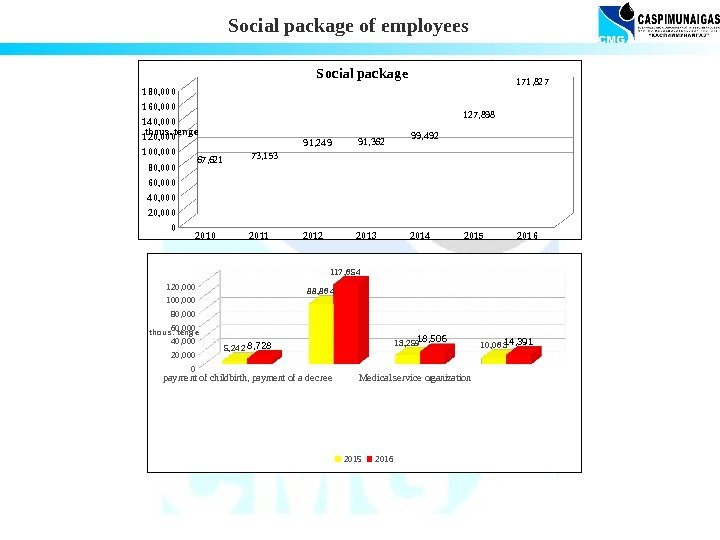
 Social package of employees № Name of indicators 2015 2016 2017 Plan Actual % of performan ce according to plan Plan Actual % of performanc e according to plan 1 Material assistance 148 857 102 497 69% 196 513 132 982 68% 182 960 1. 1 for vacation 129 386 88 864 69% 173 196 117 654 68% 168 993 1. 2 payment of childbirth, payment of a decree 5 018 5 242 104% 13 719 8 728 64% 3 660 1, 3 death of relatives 473 2 257 477% 848 1 890 223% 1. 4 other payments 13 980 6 134 44% 8 050 4 620 57% 9 607 1. 5 medical treatment and operation 700 90 13% 700 2 Assistance to pensioners 2 475 2 355 95% 0 0 0 3 Medical service organization 17 486 13 259 76% 21 858 18 506 85% 21 880 4 House lease for employees 13 078 10 063 77% 17 560 14 391 82% 16 612 5 Consumptions for social holidays 3 671 3 698 101% 6 503 5 948 91% 5 154 TOTAL 185 567 131 872 71% 242 434 171 827 71% 226 606 тыс. тенге
 Social package of employees payme nt of childbirth, payme nt of a de cre e Me dical se rvice organization 020, 00040, 00060, 00080, 000100, 000120, 000 5, 24 2 8 8 , 8 6 4 13 , 259 10 , 0 6 3 8, 728 117 , 6 54 18, 506 14, 391 2015 2016 tho us. te ng e 20102011201220132014201520160 20, 000 4 0, 000 60, 000 80, 000 100, 000 120, 000 14 0, 000 160, 000 180, 000 67, 62173, 153 91, 24991, 36299, 492 127, 898 171, 827 Social packag e thous. teng e
 Social package
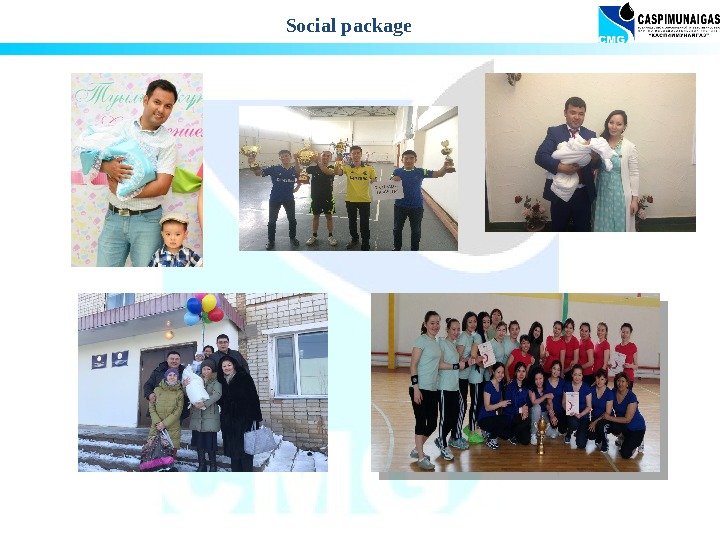
 Charity Young Specialists Union provide volunteer work : Holidays; Visiting; Help with homework. An orphanage for disabled children Boarding house #1 Orphanage «Shanyrak»
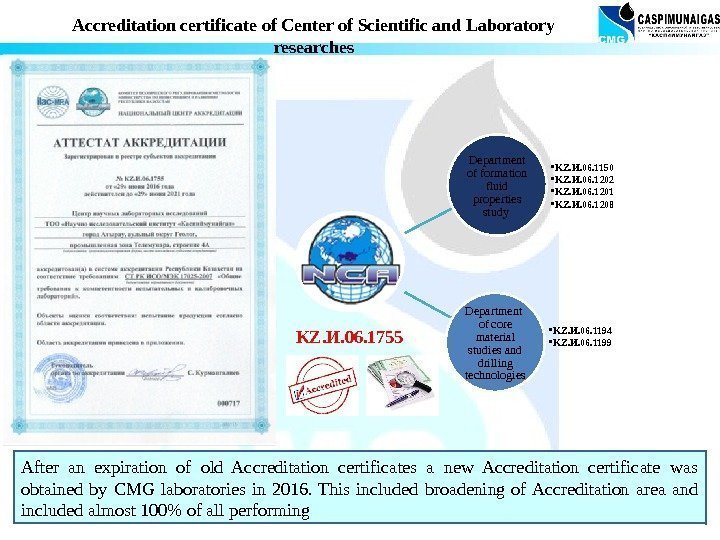
 After an expiration of old Accreditation certificates a new Accreditation certificate was obtained by CMG laboratories in 2016. This included broadening of Accreditation area and included almost 100% of all performing Accreditation certificate of Center of Scientific and Laboratory researches Department of formation fluid properties study • KZ. И. 06. 1150 • KZ. И. 06. 1202 • KZ. И. 06. 1201 • KZ. И. 06. 1208 Department of core material studies and drilling technologies • KZ. И. 06. 1194 • KZ. И. 06. 1199 KZ. И. 06.
 Stage one of administrative office construction including design estimates and construction documents Accreditation Certificate obtained by laboratory Core storage construction Separate 5 -level accounting since September Laboratory personnel training abroad Manpower development, professional development and training for more than 100 employees Within the framework of transformation process 31 staff members were transferred to outsourcing Key events in
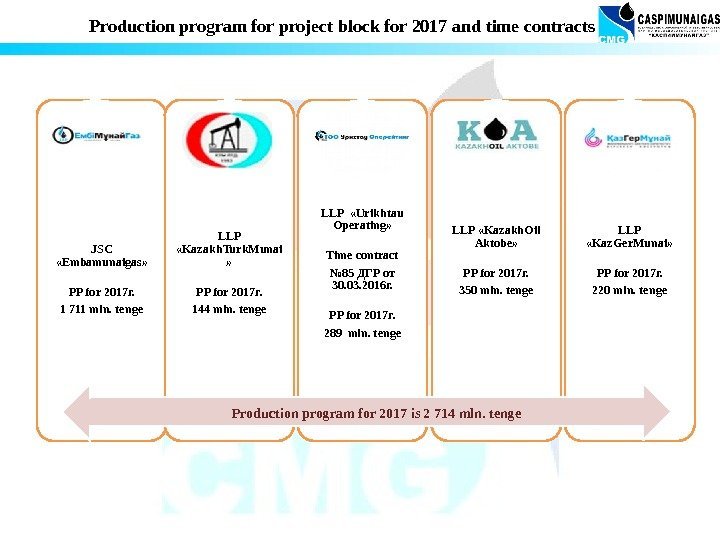
 JSC «Embamunaigas» PP for 2017 г. 1 711 mln. tenge LLP «Kazakh. Turk. Munai » PP for 2017 г. 144 mln. tenge LLP «Urikhtau Operating» Time contract № 85 ДГР от 30. 03. 2016 г. PP for 2017 г. 289 mln. tenge LLP «Kazakh. Oil Aktobe» PP for 2017 г. 350 mln. tenge LLP «Kaz. Ger. Munai» PP for 2017 г. 220 mln. tenge Production program for 2017 is 2 714 mln. tenge. Production program for project block for 2017 and time contracts
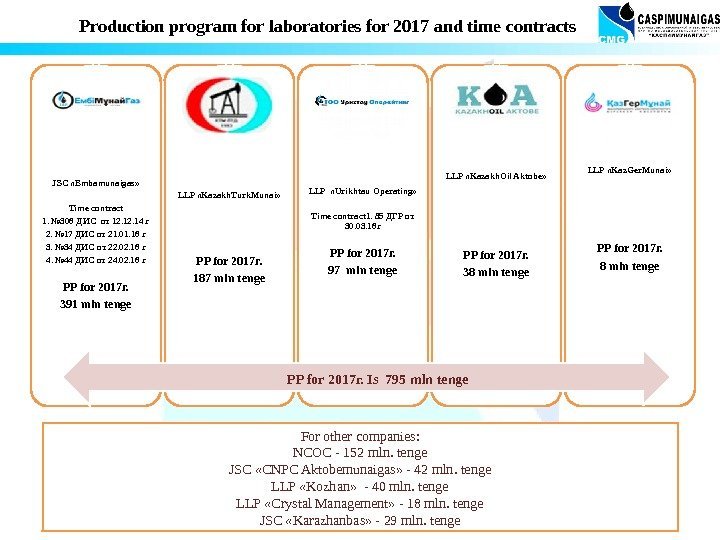
 JSC «Embamunaigas» Time contract 1. № 306 ДИС от 12. 14 г 2. № 17 ДИС от 21. 01. 16 г 3. № 34 ДИС от 22. 02. 16 г 4. № 44 ДИС от 24. 02. 16 г PP for 2017 г. 391 mln tenge LLP «Kazakh. Turk. Munai» PP for 2017 г. 187 mln tenge LLP «Urikhtau Operating» Time contract 1. 85 ДГР от 30. 03. 16 г PP for 2017 г. 97 mln tenge LLP «Kazakh. Oil Aktobe» PP for 2017 г. 38 mln tenge LLP «Kaz. Ger. Munai» PP for 2017 г. 8 mln tenge 1. PP for 2017 г. Is 795 mln tenge For other companies: NCOC — 152 mln. tenge JSC «CNPC Aktobemunaigas» — 42 mln. tenge LLP «Kozhan» — 40 mln. tenge LLP «Crystal Management» — 18 mln. tenge JSC «Karazhanbas» — 29 mln. tenge. Production program for laboratories for 2017 and time contracts
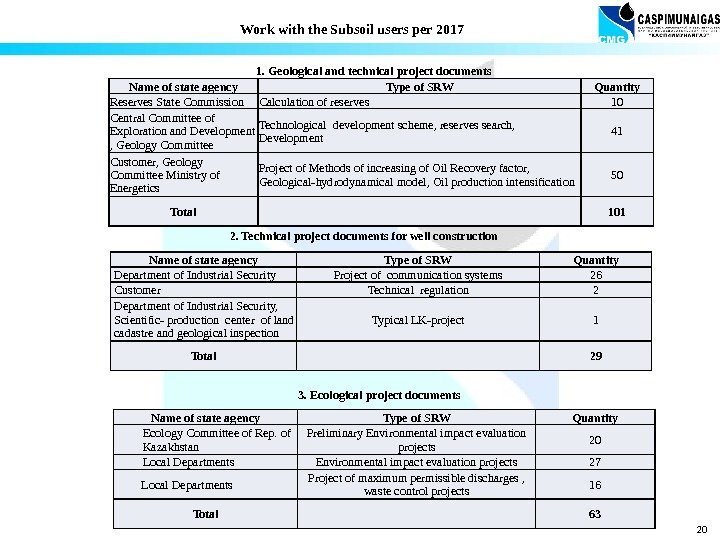
 201. Geological and technical project documents 2. Technical project documents for well construction 3. Ecological project documents Work with the Subsoil users per 2017 Name of state agency Type of SRW Quantity Reserves State Commission Calculation of reserves 10 Central Committee of Exploration and Development , Geology Committee Technological development scheme, reserves search, Development 41 Customer, Geology Committee Ministry of Energetics Project of Methods of increasing of Oil Recovery factor, Geological-hydrodynamical model, Oil production intensification 50 Total 101 Name of state agency Type of SRW Quantity Department of Industrial Security Project of communication systems 26 Customer Technical regulation 2 Department of Industrial Security, Scientific- production center of land cadastre and geological inspection Typical LK-project 1 Total 29 Name of state agency Type of SRW Quantity Ecology Committee of Rep. of Kazakhstan Preliminary Environmental impact evaluation projects 20 Local Departments Environmental impact evaluation projects 27 Local Departments Project of maximum permissible discharges , waste control projects 16 Total
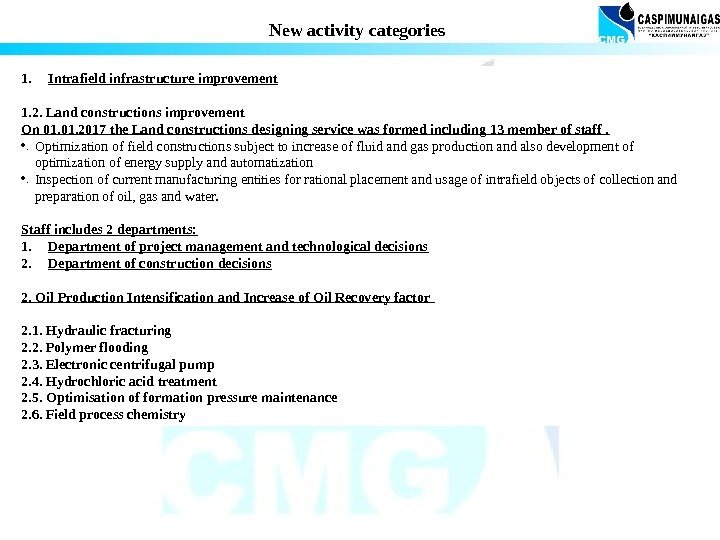
 1. Intrafield infrastructure improvement 1. 2. Land constructions improvement On 01. 2017 the Land constructions designing service was formed including 13 member of staff. • . Optimization of field constructions subject to increase of fluid and gas production and also development of optimization of energy supply and automatization • . Inspection of current manufacturing entities for rational placement and usage of intrafield objects of collection and preparation of oil, gas and water. Staff includes 2 departments: 1. Department of project management and technological decisions 2. Department of construction decisions 2. Oil Production Intensification and Increase of Oil Recovery factor 2. 1. Hydraulic fracturing 2. 2. Polymer flooding 2. 3. Electronic centrifugal pump 2. 4. Hydrochloric acid treatment 2. 5. Optimisation of formation pressure maintenance 2. 6. Field process chemistry New activity categories
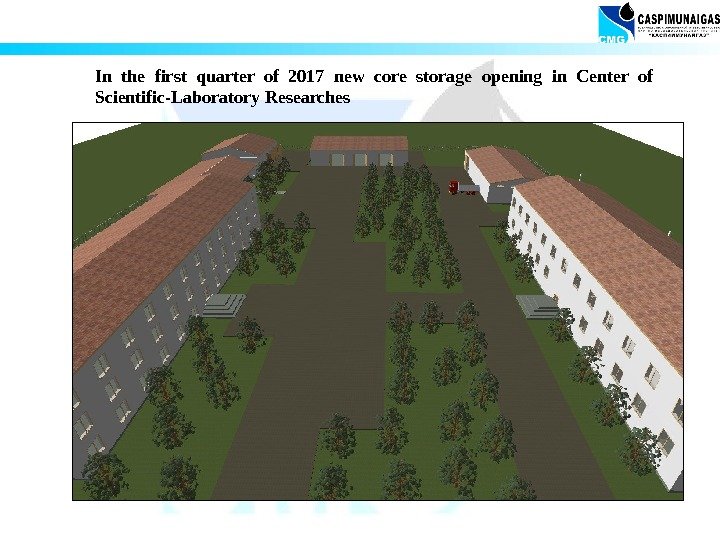
 In the first quarter of 2017 new core storage opening in Center of Scientific-Laboratory Researches
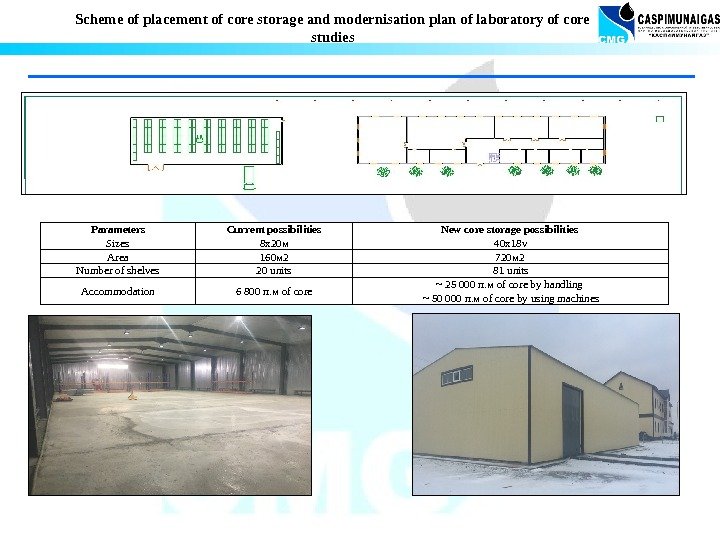
 Scheme of placement of core storage and modernisation plan of laboratory of core studies Parameters Current possibilities New core storage possibilities Sizes 8 х20 м 40 х18 v Area 160 м 2 720 м 2 Number of shelves 20 units 81 units Accommodation 6 800 п. м of core ~ 25 000 п. м of core by handling ~ 50 000 п. м of core by using machines
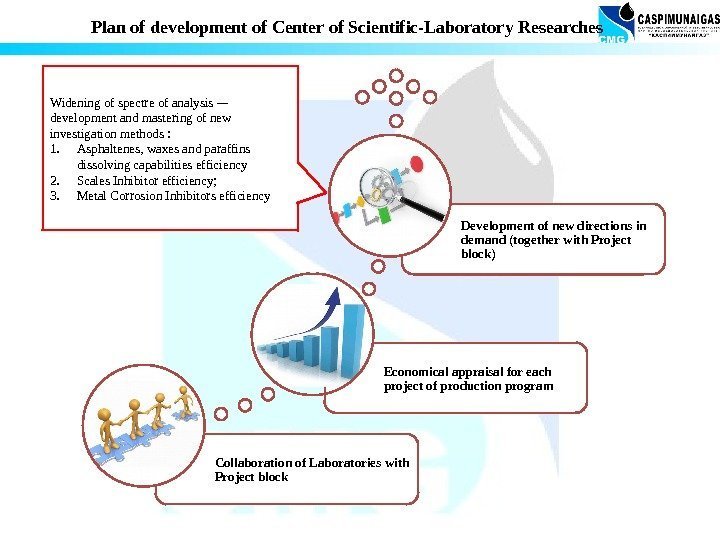
 Collaboration of Laboratories with Project block Economical appraisal for each project of production program Development of new directions in demand (together with Project block)Plan of development of Center of Scientific-Laboratory Researches Widening of spectre of analysis -– development and mastering of new investigation methods : 1. Asphaltenes, waxes and paraffins dissolving capabilities efficiency 2. Scales Inhibitor efficiency; 3. Metal Corrosion Inhibitors efficiency
 Future tasks for 2017 • Improvement of relationships with Customers; • Creation of time contracts with subsoil users, quality increase of projects performed in order to increase the production and expenses efficiency; • Introduction of multidisciplinary teams for 5 main subsoil users • Development of new activities: improving of intrafield infrastructure, production intensification and oil recovery factor increase, field construction projecting, effective management and control of well construction. • Introduction of new drilling and production technologies; • Modernization and software licences update; • Salary increase; • Personnel training and development including young specialists. • New office building construction
