Foundation of Electrical Engineering 2 EGR 213 Sinusoids


ppt-1-sinusoids+and+phasor.ppt
- Количество слайдов: 13
 Foundation of Electrical Engineering 2 EGR 213
 Sinusoids and Phasors Chapter Objectives: Understand the concepts of sinusoids and phasors. Apply phasors to circuit elements. Introduce the concepts of impedance and admittance. Learn about impedance combinations. Apply what is learnt to phase-shifters and AC bridges.
 Alternating (AC) Waveforms The term alternating indicates only that the waveform alternates between two prescribed levels in a set time sequence. Instantaneous value: The magnitude of a waveform at any instant of time; denoted by the lowercase letters (v1, v2). Peak amplitude: The maximum value of the waveform as measured from its average (or mean) value, denoted by the uppercase letters Vm. Period (T): The time interval between successive repetitions of a periodic waveform. Cycle: The portion of a waveform contained in one period of time. Frequency: (Hertz) the number of cycles that occur in 1 s The sinusoidal waveform is the only alternating waveform whose shape is unaffected by the response characteristics of R, L, and C elements. T
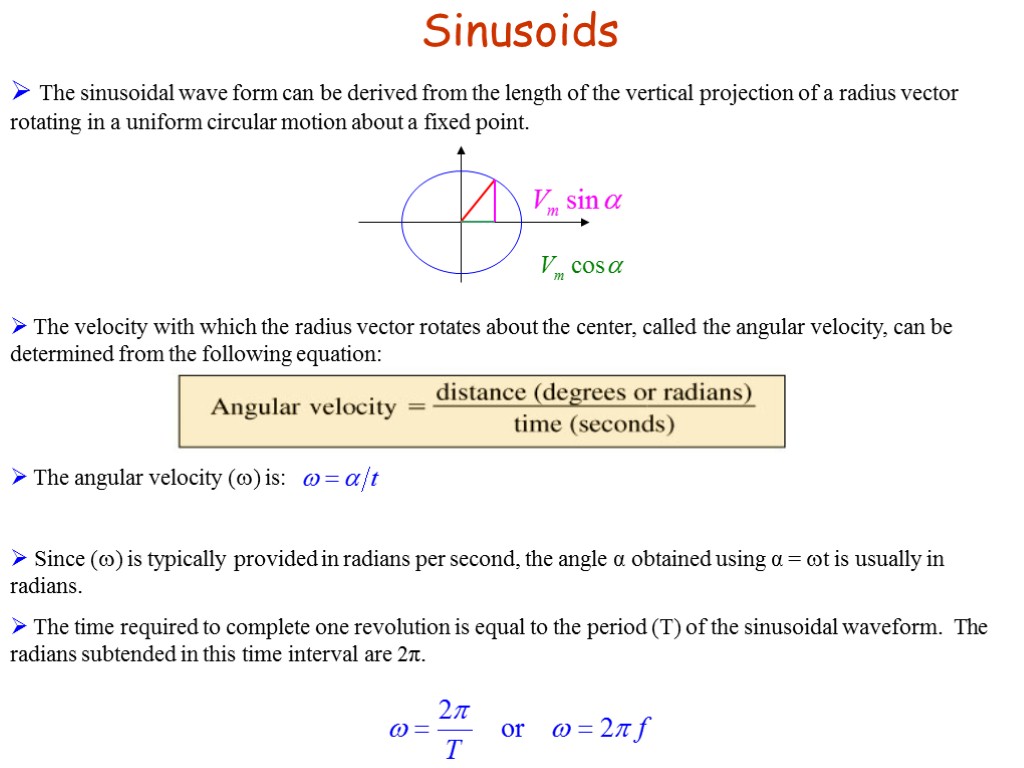
 Sinusoids The sinusoidal wave form can be derived from the length of the vertical projection of a radius vector rotating in a uniform circular motion about a fixed point. The velocity with which the radius vector rotates about the center, called the angular velocity, can be determined from the following equation: The angular velocity () is: Since () is typically provided in radians per second, the angle α obtained using α = t is usually in radians. The time required to complete one revolution is equal to the period (T) of the sinusoidal waveform. The radians subtended in this time interval are 2π.
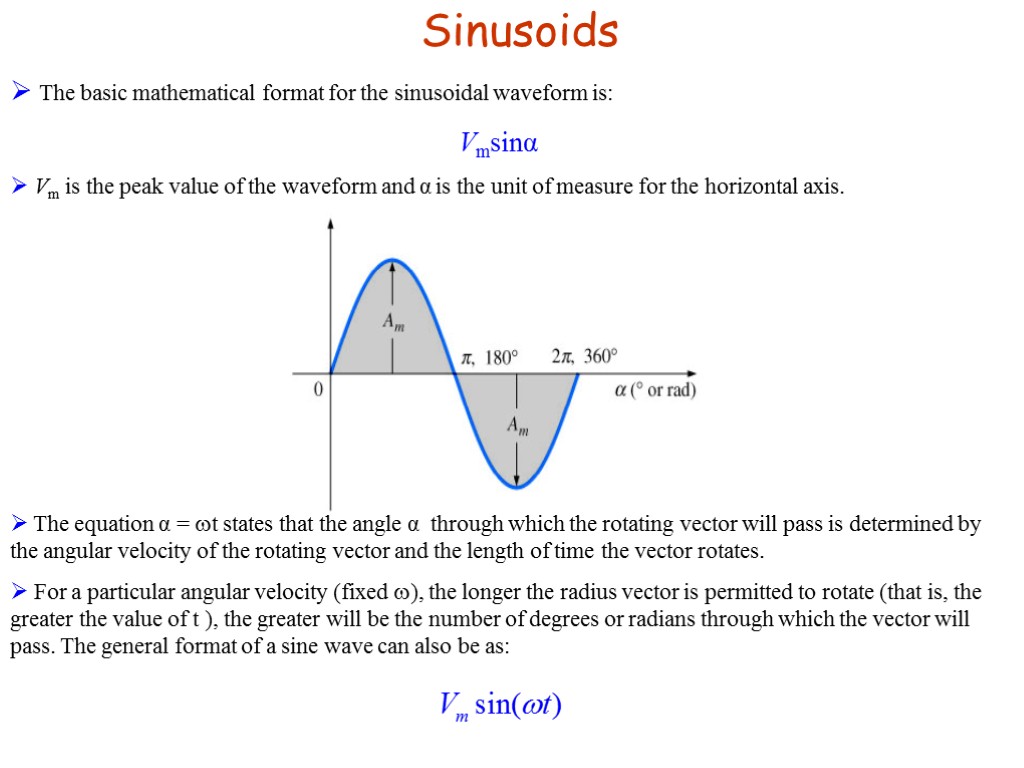
 Sinusoids The basic mathematical format for the sinusoidal waveform is: Vmsinα Vm is the peak value of the waveform and α is the unit of measure for the horizontal axis. The equation α = t states that the angle α through which the rotating vector will pass is determined by the angular velocity of the rotating vector and the length of time the vector rotates. For a particular angular velocity (fixed ), the longer the radius vector is permitted to rotate (that is, the greater the value of t ), the greater will be the number of degrees or radians through which the vector will pass. The general format of a sine wave can also be as:
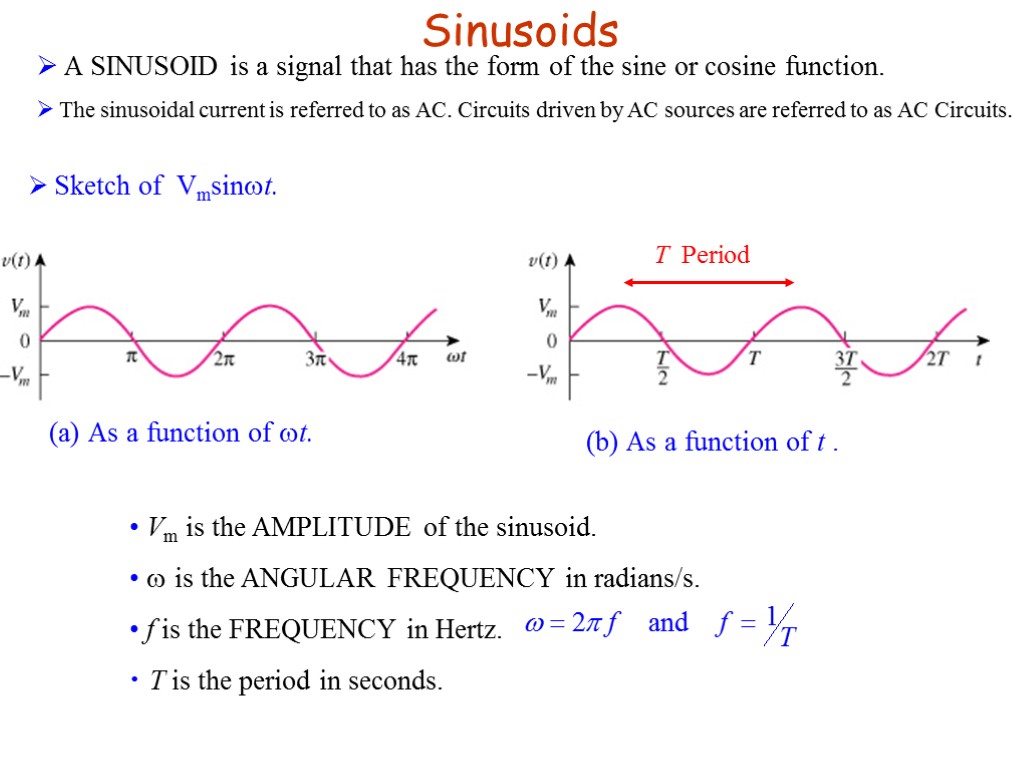
 Sketch of Vmsint. Sinusoids A SINUSOID is a signal that has the form of the sine or cosine function. The sinusoidal current is referred to as AC. Circuits driven by AC sources are referred to as AC Circuits. (a) As a function of t. (b) As a function of t . Vm is the AMPLITUDE of the sinusoid. is the ANGULAR FREQUENCY in radians/s. f is the FREQUENCY in Hertz. T is the period in seconds.
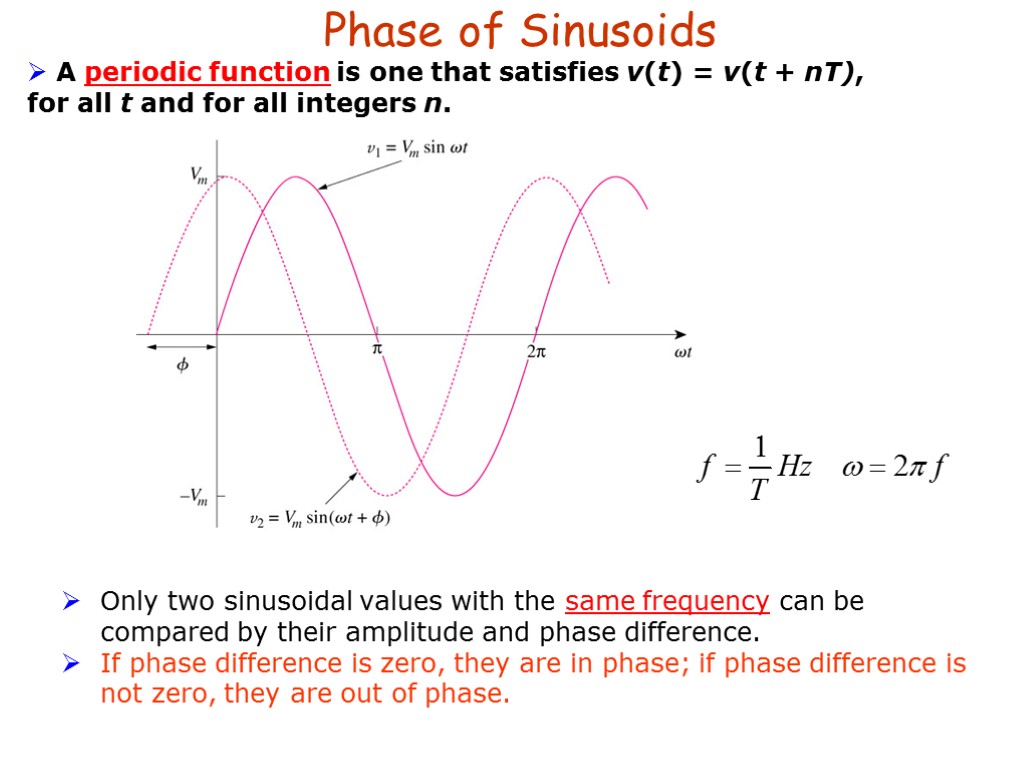
 Phase of Sinusoids A periodic function is one that satisfies v(t) = v(t + nT), for all t and for all integers n. Only two sinusoidal values with the same frequency can be compared by their amplitude and phase difference. If phase difference is zero, they are in phase; if phase difference is not zero, they are out of phase.
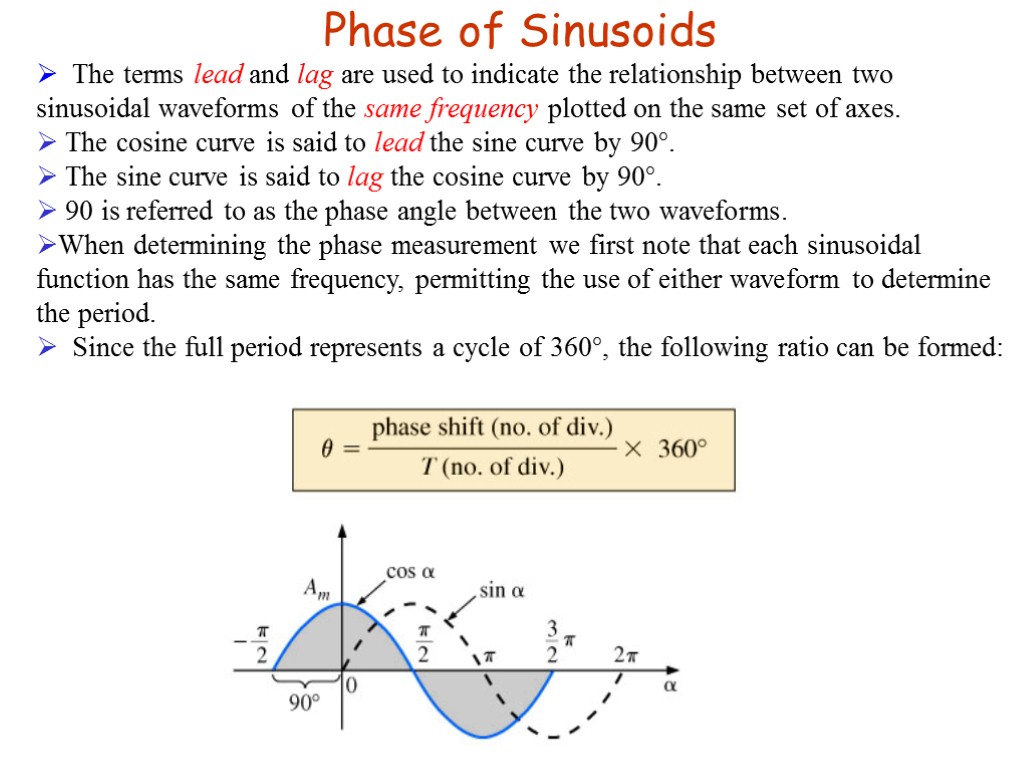
 Phase of Sinusoids The terms lead and lag are used to indicate the relationship between two sinusoidal waveforms of the same frequency plotted on the same set of axes. The cosine curve is said to lead the sine curve by 90°. The sine curve is said to lag the cosine curve by 90°. 90 is referred to as the phase angle between the two waveforms. When determining the phase measurement we first note that each sinusoidal function has the same frequency, permitting the use of either waveform to determine the period. Since the full period represents a cycle of 360°, the following ratio can be formed:
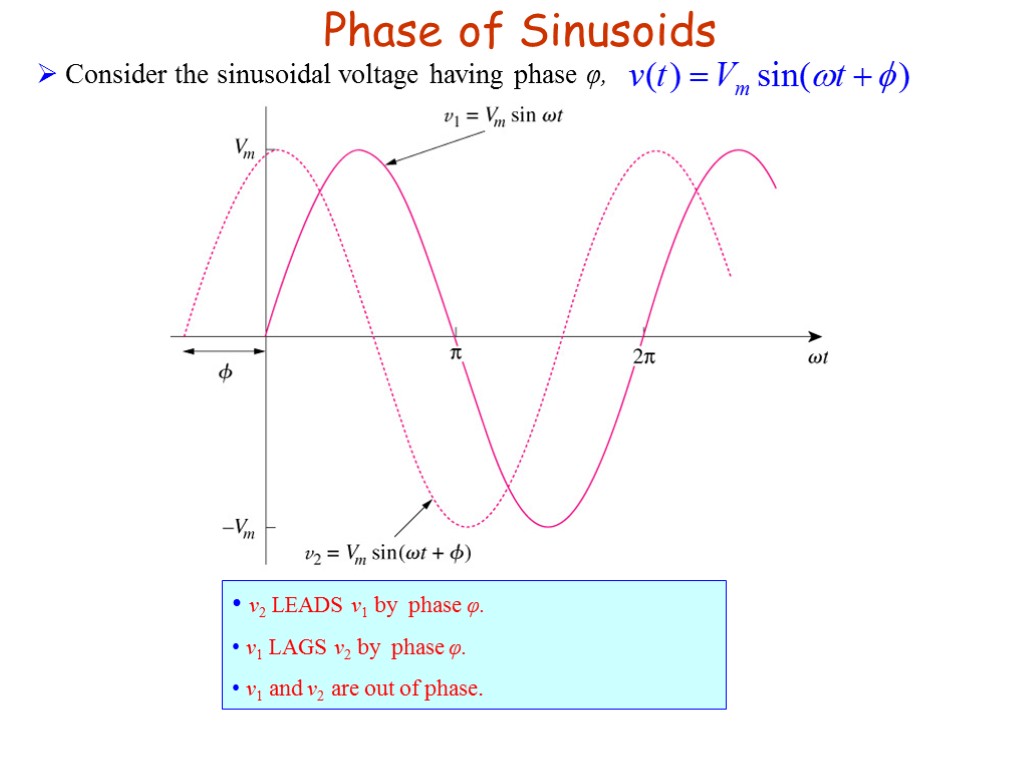
 Phase of Sinusoids Consider the sinusoidal voltage having phase φ, v2 LEADS v1 by phase φ. v1 LAGS v2 by phase φ. v1 and v2 are out of phase.
 (120 V at 60 Hz) versus (220 V at 50 Hz) AC In North and South America the most common available ac supply is 120 V at 60 Hz, while in Europe and the Eastern countries it is 220 V at 50 Hz. Technically there is no noticeable difference between 50 and 60 cycles per second (Hz). The effect of frequency on the size of transformers and the role it plays in the generation and distribution of power was also a factor. The fundamental equation for transformer design is that the size of the transformer is inversely proportional to frequency. A 50 HZ transformer must be larger than a 60 Hz (17% larger) sinusoidal voltage having phase φ. Higher frequencies result in concerns about arcing, increased losses in the transformer core due to eddy current and hysteresis losses, and skin effect phenomena. Larger voltages (such as 220 V) raise safety issues beyond those of 120 V. Higher voltages result in lower current for the same demand, permitting the use of smaller conductors. Motors and power supplies, found in common home appliances and throughout the industrial community, can be smaller in size if supplied with a higher voltage.
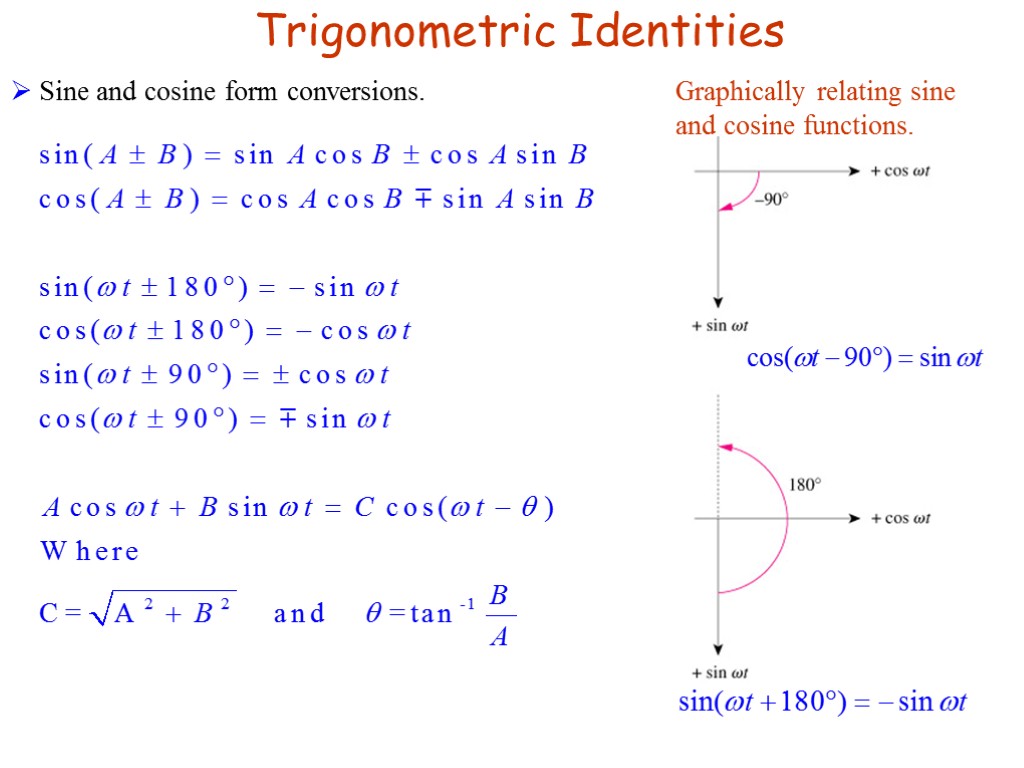
 Trigonometric Identities Sine and cosine form conversions. Graphically relating sine and cosine functions.
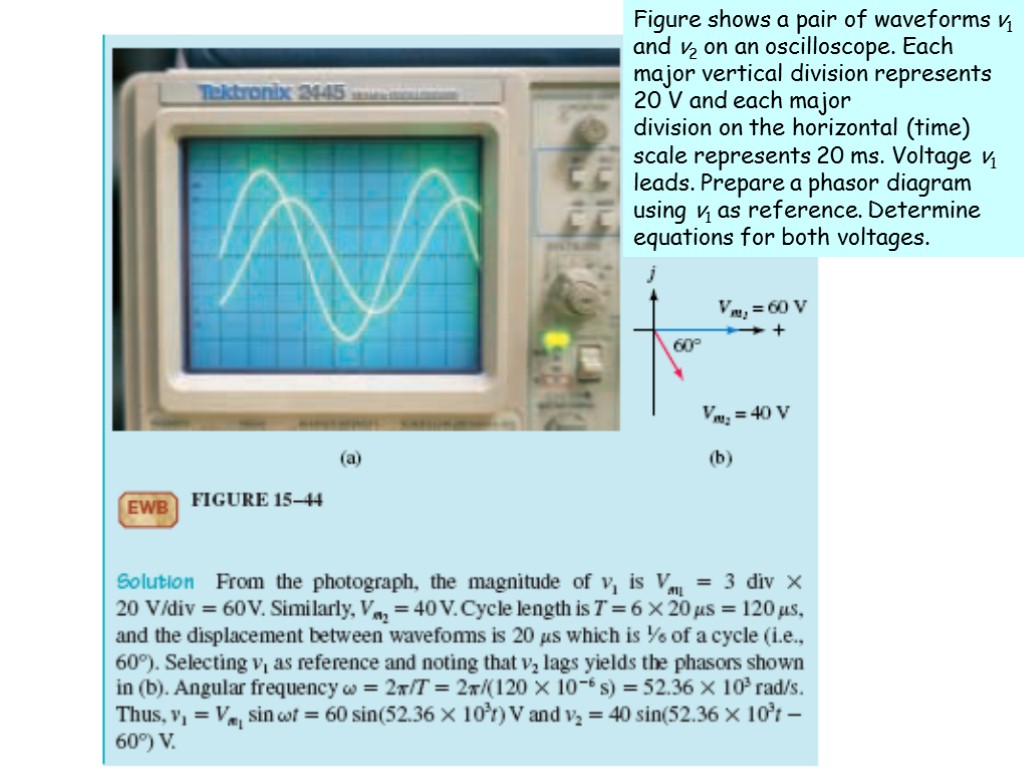
 Figure shows a pair of waveforms v1 and v2 on an oscilloscope. Each major vertical division represents 20 V and each major division on the horizontal (time) scale represents 20 ms. Voltage v1 leads. Prepare a phasor diagram using v1 as reference. Determine equations for both voltages.
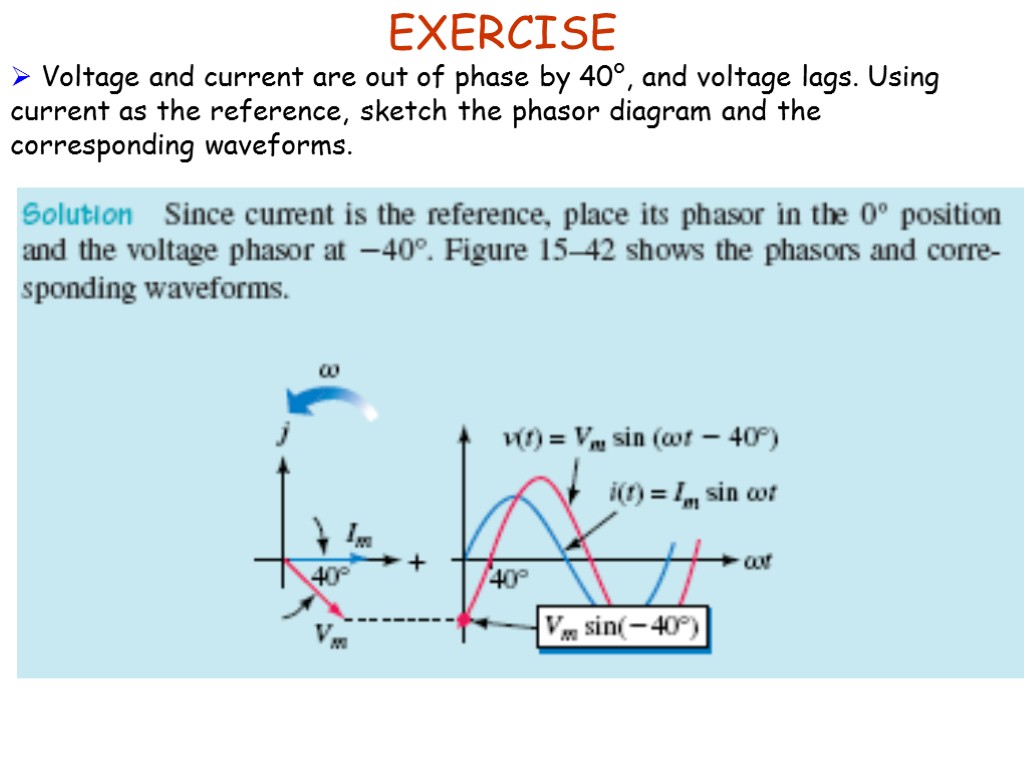
 EXERCISE Voltage and current are out of phase by 40°, and voltage lags. Using current as the reference, sketch the phasor diagram and the corresponding waveforms.
