
FOREIGN EXCHANGE RISK FINANCIAL INSTITUTIONS MANAGEMENT KIMEP


- Размер: 78.5 Кб
- Количество слайдов: 28
Описание презентации FOREIGN EXCHANGE RISK FINANCIAL INSTITUTIONS MANAGEMENT KIMEP по слайдам
FOREIGN EXCHANGE RISK FINANCIAL INSTITUTIONS MANAGEMENT KIMEP
AGENDA: FOREX RISK Sources of foreign exchange risk and FX trading activities; FX risk and hedging: futures, forwards, swaps Estimation of Basis risk Interest rate Parity Theorem
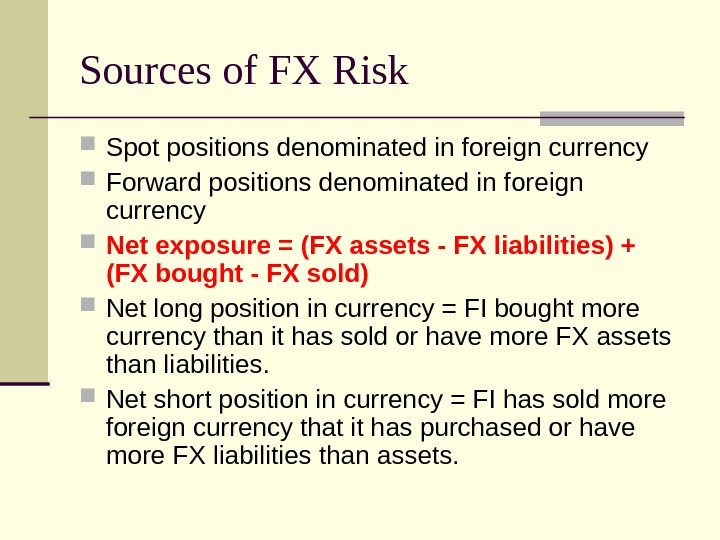
Sources of FX Risk Spot positions denominated in foreign currency Forward positions denominated in foreign currency Net exposure = (FX assets — FX liabilities) + (FX bought — FX sold) Net long position in currency = FI bought more currency than it has sold or have more FX assets than liabilities. Net short position in currency = FI has sold more foreign currency that it has purchased or have more FX liabilities than assets.
Problem 1 Bank has Euro 14 million in assets and Euro 23 million in liabilities and has sold Euro 8 million in foreign currency trading. a) What is the net exposure for the Bank? b) For what type of exchange rate movement does this exposure put the bank at risk?
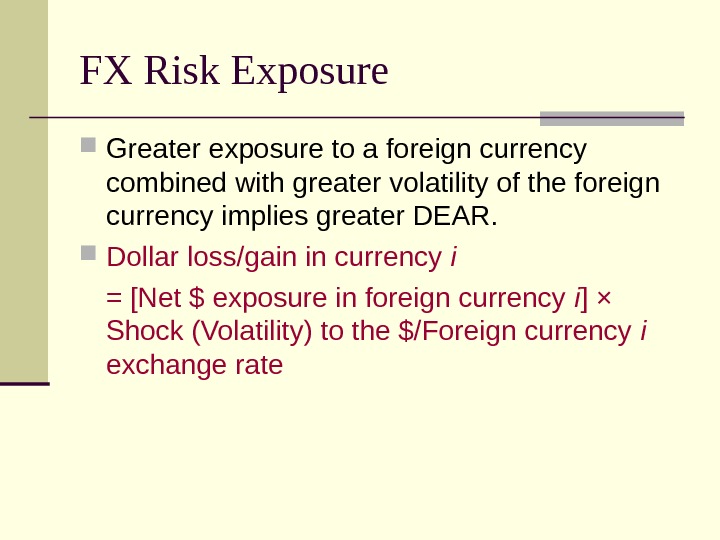
FX Risk Exposure Greater exposure to a foreign currency combined with greater volatility of the foreign currency implies greater DEAR. Dollar loss/gain in currency i = [Net $ exposure in foreign currency i ] × Shock (Volatility) to the $/Foreign currency i exchange rate
Trading Activities Basically 4 trading activities: Purchase and sale of currencies to complete international transactions. Facilitating positions in foreign real and financial investments. Accommodating hedging activities. Speculation.
Foreign Assets & Liabilities Mismatches between foreign asset and liability portfolios. Ability to raise funds from internationally diverse sources presents opportunities as well as risks: Greater competition in well-developed (lower risk) markets.
Return and Risk of Foreign Investments Returns are affected by: Spread between costs and revenues Changes in FX rates are not under the control of the FI
EXAMPLE: FI issued $200 mill one-year CDs at 8% and invested proceeds in one-year US dollar loan (50%) at 9% and one-year sterling loan (50%) at 15%. Spot exchange rate is 1. 6$/ £ $100 mill/1. 6 = £ 62. 5 mill Invest £ 62. 5 mill in loans at 15% The revenue by the end of the year = £ 62. 5 mill x 1. 15% = £ 71. 875 mill Suppose that the spot exchange rate has fallen in value from $1. 6/£ to $1. 45/£ next year, hence £ 71. 875 mill x $1. 45/£ = $104. 22 mill. Return on the investments is 4. 22% The weighted return on the FI’s asset portfolio = 0. 5 x 0. 09 +0. 5 x 0. 0422 = 0. 0661 or 6. 61% that is less than the cost of funds 8%
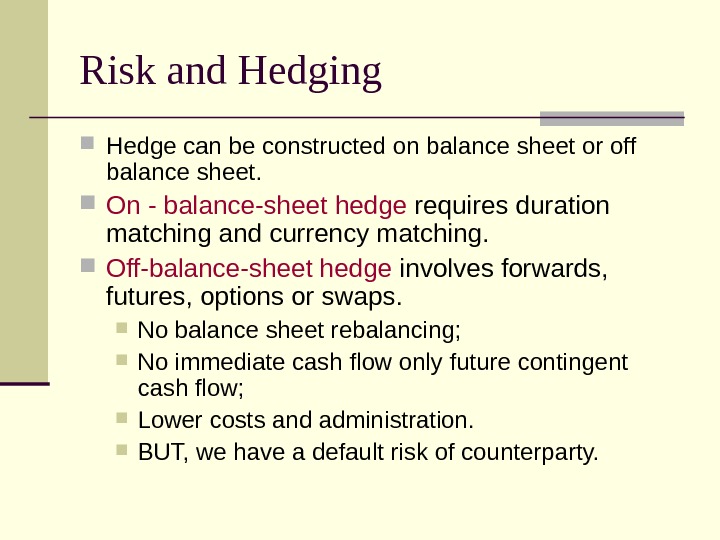
Risk and Hedging Hedge can be constructed on balance sheet or off balance sheet. On — balance-sheet hedge requires duration matching and currency matching. Off-balance-sheet hedge involves forwards, futures, options or swaps. No balance sheet rebalancing; No immediate cash flow only future contingent cash flow; Lower costs and administration. BUT, we have a default risk of counterparty.
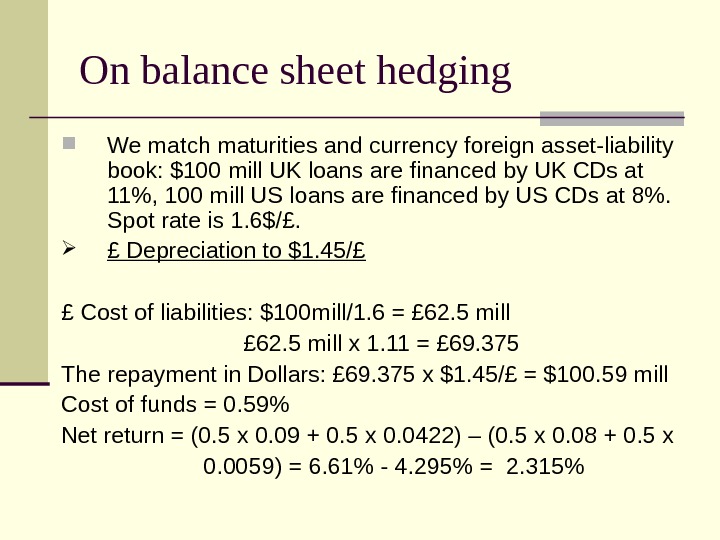
On balance sheet hedging We match maturities and currency foreign asset-liability book: $100 mill UK loans are financed by UK CDs at 11%, 100 mill US loans are financed by US CDs at 8%. Spot rate is 1. 6$/£. £ Depreciation to $1. 45/£ £ Cost of liabilities: $100 mill/1. 6 = £ 62. 5 mill £ 62. 5 mill x 1. 11 = £ 69. 375 The repayment in Dollars: £ 69. 375 x $1. 45/£ = $100. 59 mill Cost of funds = 0. 59% Net return = (0. 5 x 0. 09 + 0. 5 x 0. 0422) – (0. 5 x 0. 08 + 0. 5 x 0. 0059) = 6. 61% — 4. 295% = 2. 315%
£ appreciation to $1. 70/£, the return on British loan is equal to 22. 188% £ Cost of liabilities: $100 mill/1. 6 = £ 62. 5 mill £ 62. 5 mill x 1. 11 = £ 69. 375 The repayment in Dollars: £ 69. 375 x $1. 70/£ = $117. 94 mill Cost of funds = 17. 94% Net return = (0. 5 x 0. 09 +0. 5 x 0. 22188) – (0. 5 x 0. 08 + 0. 5 x 0. 1794) = 15. 59% — 12. 969% = 2. 625% By directly matching its foreign asset and liability book, FI lock in an positive return or profit spread whichever direction the exchange rates change over investment period. On balance sheet hedging
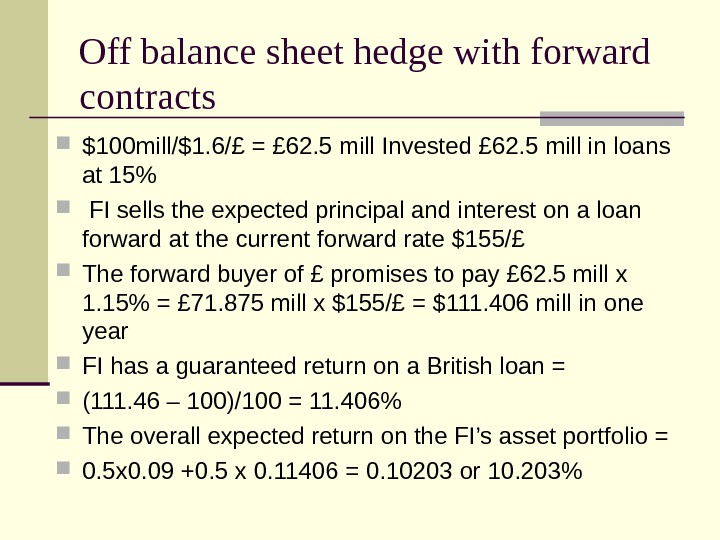
Off balance sheet hedge with forward contracts $100 mill/$1. 6/£ = £ 62. 5 mill Invested £ 62. 5 mill in loans at 15% FI sells the expected principal and interest on a loan forward at the current forward rate $155/£ The forward buyer of £ promises to pay £ 62. 5 mill x 1. 15% = £ 71. 875 mill x $155/£ = $111. 406 mill in one year FI has a guaranteed return on a British loan = (111. 46 – 100)/100 = 11. 406% The overall expected return on the FI’s asset portfolio = 0. 5 x 0. 09 +0. 5 x 0. 11406 = 0. 10203 or 10. 203%
Specifications of the FX futures Six months in the March quarterly cycle (Mar, Jun, Sep, Dec) Physical delivery Last trading day: 9: 16 a. m. Central Time (CT) on the second business day immediately preceding the third Wednesday of the contract month (usually Monday). Currency Contract size JPY/USD 12 500 000 Euro/USD 31 500 BP/USD 62 500 SFr/USD 125 000 AUD/US
Hedging with futures. What is your risk if you have a long position in FX futures? A. Foreign currency appreciation B. Foreign currency depreciation
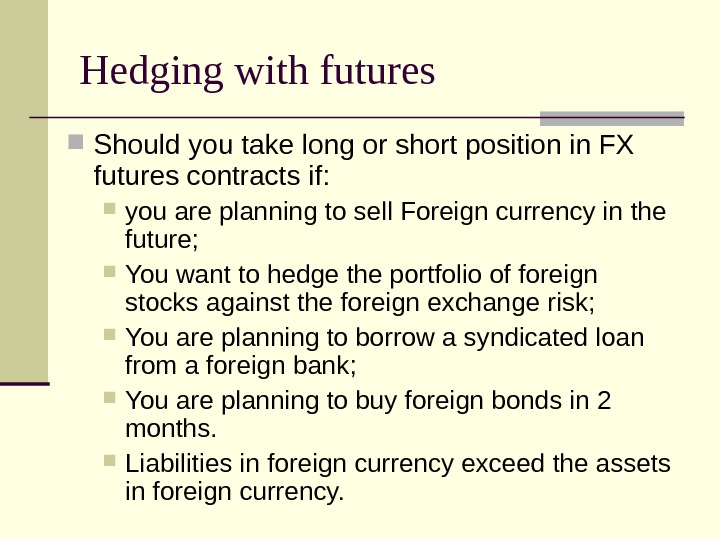
Hedging with futures Should you take long or short position in FX futures contracts if: you are planning to sell Foreign currency in the future; You want to hedge the portfolio of foreign stocks against the foreign exchange risk; You are planning to borrow a syndicated loan from a foreign bank; You are planning to buy foreign bonds in 2 months. Liabilities in foreign currency exceed the assets in foreign currency.
Hedging with futures Futures market does not allow to institute a long-term one-year hedge usually due to defined maturity (4 times per year). So we need to rollover the futures positions into new futures contracts. EXAMPLE: Suppose that FI made a £ 100 mill loan at 15% and wished to hedge fully the risk of £ depreciation. The spot exchange rate is $1. 47/£ and forward exchange rate is $1. 46/£ The size of each £ futures contract is £ 62500, therefore, the number of contracts needed: Nf = £ 115 mill / £ 62500 = 1840 contracts to be sold.
Example (continued) Suppose that by the end of the year the £ depreciates against the $ from $1. 47/£ to $1. 42/£ at the spot market and from $1. 46/£ to $1. 41/£ at the forward market. Loss on the £ loan: £ 115 mill x ($1. 47/£ — $1. 42/£) = $5. 75 mill Gain on futures contracts: 1840 x £ 62500 x ($1. 46/£ — $1. 41/£) = $5. 75 mill In this example we ignore the marking to market effect and the basis risk: If spot and futures prices are not perfectly correlated, then basis risk remains. Tailing the hedge Interest income effects of marking to market allows hedger to reduce number of futures contracts that must be sold to hedge
Basis Risk Suppose we have a basis risk: S = — 5 c and F = -3 c Loss on the £ loan: £ 115 mill x ($1. 47/£ — $1. 42/£) = $5. 75 mill Gain on futures contracts: 1840 x £ 62500 x ($1. 46/£ — $1. 43/£) = $3. 45 mill Net Loss = 5. 75 — 3. 45 = 2. 3 mill In order to adjust for basis risk we apply the hedge ratio: h = S t / ft N f = (Long asset position × h)/(size of one contract).
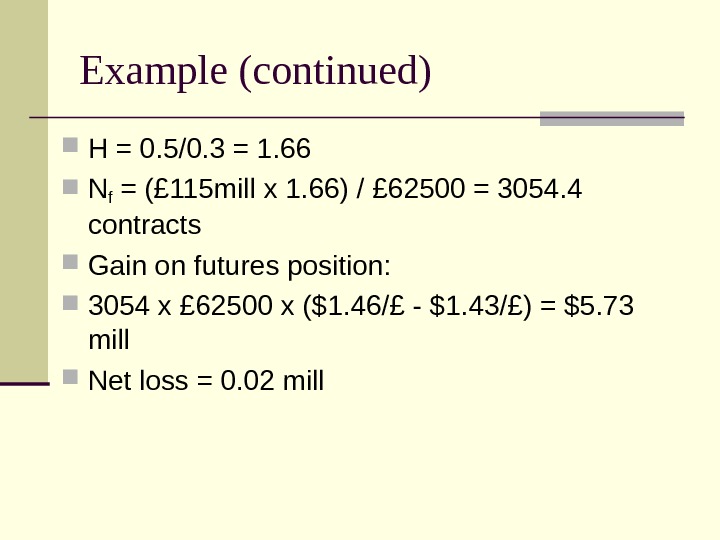
Example (continued) H = 0. 5/0. 3 = 1. 66 Nf = (£ 115 mill x 1. 66) / £ 62500 = 3054. 4 contracts Gain on futures position: 3054 x £ 62500 x ($1. 46/£ — $1. 43/£) = $5. 73 mill Net loss = 0. 02 mill
Estimating the Hedge Ratio Look at recent past behavior of St relative to Ft. The h may be estimated using ordinary least squares regression: S t = + ft + ut The hedge ratio, h, will be equal to the coefficient . The R 2 from the regression reveals the effectiveness of the hedge. R 2 = p 2 = [Cov( St, Ft )]/ [ δSt δ Ft ]
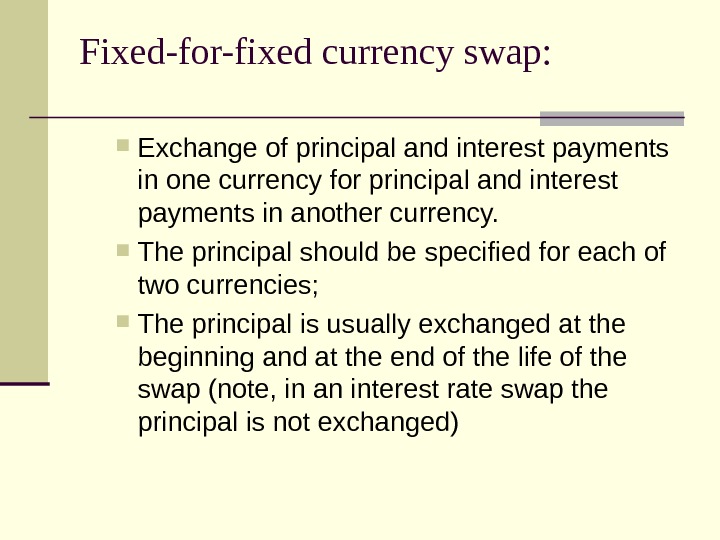
Fixed-for-fixed currency swap: Exchange of principal and interest payments in one currency for principal and interest payments in another currency. The principal should be specified for each of two currencies; The principal is usually exchanged at the beginning and at the end of the life of the swap (note, in an interest rate swap the principal is not exchanged)
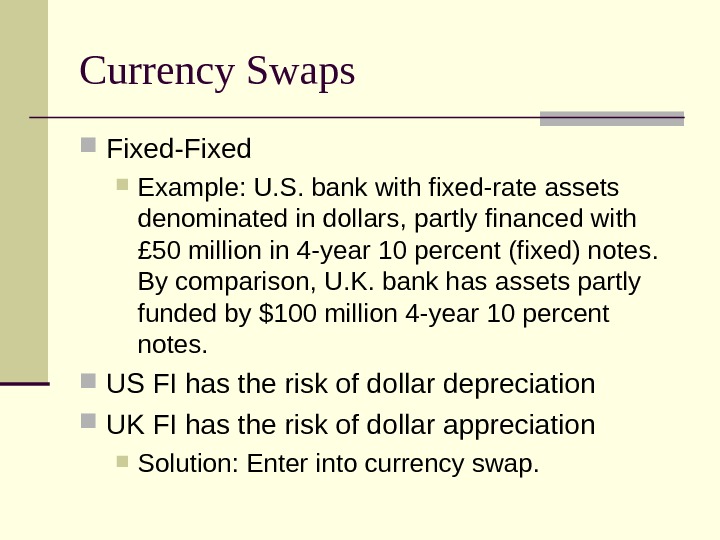
Currency Swaps Fixed-Fixed Example: U. S. bank with fixed-rate assets denominated in dollars, partly financed with £ 50 million in 4 -year 10 percent (fixed) notes. By comparison, U. K. bank has assets partly funded by $100 million 4 -year 10 percent notes. US FI has the risk of dollar depreciation UK FI has the risk of dollar appreciation Solution: Enter into currency swap.
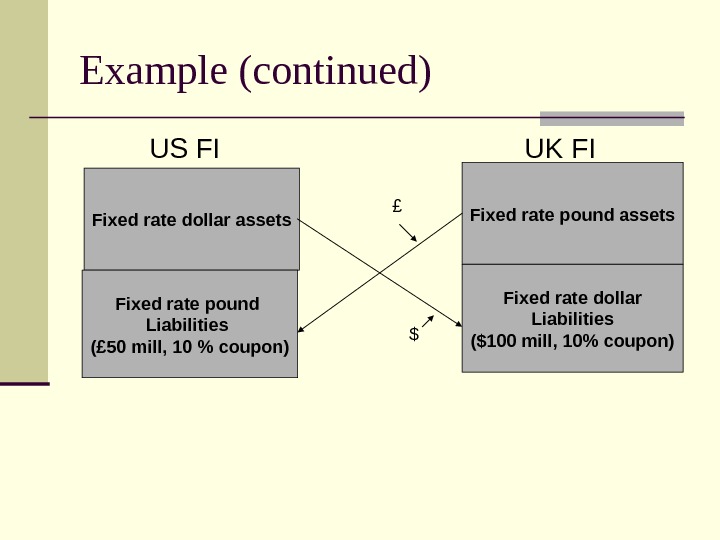
Example (continued) US FI UK FI Fixed rate dollar assets Fixed rate pound Liabilities (£ 50 mill, 10 % coupon) Fixed rate pound assets Fixed rate dollar Liabilities ($100 mill, 10% coupon)£ $
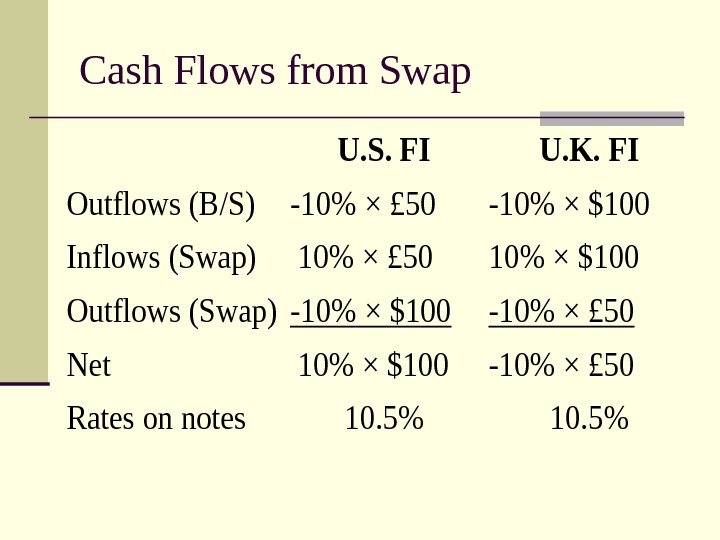
Cash Flows from Swap. U. S. FIU. K. FI Outflows (B/S)-10% × £ 50 -10% × $100 Inflows (Swap) 10% × £ 5010% × $100 Outflows (Swap)-10% × $100 -10% × £ 50 Net 10% × $100 -10% × £ 50 Rates on notes 10. 5%
Fixed-Floating + Currency Fixed-Floating currency swaps. Allows hedging of interest rate and currency exposures simultaneously Example: FIs make payments at some prearrange $/£ exchange rate ($2/£)
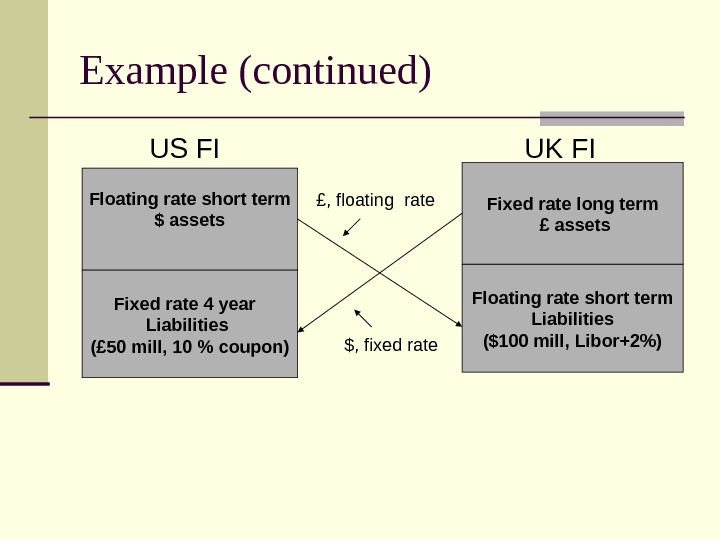
Example (continued) US FI UK FI Floating rate short term $ assets Fixed rate 4 year Liabilities (£ 50 mill, 10 % coupon) Fixed rate long term £ assets Floating rate short term Liabilities ($100 mill, Libor+2%)£, floating rate $, fixed rate
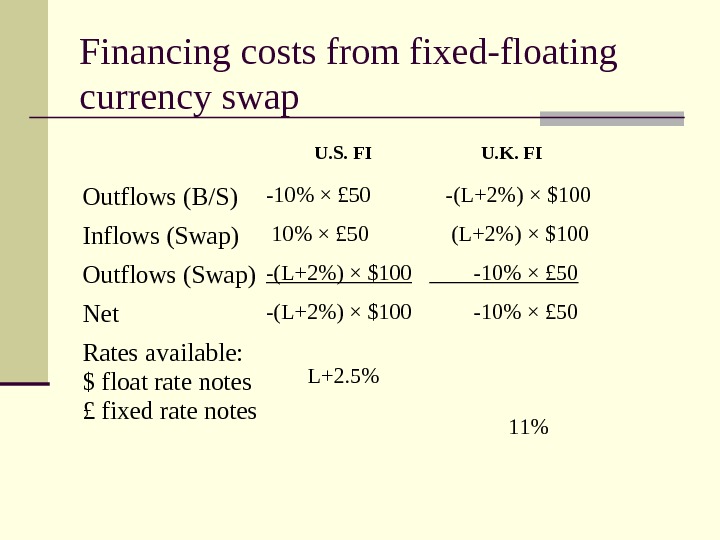
Financing costs from fixed-floating currency swap U. S. FI U. K. FI Outflows (B/S) -10% × £ 50 -(L+2%) × $100 Inflows (Swap) 10% × £ 50 (L+2%) × $100 Outflows (Swap) -(L+2%) × $100 -10% × £ 50 Net -(L+2%) × $100 -10% × £ 50 Rates available: $ float rate notes £ fixed rate notes L+2. 5% 11%