
Forecasting Solutions Project Process Details Sales Forecast System

forecasting_solutions.ppt
- Размер: 1.4 Mегабайта
- Количество слайдов: 7
Описание презентации Forecasting Solutions Project Process Details Sales Forecast System по слайдам
Forecasting Solutions Project Process Details Sales Forecast System
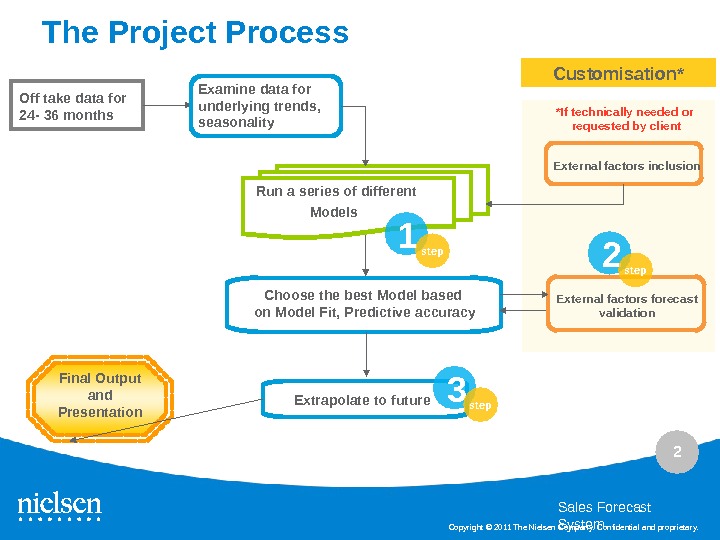
2 Copyright © 2011 The Nielsen Company. Confidential and proprietary. The Project Process Off take data for 24 — 36 months Examine data for underlying trends, seasonality Run a series of different Models Final Output and Presentation External factors inclusion Choose the best Model based on Model Fit, Predictive accuracy Extrapolate to future External factors forecast validation*If technically needed or requested by client. Customisation* 1 step 2 step 3 step Sales Forecast System
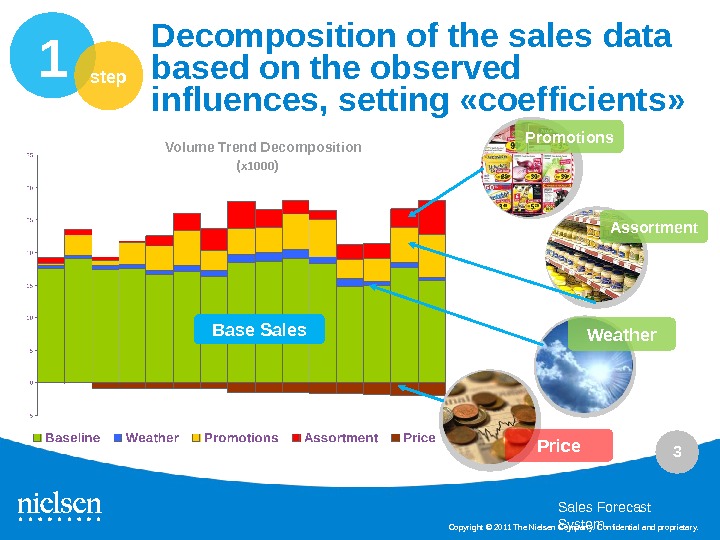
3 Copyright © 2011 The Nielsen Company. Confidential and proprietary. Decomposition of the sales data based on the observed influences, setting «coefficients» 1 step Base Sales. Volume Trend Decomposition ( x 1000 ) Assortment. Promotions Weather Price Sales Forecast System
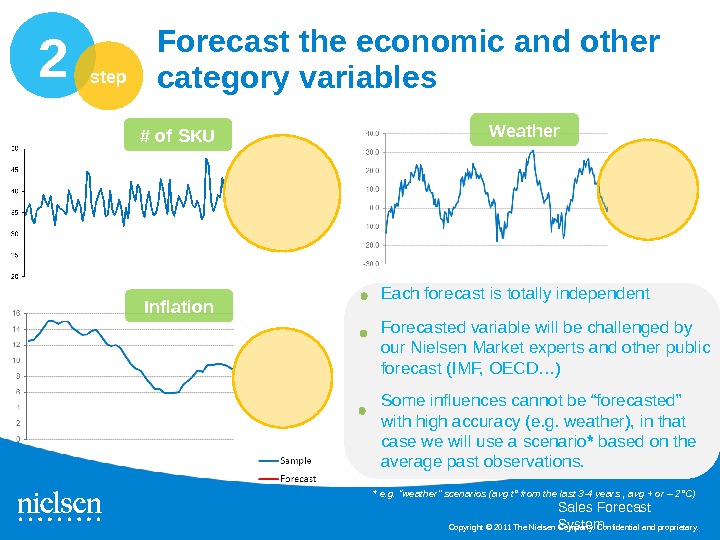
4 Copyright © 2011 The Nielsen Company. Confidential and proprietary. * e. g. “weather” scenarios (avg t° from the last 3 -4 years , avg + or – 2°C)Forecast the economic and other category variables 2 step Inflation Each forecast is totally independent Forecasted variable will be challenged by our Nielsen Market experts and other public forecast (IMF, OECD…) Some influences cannot be “forecasted” with high accuracy (e. g. weather), in that case we will use a scenario * based on the average past observations. # of SKU Weather Sales Forecast System
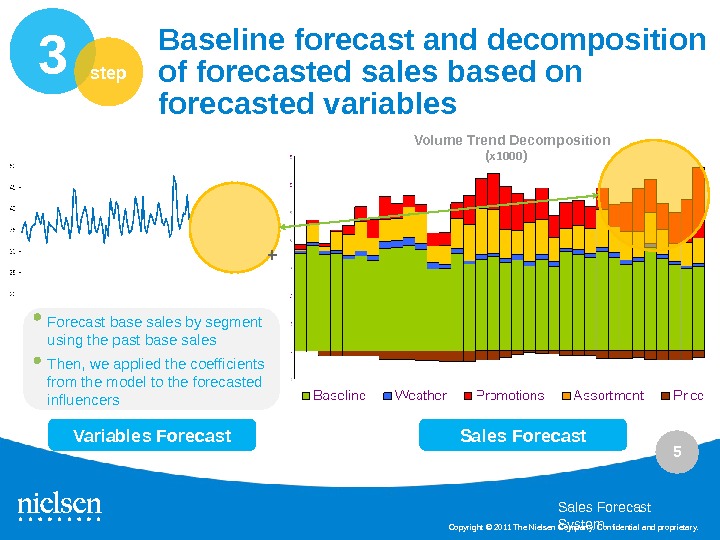
5 Copyright © 2011 The Nielsen Company. Confidential and proprietary. Sales Forecast. Variables Forecast base sales by segment using the past base sales Then, we applied the coefficients from the model to the forecasted influencers Volume Trend Decomposition ( x 1000 )Baseline forecast and decomposition of forecasted sales based on forecasted variables 3 step + Sales Forecast System
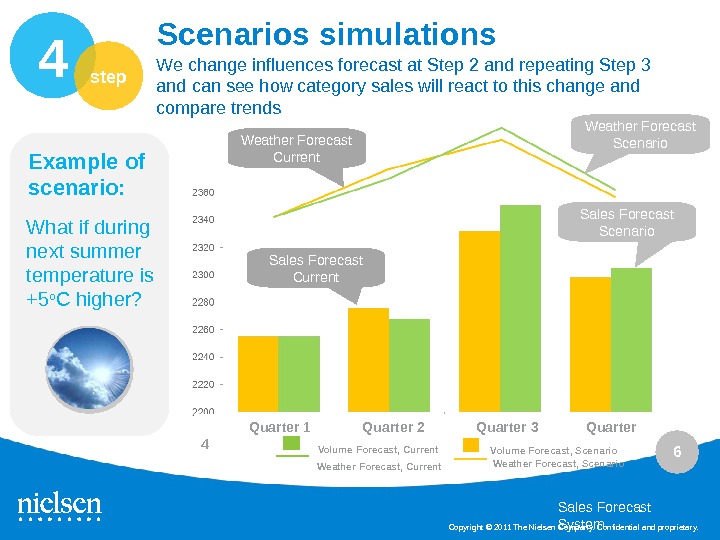
6 Copyright © 2011 The Nielsen Company. Confidential and proprietary. Scenarios simulations 4 step We change influences forecast at Step 2 and repeating Step 3 and can see how category sales will react to this change and compare trends What if during next summer temperature is +5 o C higher? Example of scenario: Weather Forecast Current Sales Forecast Current Weather Forecast Scenario Sales Forecast Scenario Quarter 1 Quarter 2 Quarter 3 Quarter 4 Volume Forecast, Current Volume Forecast, Scenario Weather Forecast, Current Sales Forecast System
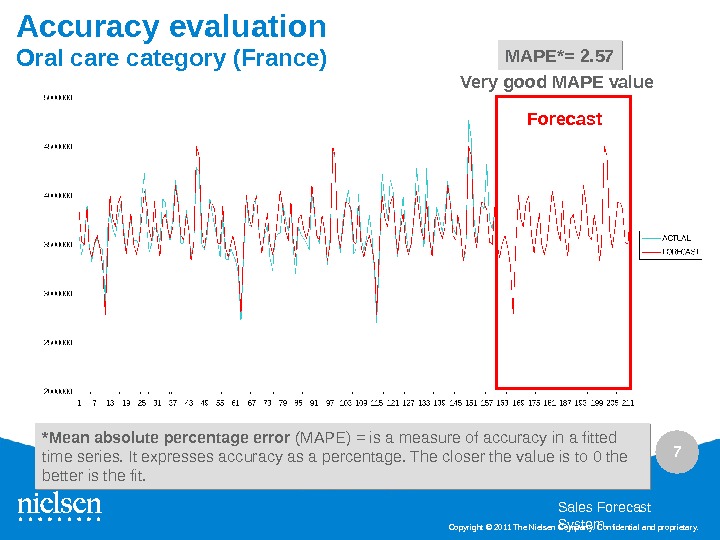
7 Copyright © 2011 The Nielsen Company. Confidential and proprietary. Accuracy evaluation Oral care category (France) MAPE*= 2. 57 Forecast *Mean absolute percentage error (MAPE) = is a measure of accuracy in a fitted time series. It expresses accuracy as a percentage. The closer the value is to 0 the better is the fit. Very good MAPE value Sales Forecast System