Corporate Finance Chapter 4 Chapter 4 Working capital












chapter_4-6.ppt
- Количество слайдов: 106
 Corporate Finance
 Chapter 4 Chapter 4 Working capital
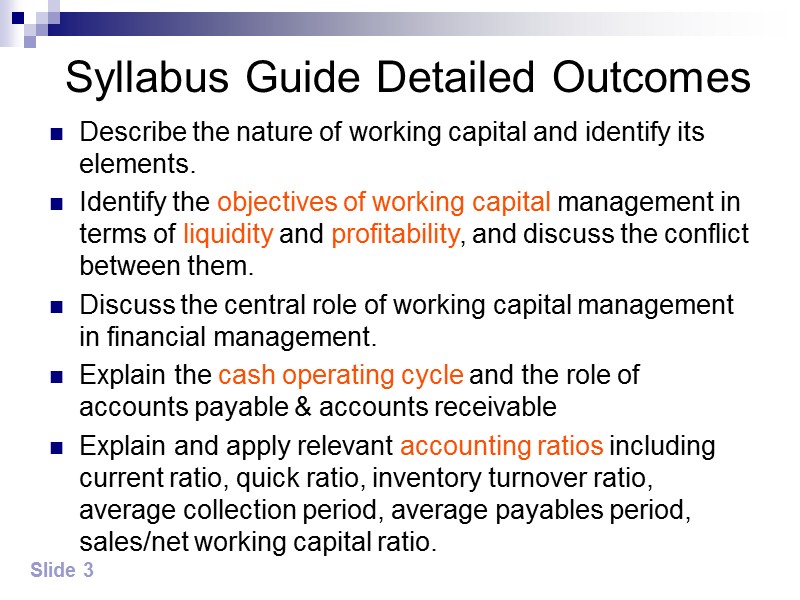
 Syllabus Guide Detailed Outcomes Describe the nature of working capital and identify its elements. Identify the objectives of working capital management in terms of liquidity and profitability, and discuss the conflict between them. Discuss the central role of working capital management in financial management. Explain the cash operating cycle and the role of accounts payable & accounts receivable Explain and apply relevant accounting ratios including current ratio, quick ratio, inventory turnover ratio, average collection period, average payables period, sales/net working capital ratio. Slide 3
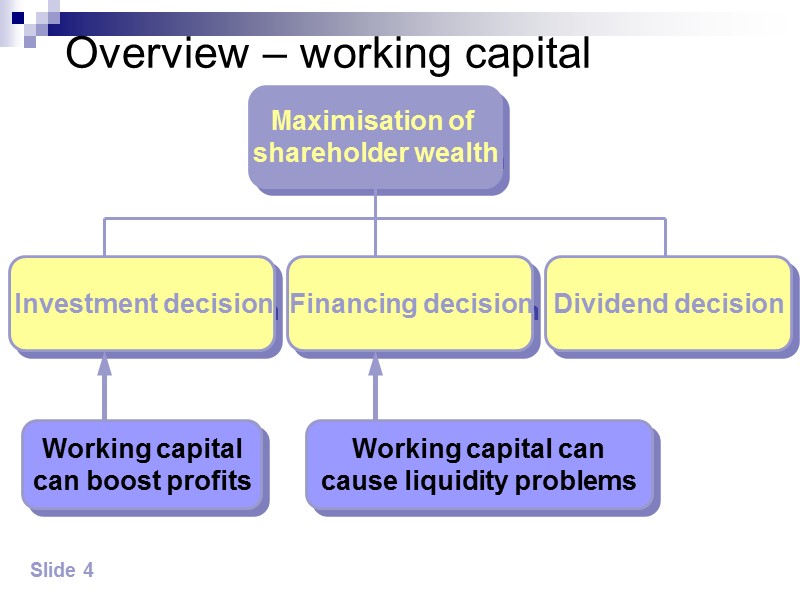
 Slide 4 Overview – working capital Maximisation of shareholder wealth
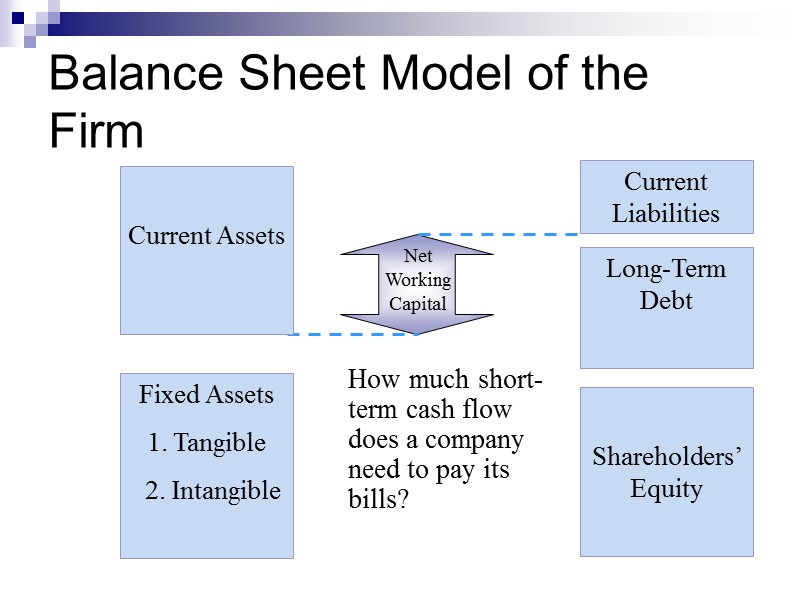
 Balance Sheet Model of the Firm How much short-term cash flow does a company need to pay its bills? Net Working Capital Current Assets Fixed Assets 1. Tangible 2. Intangible Shareholders’ Equity Current Liabilities Long-Term Debt
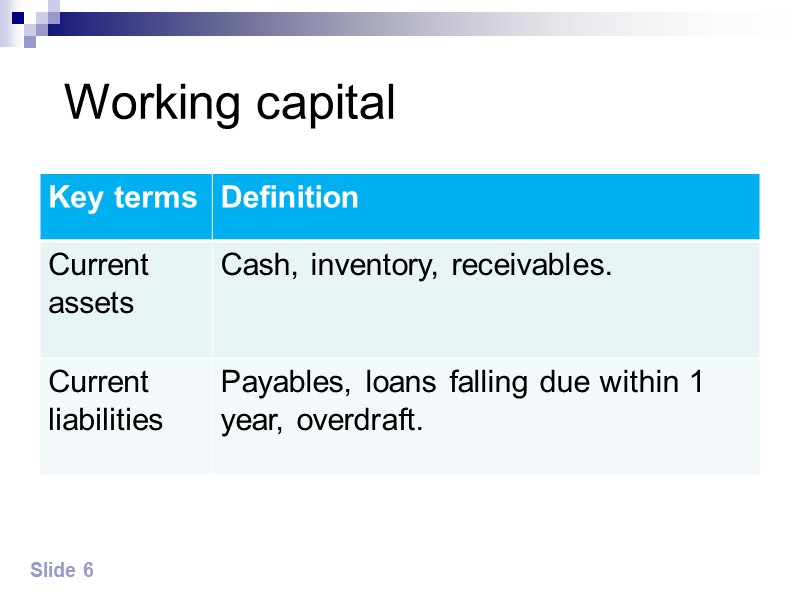
 Working capital Slide 6
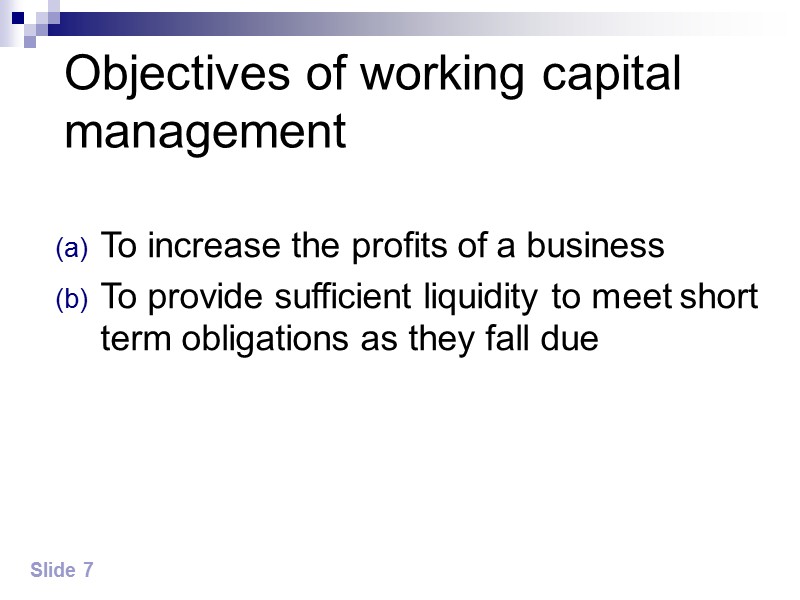
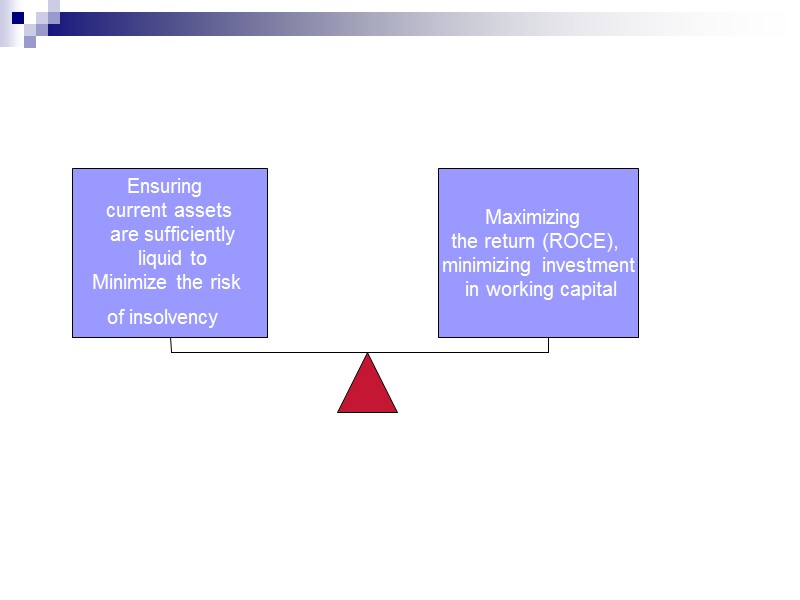
 Objectives of working capital management To increase the profits of a business To provide sufficient liquidity to meet short term obligations as they fall due Slide 7
 Ensuring current assets are sufficiently liquid to Minimize the risk of insolvency Maximizing the return (ROCE), minimizing investment in working capital
 Lecture example 1 Slide 9 Required How can investment in higher levels of inventory or receivables affect profits ? liquidity ?
 Answer to lecture example 1 (a) Profits Higher inventory means greater stock availability & possibly more choice to the customer of different variants of the product and therefore higher sales and higher profits. Higher receivables may mean better payment terms, which may lead to higher sales and this again may lead to higher profits. Slide 10
 Answer to lecture example 1 (a) Liquidity Higher inventory & higher receivables mean more cash tied up in the short term which may lead to cash flow problems. There is sometimes a conflict between these 2 objectives. Slide 11
 There is often a conflict between the two main objectives of working capital management; ie management need to carefully consider the level of investment in working capital and to consider the impact that this is having on a company’s liquidity position; an overview of this is given by the cash operating cycle. Slide 12
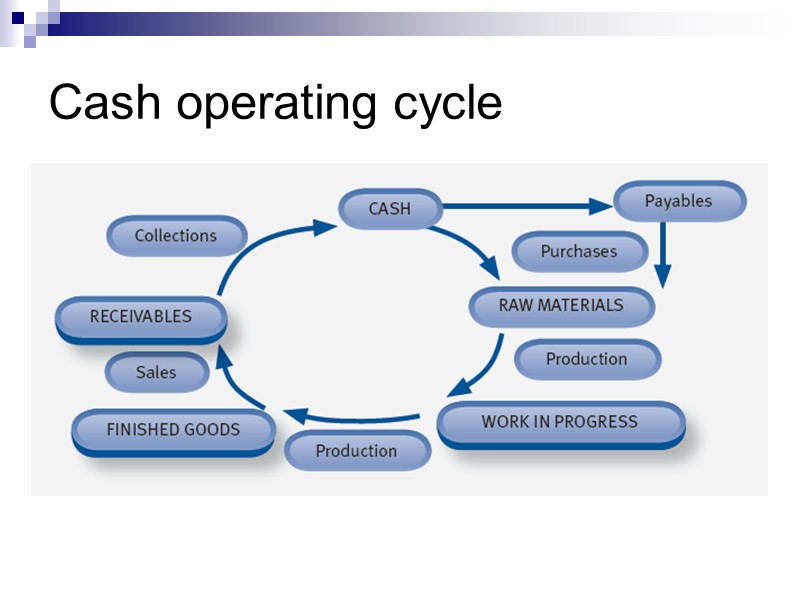
 cash operating cycle The cash operating cycle (also known as the working capital or the cash conversion cycle) is the period of time between the outflow of cash to pay for raw materials and the inflow of cash from customers. Slide 13
 Cash operating cycle
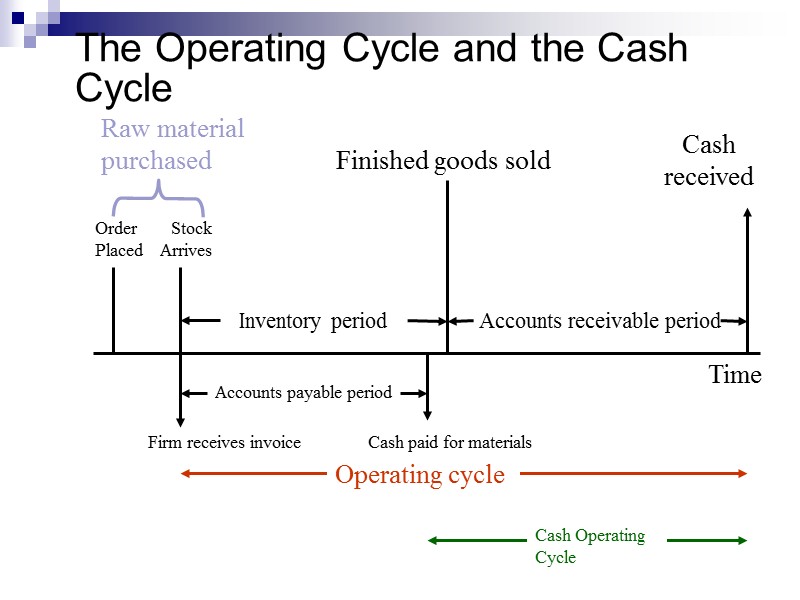
 The Operating Cycle and the Cash Cycle Time Accounts payable period Operating cycle Cash received Finished goods sold Firm receives invoice Cash paid for materials
 Cash operating cycle The length of the cycle = Inventory days + Receivable days – Payables days
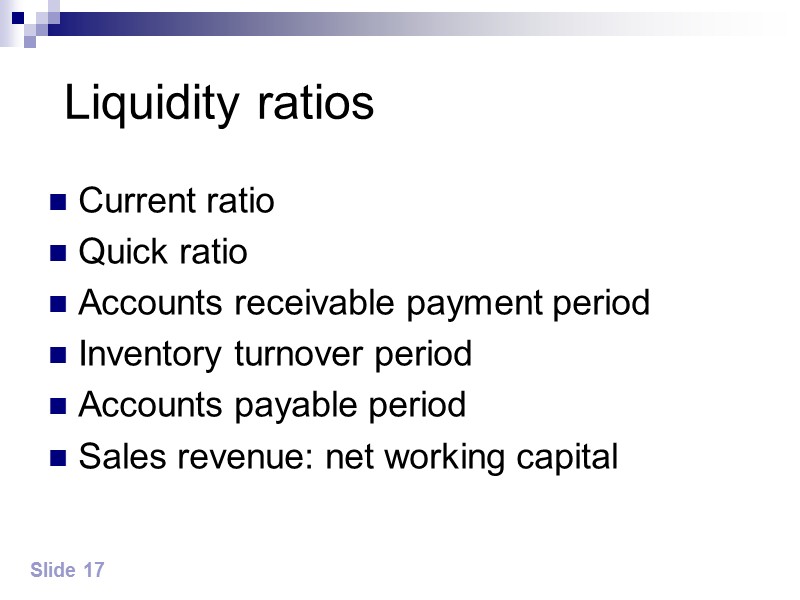
 Slide 17 Liquidity ratios Current ratio Quick ratio Accounts receivable payment period Inventory turnover period Accounts payable period Sales revenue: net working capital
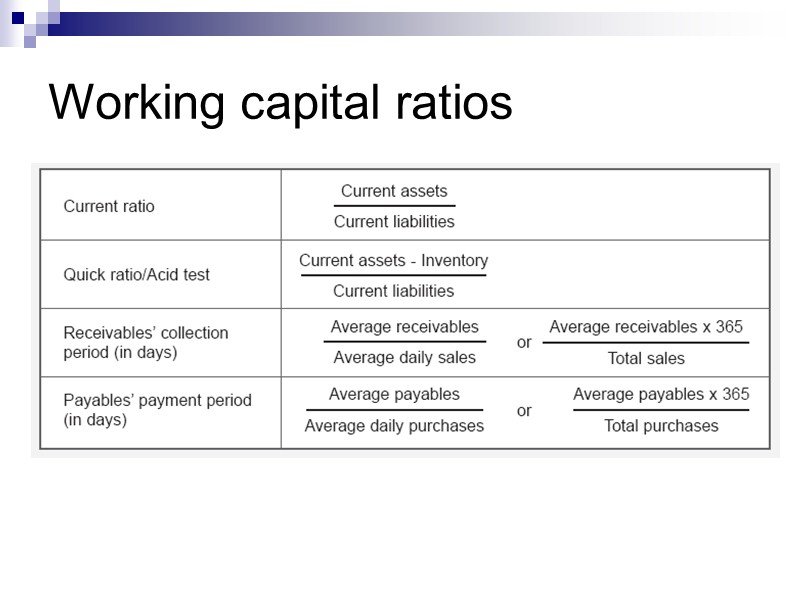
 Working capital ratios
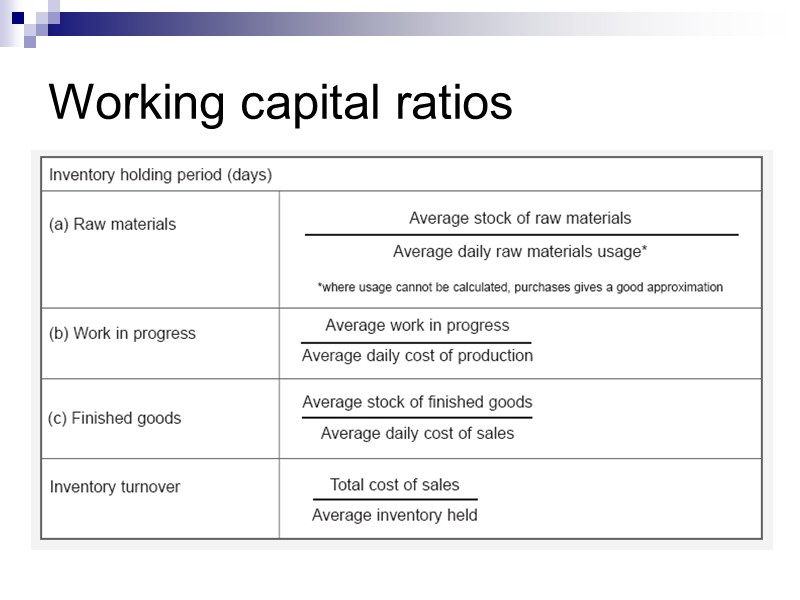
 Working capital ratios
 Calculating the cash operating cycle Av. collection period Inventory days Av. payables period Slide 20 Finished goods W.I.P Raw material Cash operating cycle =
 Lecture example 2 Slide 21 The table below gives information extracted from the annual accounts of Management plc for the past year. Management plc – Extracts from annual accounts
 Lecture example 2 – cont’d Required Calculate the length of the working capital cycle (assuming 365 days in the year). Slide 22
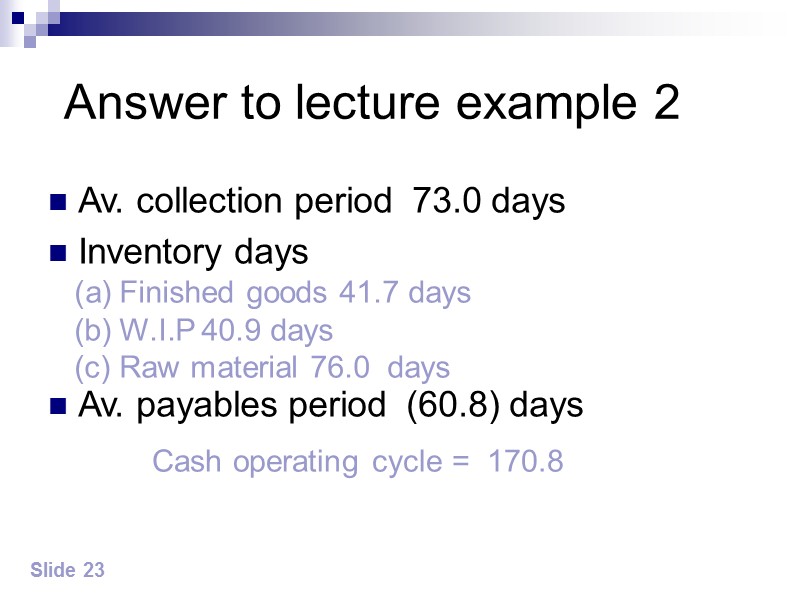
 Answer to lecture example 2 Av. collection period 73.0 days Inventory days Av. payables period (60.8) days Slide 23 Finished goods 41.7 days W.I.P 40.9 days Raw material 76.0 days Cash operating cycle = 170.8
 Forecasting cash flow needs The cash operating cycle can be used to determine the amount of cash needed at any sales level, and to identify the possibility of a cash shortfall if sales rise too rapidly. Referring back to the previous lecture example, we can identify a relationship between sales and cash required by using the sales / net working capital ratio. Slide 24
 Lecture example 3 Required What level of net working capital (ie cash) is needed to support sales, if sales rise by 30% over the next year? Slide 25
 Answer to lecture example 3 £864,000 x 1.3 = £1,123,200 £1,123,200 / 2.42 = £464,132 Slide 26
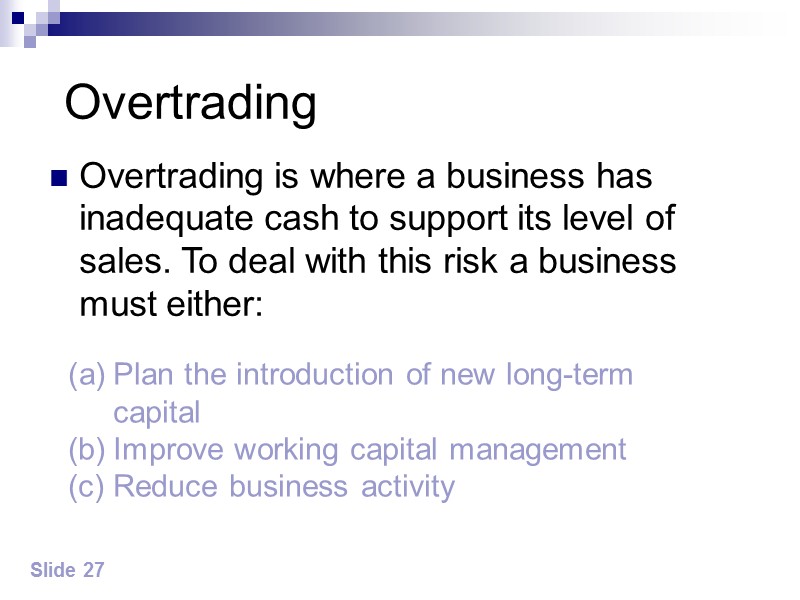
 Overtrading Overtrading is where a business has inadequate cash to support its level of sales. To deal with this risk a business must either: Slide 27 Plan the introduction of new long-term capital Improve working capital management Reduce business activity
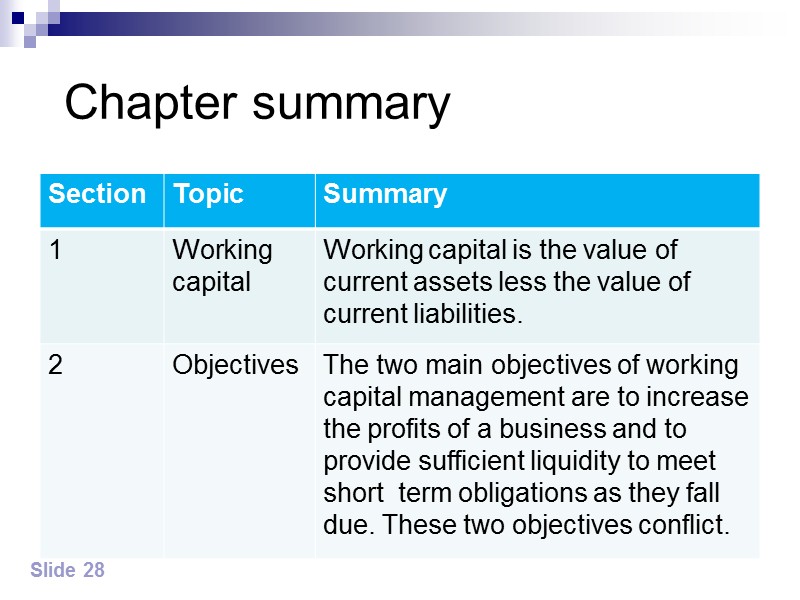
 Chapter summary Slide 28
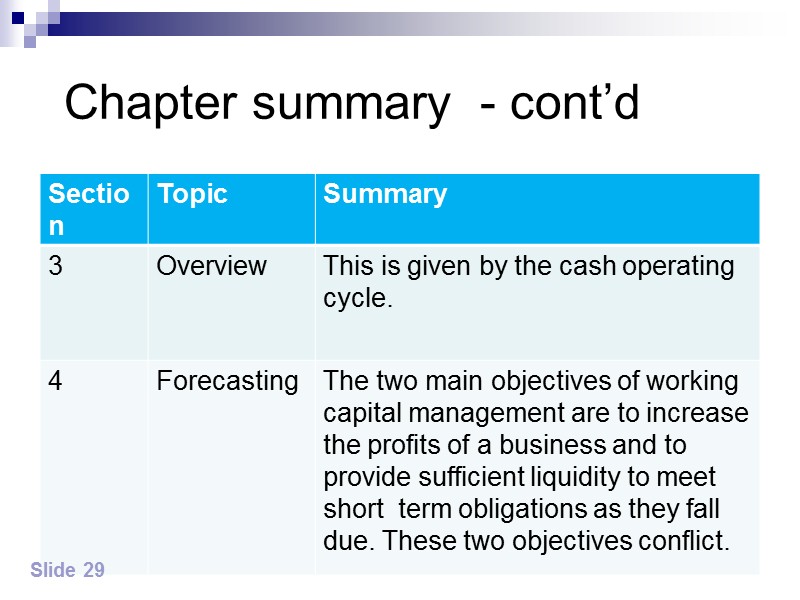
 Chapter summary - cont’d Slide 29
 Chapter 5 Chapter 5 Managing working capital
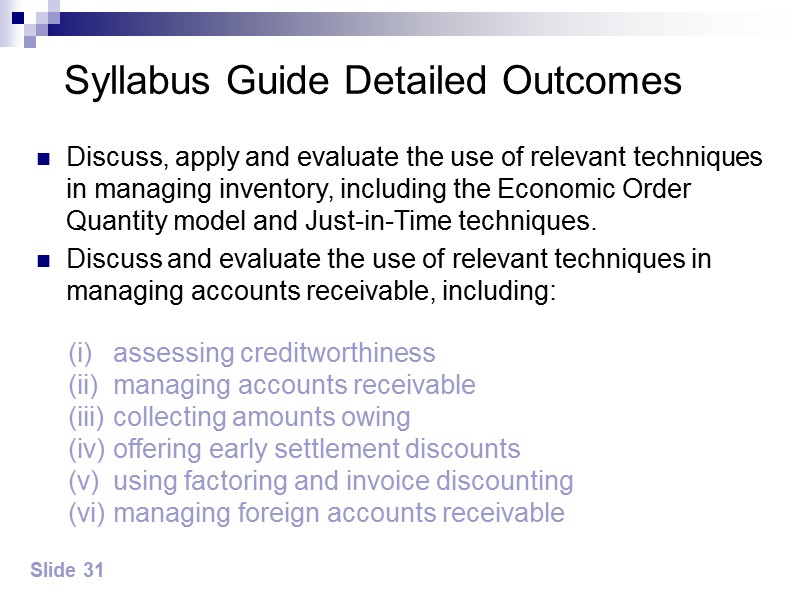
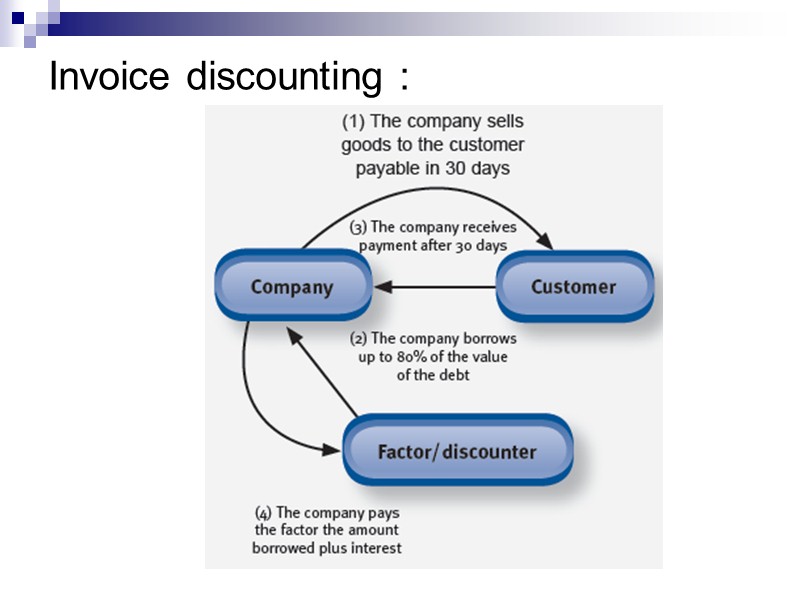
 Syllabus Guide Detailed Outcomes Discuss, apply and evaluate the use of relevant techniques in managing inventory, including the Economic Order Quantity model and Just-in-Time techniques. Discuss and evaluate the use of relevant techniques in managing accounts receivable, including: Slide 31 assessing creditworthiness managing accounts receivable collecting amounts owing offering early settlement discounts using factoring and invoice discounting managing foreign accounts receivable
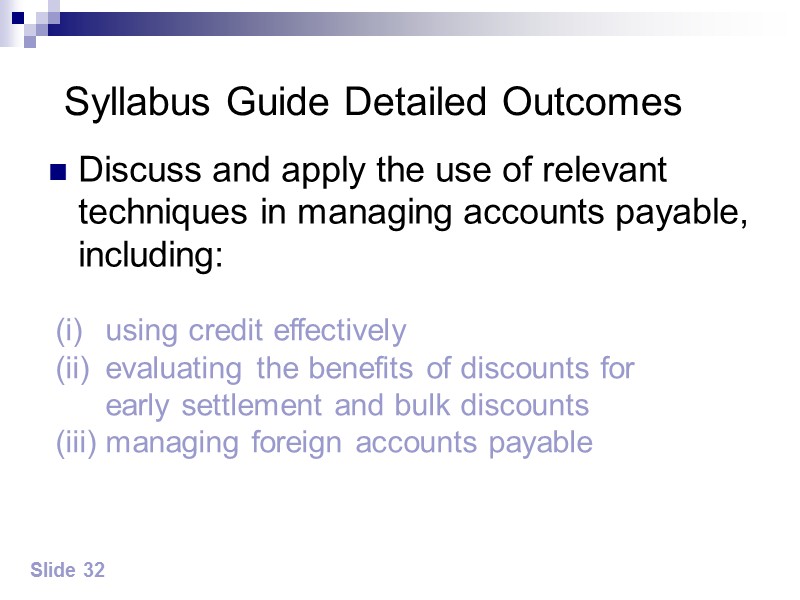
 Syllabus Guide Detailed Outcomes Discuss and apply the use of relevant techniques in managing accounts payable, including: Slide 32 using credit effectively evaluating the benefits of discounts for early settlement and bulk discounts managing foreign accounts payable
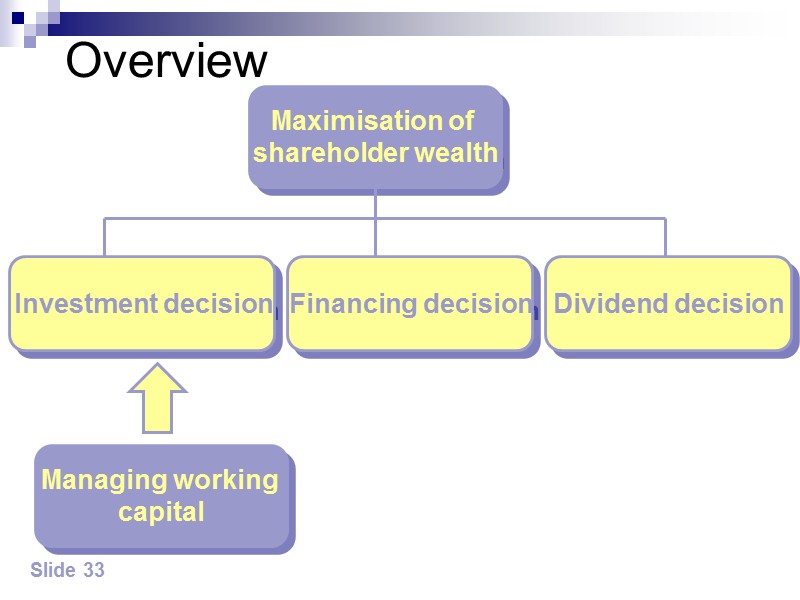
 Overview Slide 33 Maximisation of shareholder wealth Managing working capital
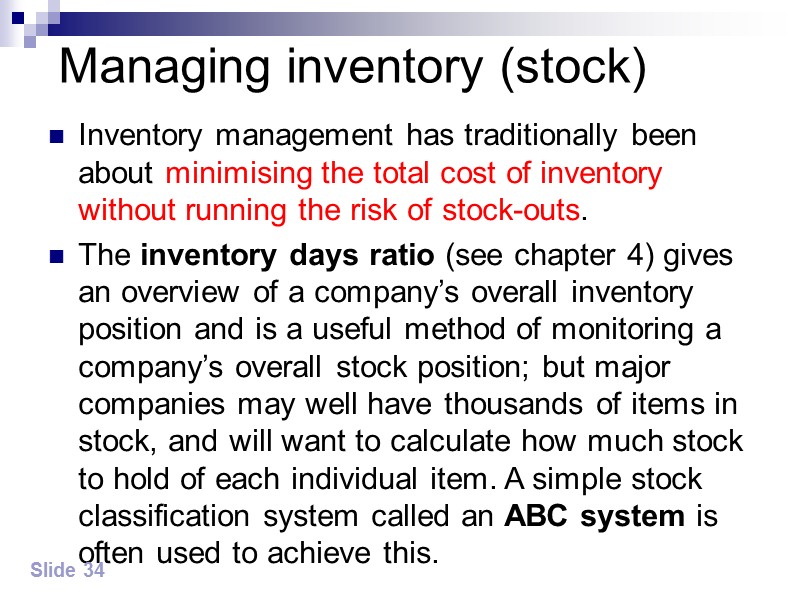
 Managing inventory (stock) Inventory management has traditionally been about minimising the total cost of inventory without running the risk of stock-outs. The inventory days ratio (see chapter 4) gives an overview of a company’s overall inventory position and is a useful method of monitoring a company’s overall stock position; but major companies may well have thousands of items in stock, and will want to calculate how much stock to hold of each individual item. A simple stock classification system called an ABC system is often used to achieve this. Slide 34
 ABC system A – high value stock items, requiring careful stock control using sophisticated methods such as the EOQ method discussed below with regular review and control B – medium value stock items, as above but with less frequent review C – low value stock items, aim to keep a continuous availability Slide 35
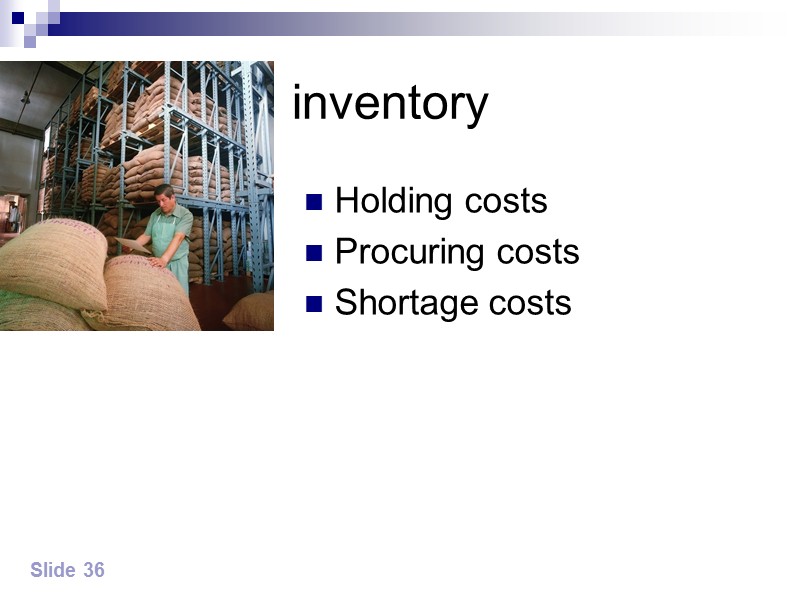
 Slide 36 Managing inventory Holding costs Procuring costs Shortage costs
 Economic order quantity model The order quantity affects a firm’s total inventory costs, these are: Holding costs Ordering costs – admin & delivery costs. Slide 37 Warehouse Insurance Obsolescence Opportunity cost of capital
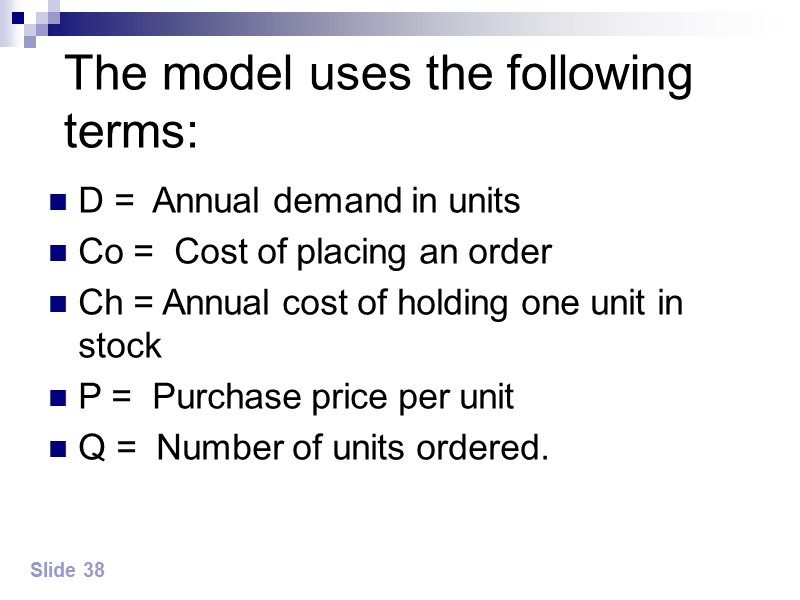
 The model uses the following terms: D = Annual demand in units Co = Cost of placing an order Ch = Annual cost of holding one unit in stock P = Purchase price per unit Q = Number of units ordered. Slide 38
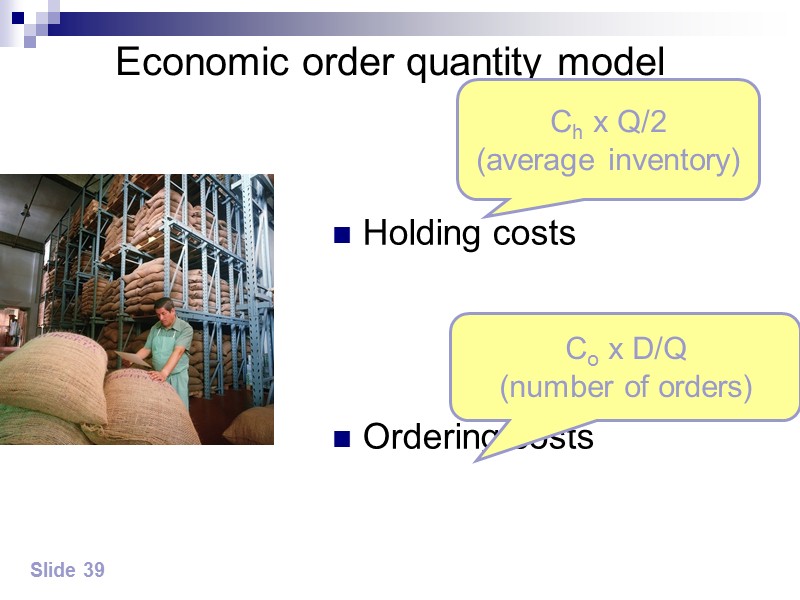
 Slide 39 Economic order quantity model Holding costs Ordering costs Ch x Q/2 (average inventory) Co x D/Q (number of orders)
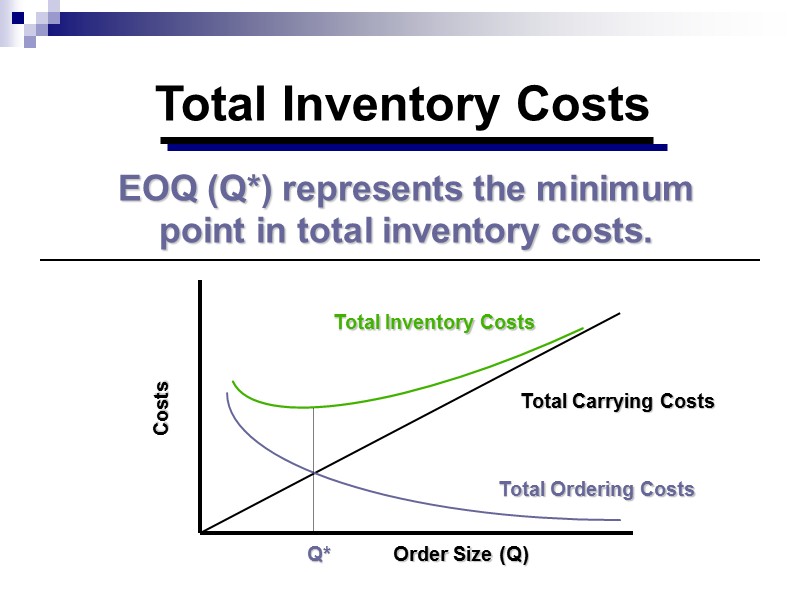
 Total Inventory Costs EOQ (Q*) represents the minimum point in total inventory costs. Total Inventory Costs Total Carrying Costs Total Ordering Costs Q* Order Size (Q) Costs
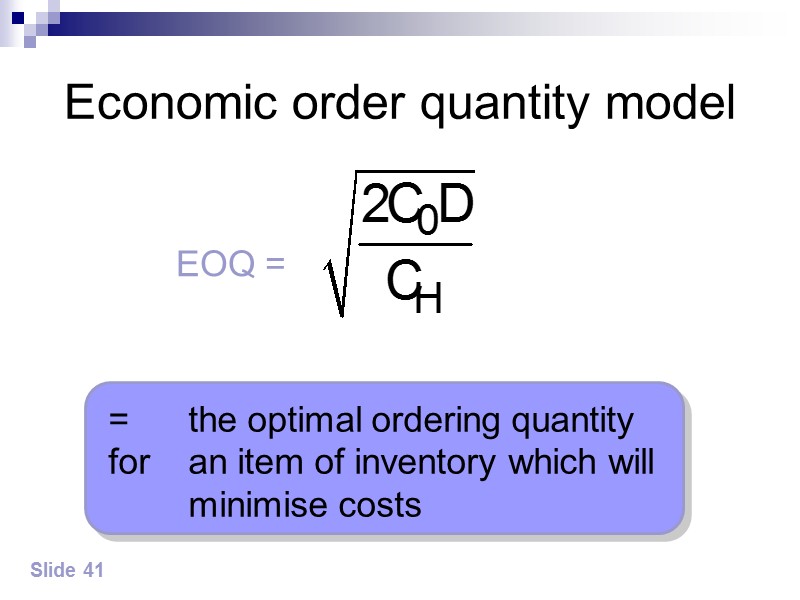
 Slide 41 Economic order quantity model EOQ = = the optimal ordering quantity for an item of inventory which will minimise costs
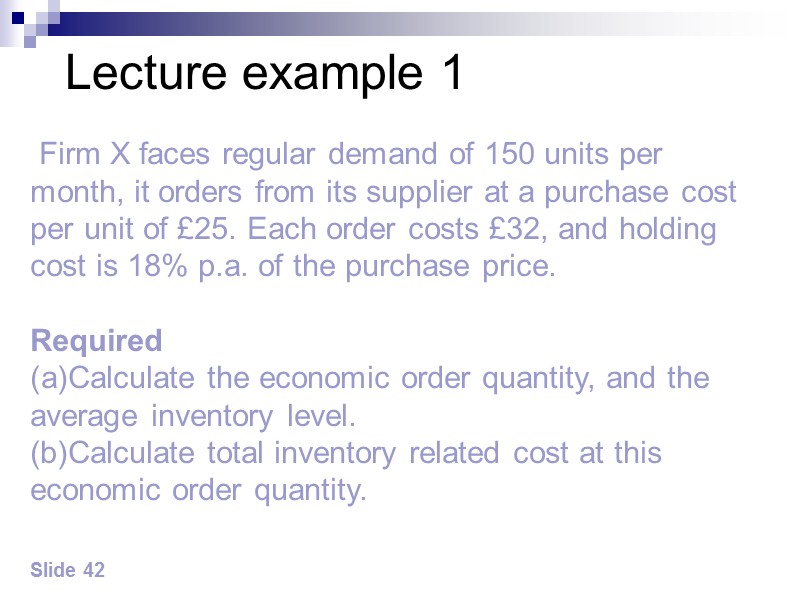
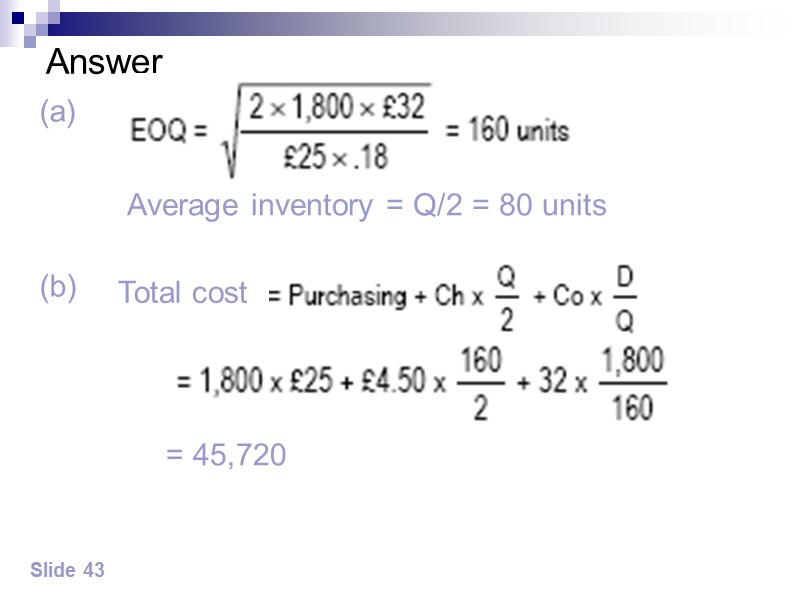
 Lecture example 1 Slide 42 Firm X faces regular demand of 150 units per month, it orders from its supplier at a purchase cost per unit of £25. Each order costs £32, and holding cost is 18% p.a. of the purchase price. Required Calculate the economic order quantity, and the average inventory level. Calculate total inventory related cost at this economic order quantity.
 Answer Slide 43 (a) Average inventory = Q/2 = 80 units (b) Total cost = 45,720
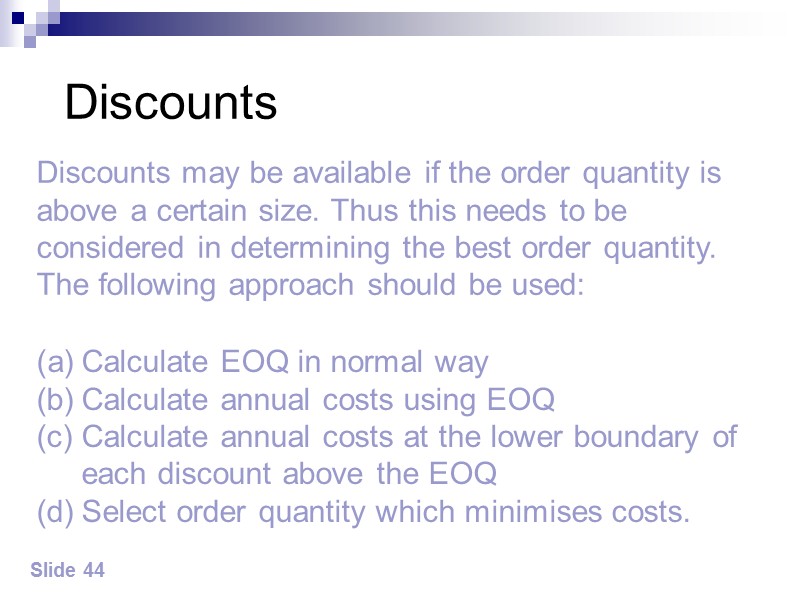
 Discounts Slide 44 Discounts may be available if the order quantity is above a certain size. Thus this needs to be considered in determining the best order quantity. The following approach should be used: Calculate EOQ in normal way Calculate annual costs using EOQ Calculate annual costs at the lower boundary of each discount above the EOQ Select order quantity which minimises costs.
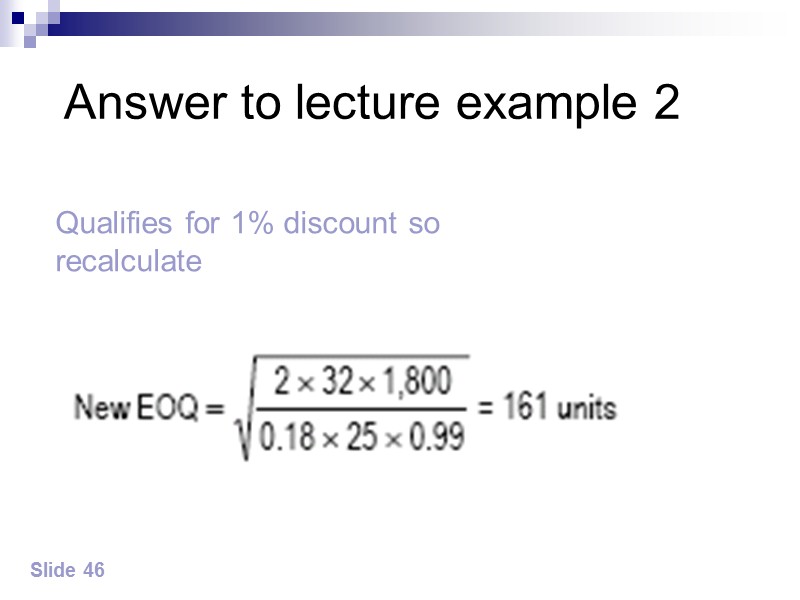
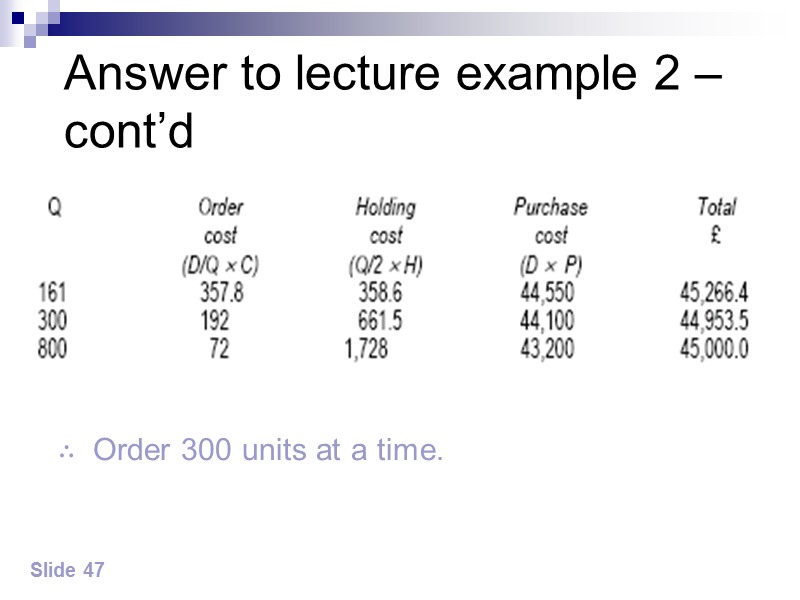
 Lecture example 2 Slide 45 Required Using the same information given in lecture example 1 calculate the minimum total cost assuming the following discount applies: Discount of 1% given on orders of 150 and over Discount of 2% given on orders of 300 and over Discount of 4% given on orders of 800 and over.
 Answer to lecture example 2 Slide 46 Qualifies for 1% discount so recalculate
 Answer to lecture example 2 – cont’d Slide 47 ∴ Order 300 units at a time.
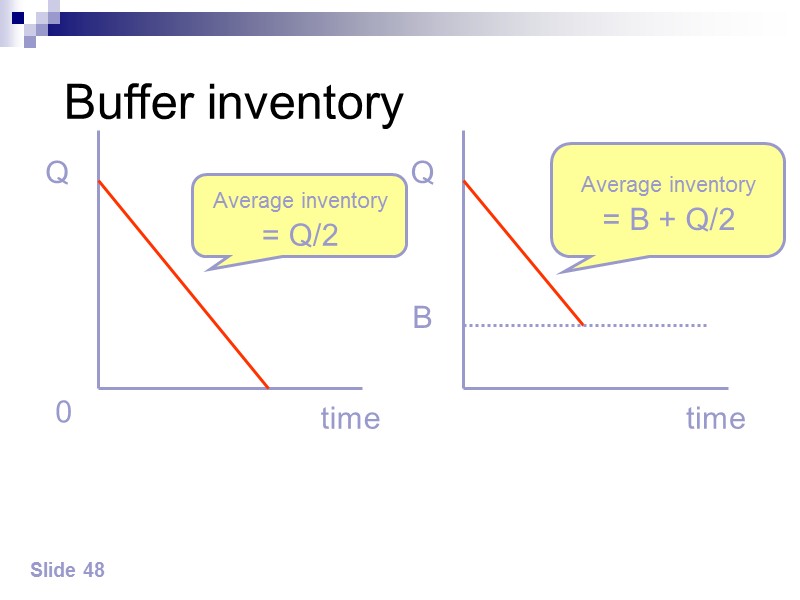
 Slide 48 Buffer inventory Q 0 time Q B time Average inventory = Q/2 Average inventory = B + Q/2
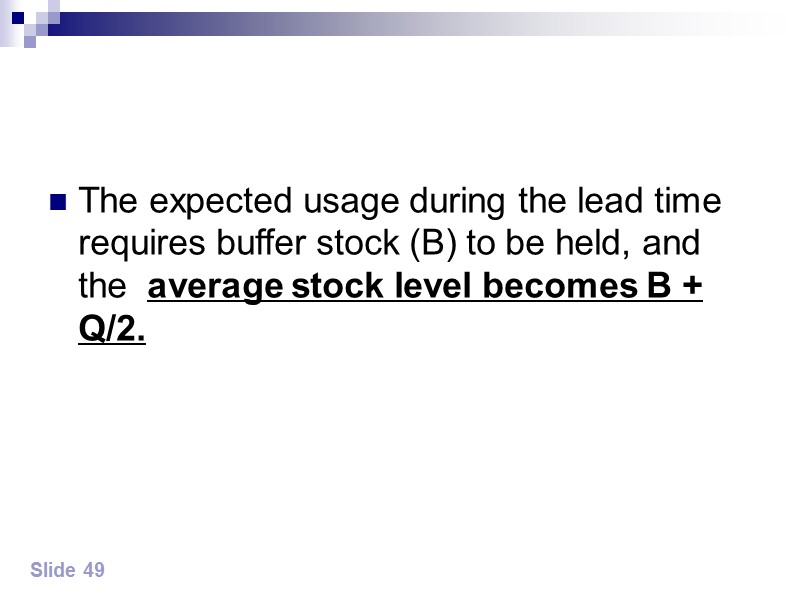
 The expected usage during the lead time requires buffer stock (B) to be held, and the average stock level becomes B + Q/2. Slide 49
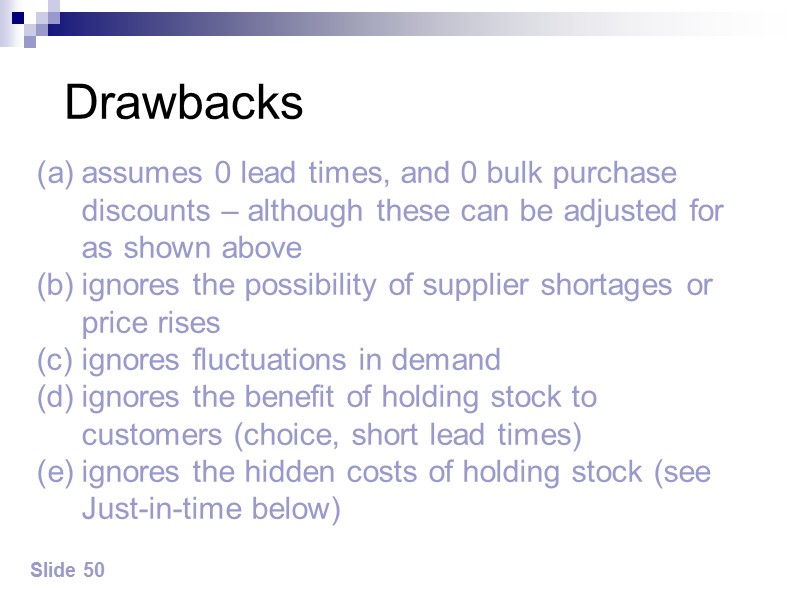
 Drawbacks Slide 50 assumes 0 lead times, and 0 bulk purchase discounts – although these can be adjusted for as shown above ignores the possibility of supplier shortages or price rises ignores fluctuations in demand ignores the benefit of holding stock to customers (choice, short lead times) ignores the hidden costs of holding stock (see Just-in-time below)
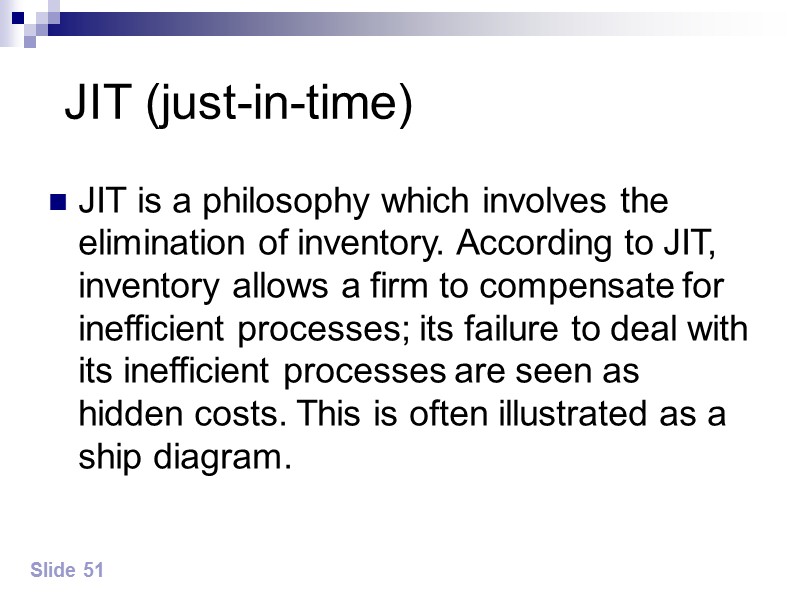
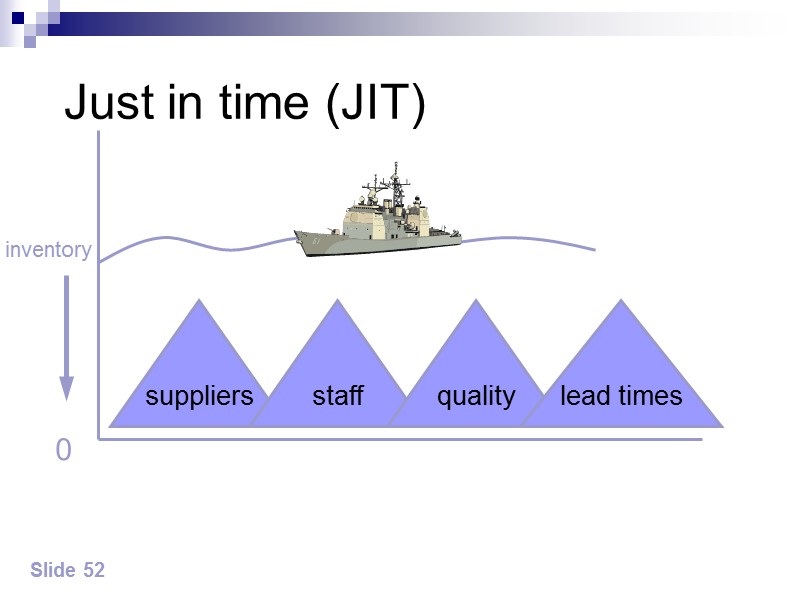
 JIT (just-in-time) JIT is a philosophy which involves the elimination of inventory. According to JIT, inventory allows a firm to compensate for inefficient processes; its failure to deal with its inefficient processes are seen as hidden costs. This is often illustrated as a ship diagram. Slide 51
 Slide 52 Just in time (JIT) inventory 0 suppliers staff quality lead times
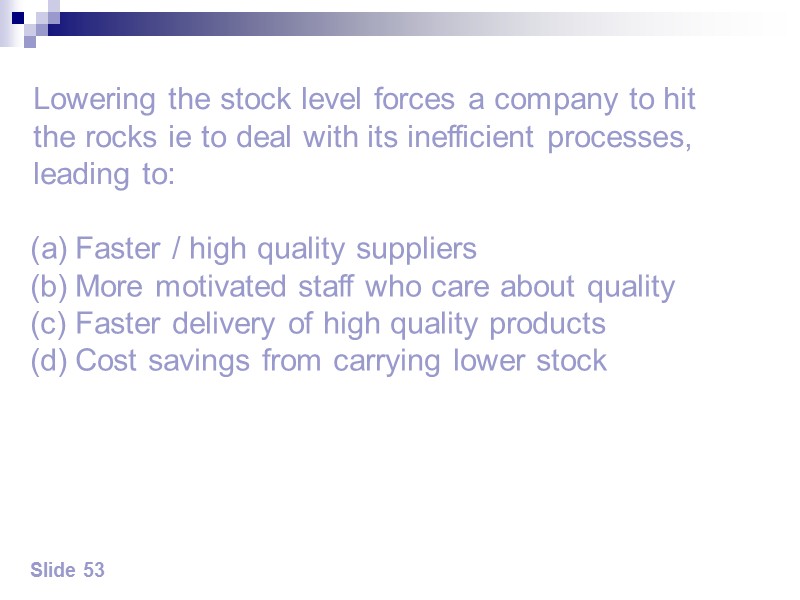
 Slide 53 Lowering the stock level forces a company to hit the rocks ie to deal with its inefficient processes, leading to: Faster / high quality suppliers More motivated staff who care about quality Faster delivery of high quality products Cost savings from carrying lower stock
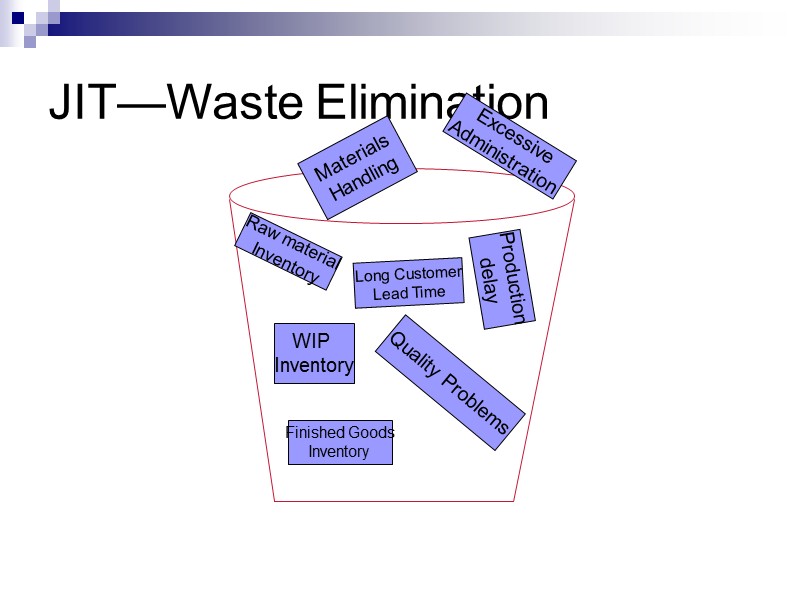
 JIT—Waste Elimination Raw material Inventory Long Customer Lead Time WIP Inventory Finished Goods Inventory Quality Problems Excessive Administration Production delay Materials Handling
 Managing receivables (debtors) Policy formulation The decision to offer credit can be viewed as an investment decision, resulting in higher profits. For many businesses offering generous payment terms to customers is essential in order to be competitive. Slide 55
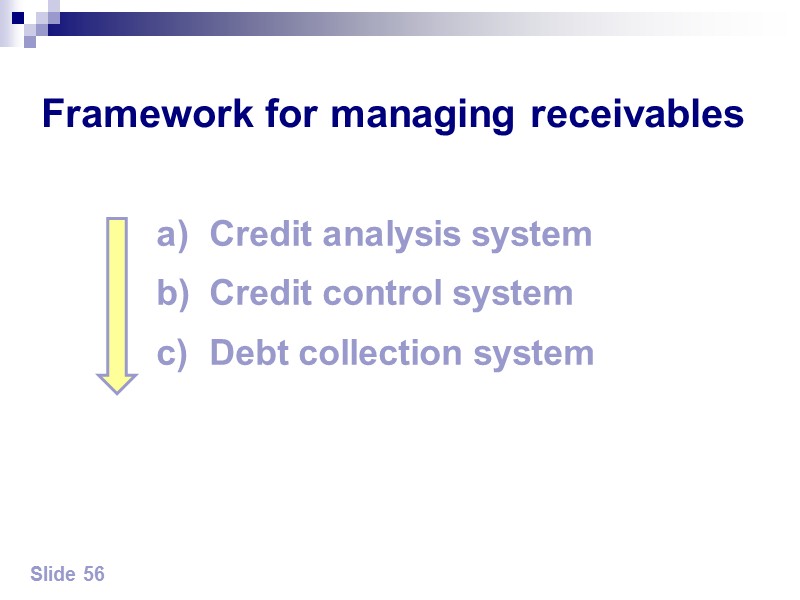
 Slide 56 Framework for managing receivables Credit analysis system Credit control system Debt collection system
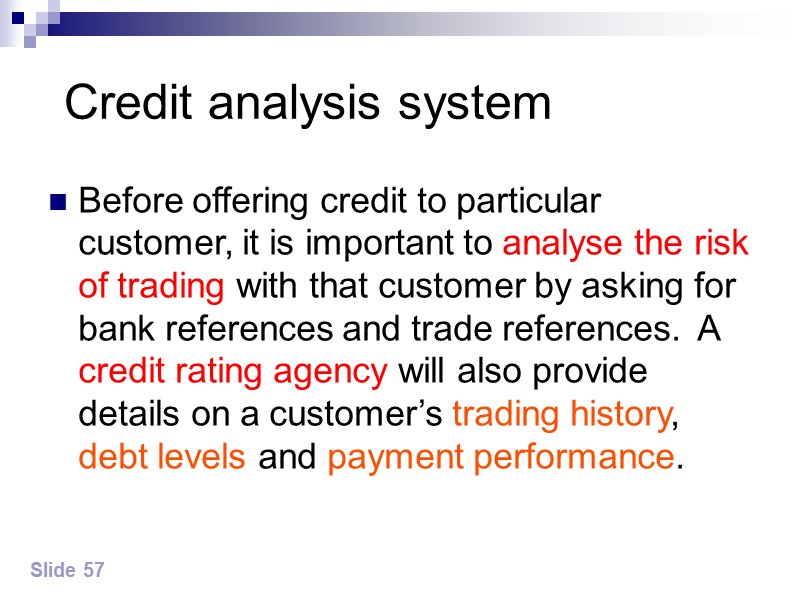
 Credit analysis system Before offering credit to particular customer, it is important to analyse the risk of trading with that customer by asking for bank references and trade references. A credit rating agency will also provide details on a customer’s trading history, debt levels and payment performance. Slide 57
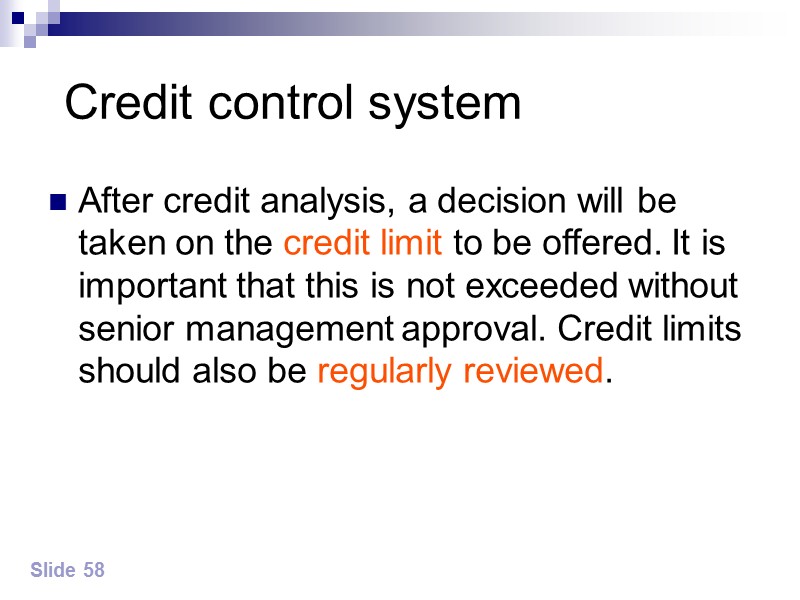
 Credit control system After credit analysis, a decision will be taken on the credit limit to be offered. It is important that this is not exceeded without senior management approval. Credit limits should also be regularly reviewed. Slide 58
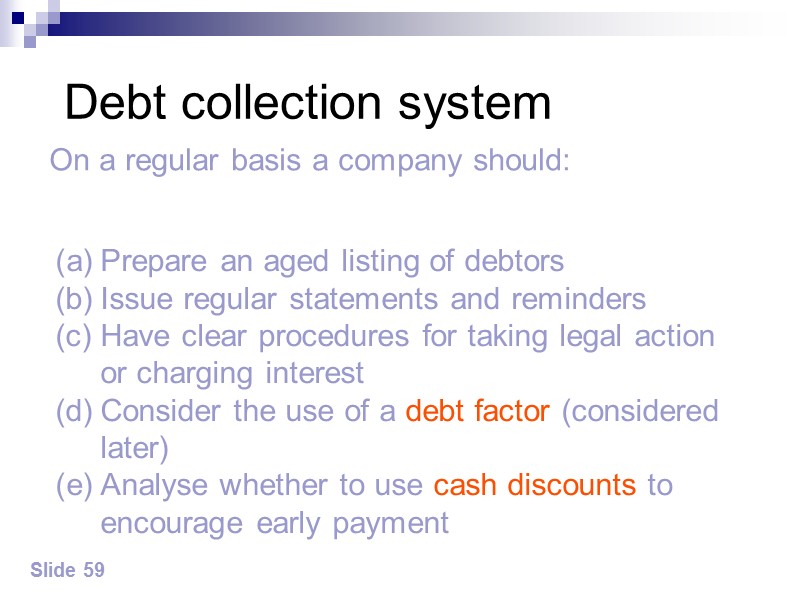
 Debt collection system Slide 59 On a regular basis a company should: Prepare an aged listing of debtors Issue regular statements and reminders Have clear procedures for taking legal action or charging interest Consider the use of a debt factor (considered later) Analyse whether to use cash discounts to encourage early payment
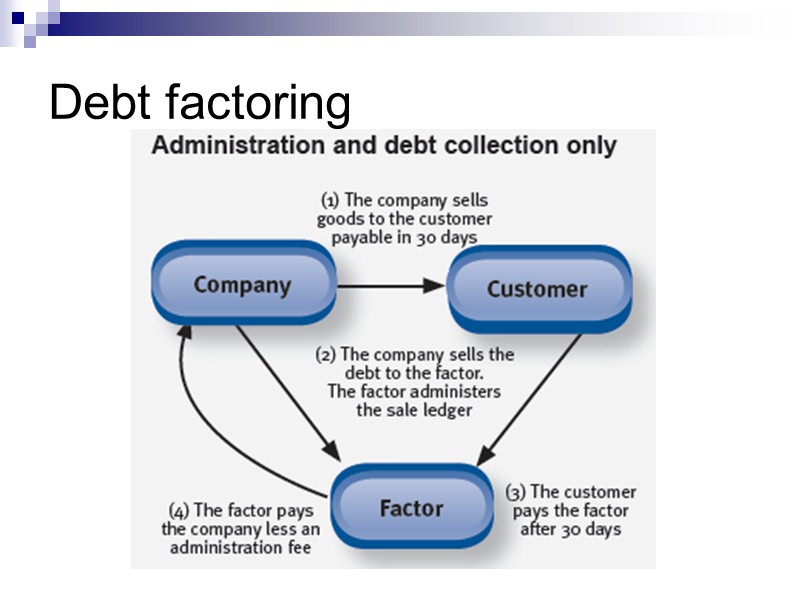
 Debt factoring
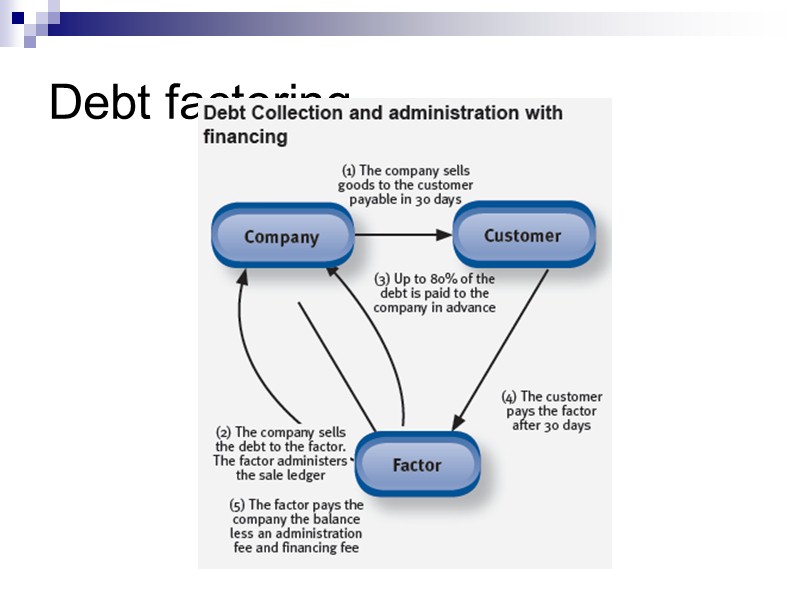
 Debt factoring
 Invoice discounting :
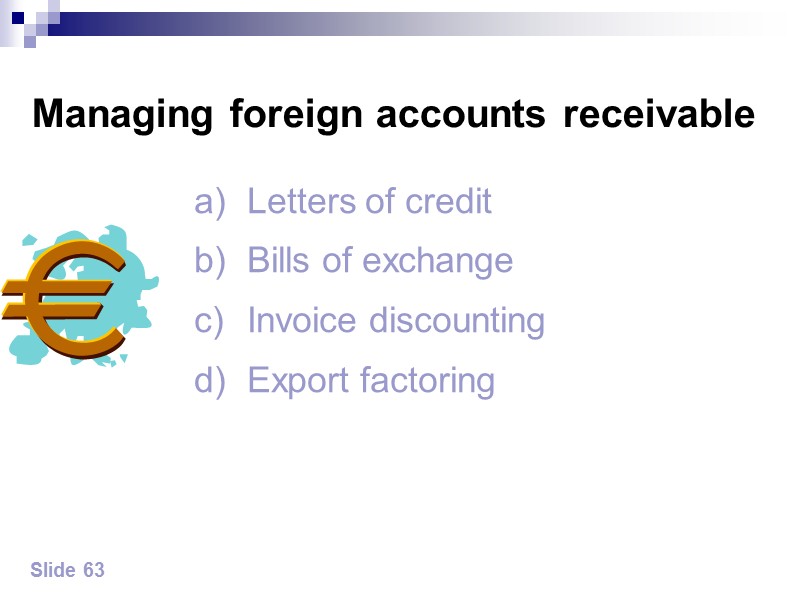
 Slide 63 Managing foreign accounts receivable Letters of credit Bills of exchange Invoice discounting Export factoring
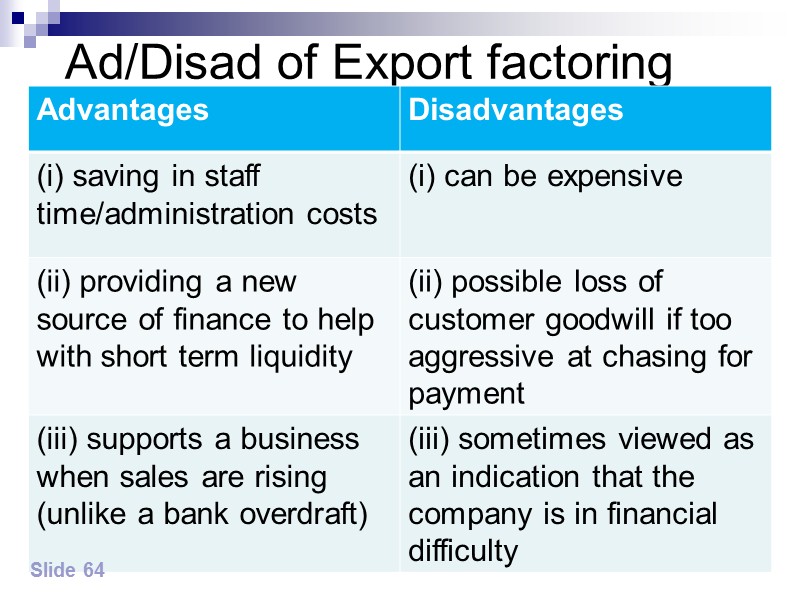
 Ad/Disad of Export factoring Slide 64
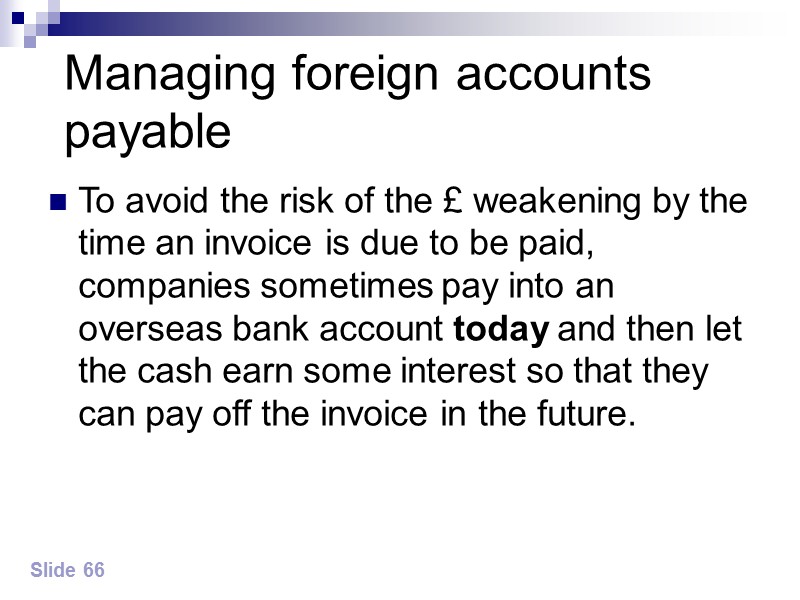
 Managing trade payables It is important that when suppliers offer credit, invoices are not paid early; an exception to this is when early payment discounts are offered. Slide 65
 Managing foreign accounts payable To avoid the risk of the £ weakening by the time an invoice is due to be paid, companies sometimes pay into an overseas bank account today and then let the cash earn some interest so that they can pay off the invoice in the future. Slide 66
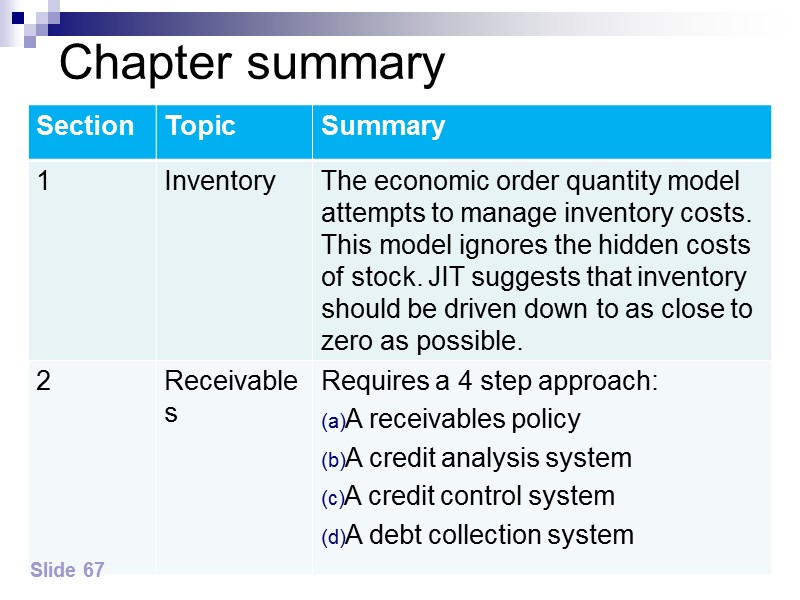
 Chapter summary Slide 67
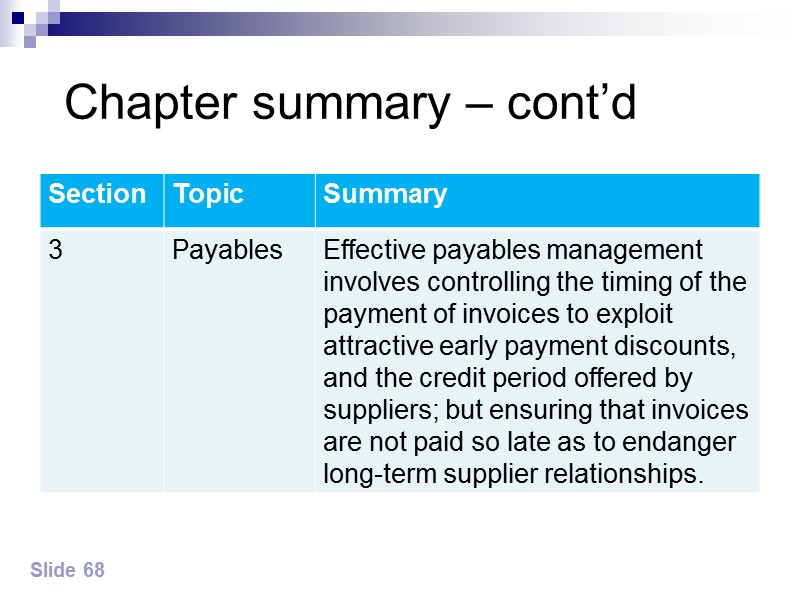
 Chapter summary – cont’d Slide 68
 Chapter 6 Chapter 6 Working capital finance
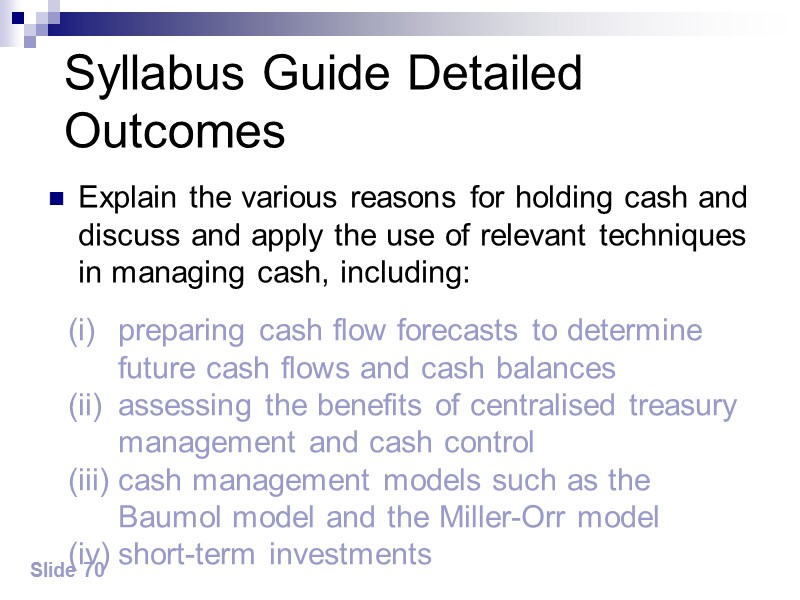
 Syllabus Guide Detailed Outcomes Explain the various reasons for holding cash and discuss and apply the use of relevant techniques in managing cash, including: Slide 70 preparing cash flow forecasts to determine future cash flows and cash balances assessing the benefits of centralised treasury management and cash control cash management models such as the Baumol model and the Miller-Orr model short-term investments
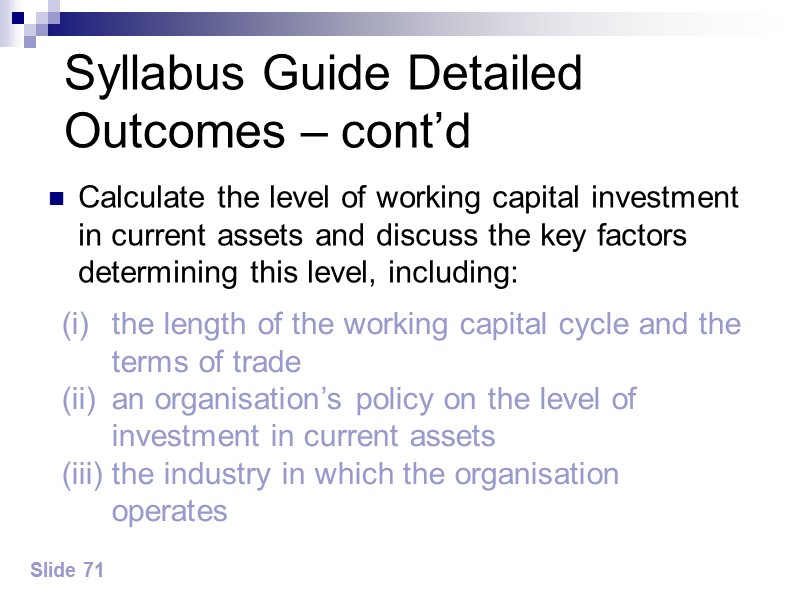
 Syllabus Guide Detailed Outcomes – cont’d Calculate the level of working capital investment in current assets and discuss the key factors determining this level, including: Slide 71 the length of the working capital cycle and the terms of trade an organisation’s policy on the level of investment in current assets the industry in which the organisation operates
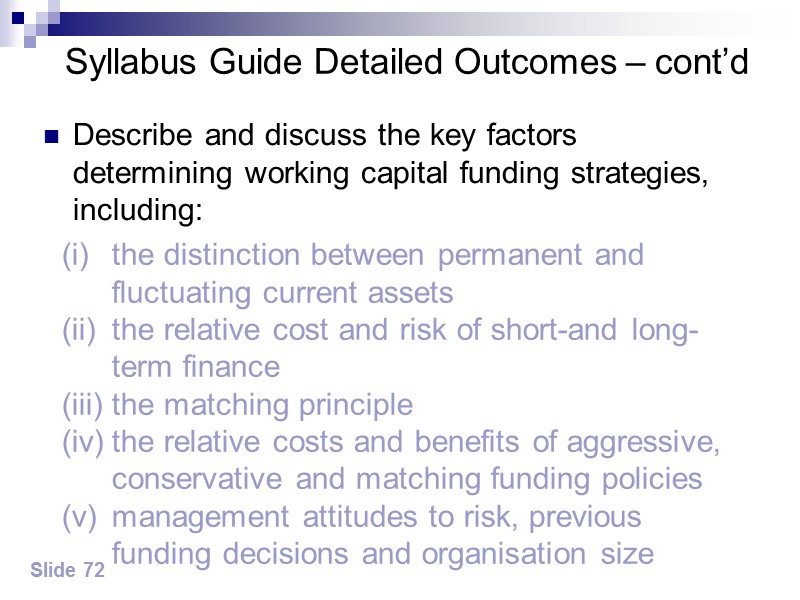
 Syllabus Guide Detailed Outcomes – cont’d Describe and discuss the key factors determining working capital funding strategies, including: Slide 72 the distinction between permanent and fluctuating current assets the relative cost and risk of short-and long-term finance the matching principle the relative costs and benefits of aggressive, conservative and matching funding policies management attitudes to risk, previous funding decisions and organisation size
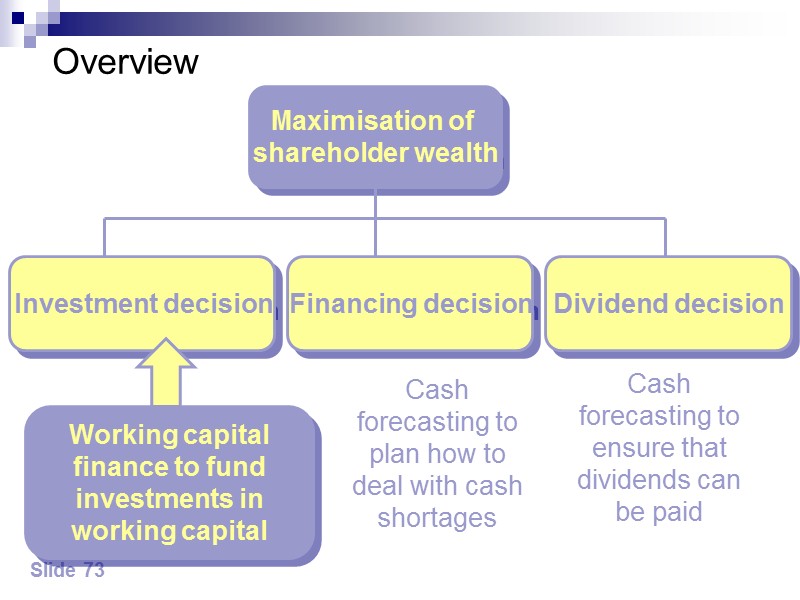
 Overview Slide 73 Maximisation of shareholder wealth Working capital finance to fund investments in working capital Cash forecasting to plan how to deal with cash shortages Cash forecasting to ensure that dividends can be paid
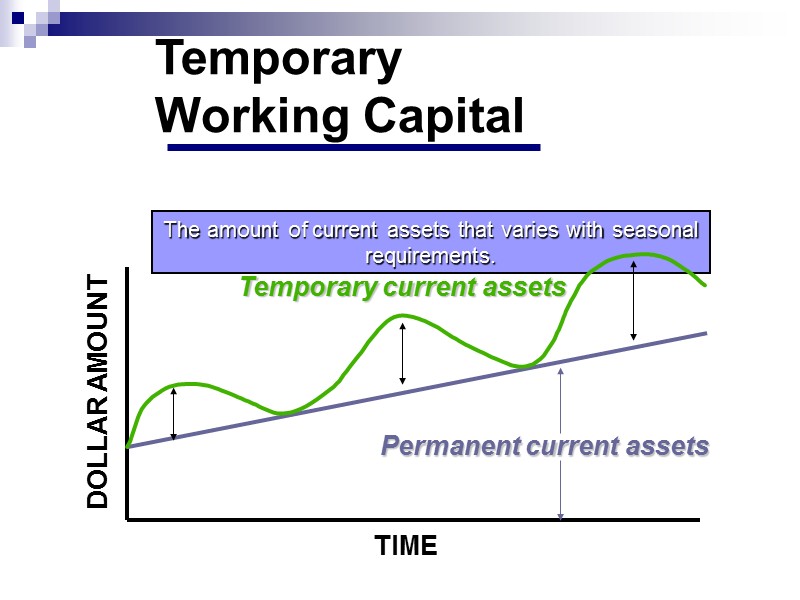
 The management of cash As a business grows, its working capital funding needs to also grow. A key question for a treasury department is how to fund this working capital growth. This is complicated by the fact that some current assets are permanent (eg a certain amount of stock and debtors are always present) and some are fluctuating (due to seasonal fluctuations in business). Slide 74
 Slide 75 The management of cash Forecast cash needs Manage forecast cash shortages Manage forecast cash surpluses
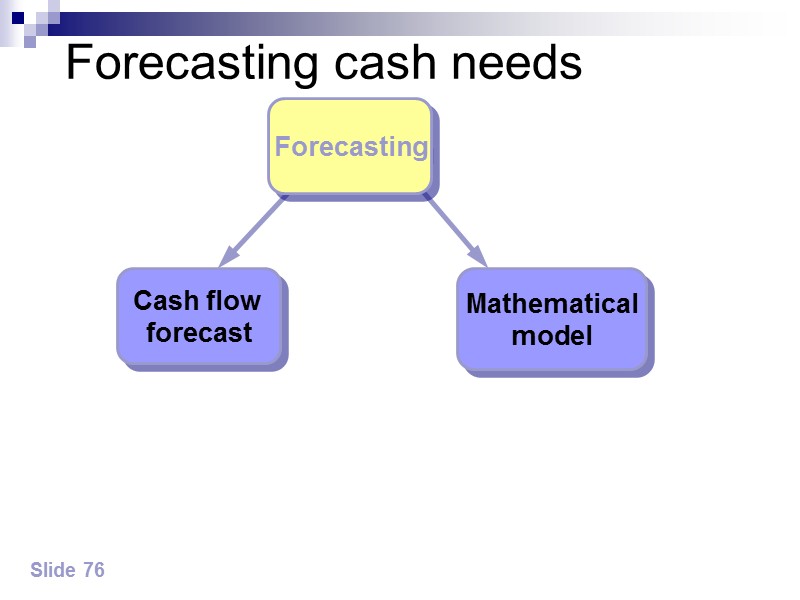
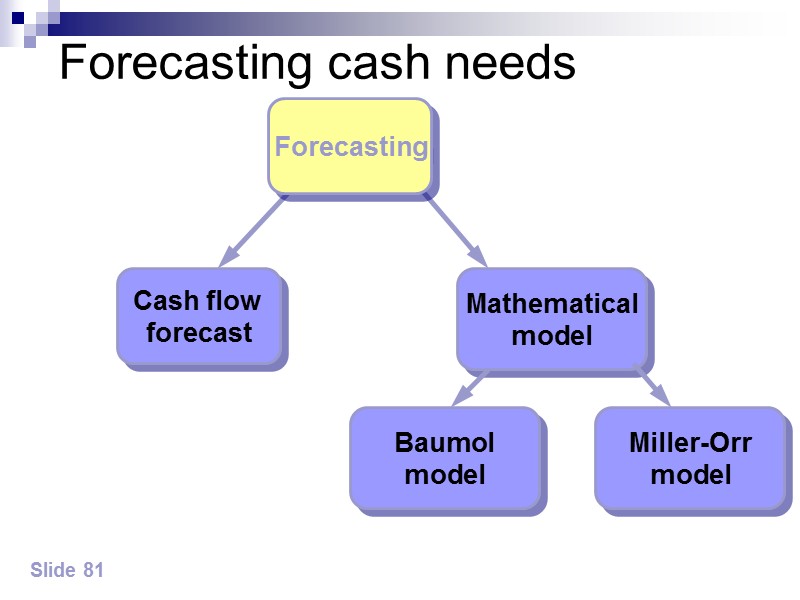
 Slide 76 Forecasting cash needs Cash flow forecast Mathematical model Forecasting
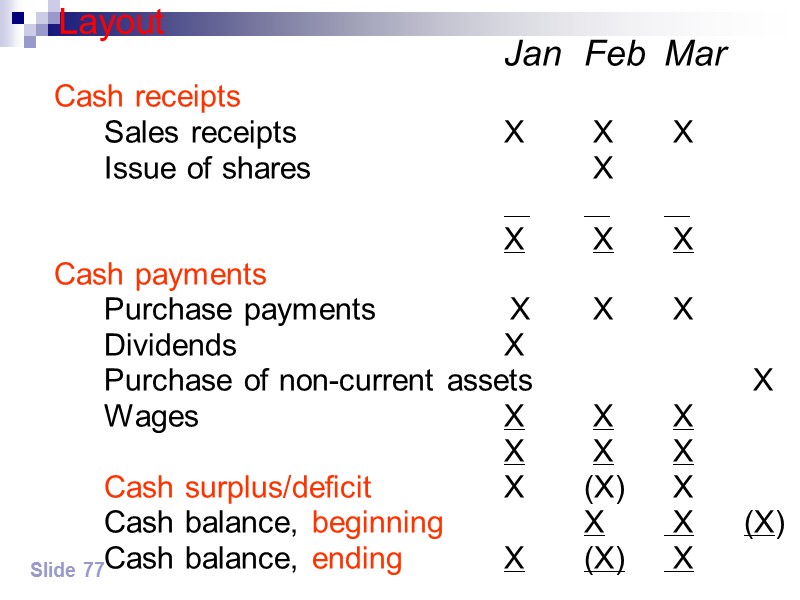
 Slide 77 Layout Jan Feb Mar Cash receipts Sales receipts X X X Issue of shares X X X X Cash payments Purchase payments X X X Dividends X Purchase of non-current assets X Wages X X X X X X Cash surplus/deficit X (X) X Cash balance, beginning X X (X) Cash balance, ending X (X) X
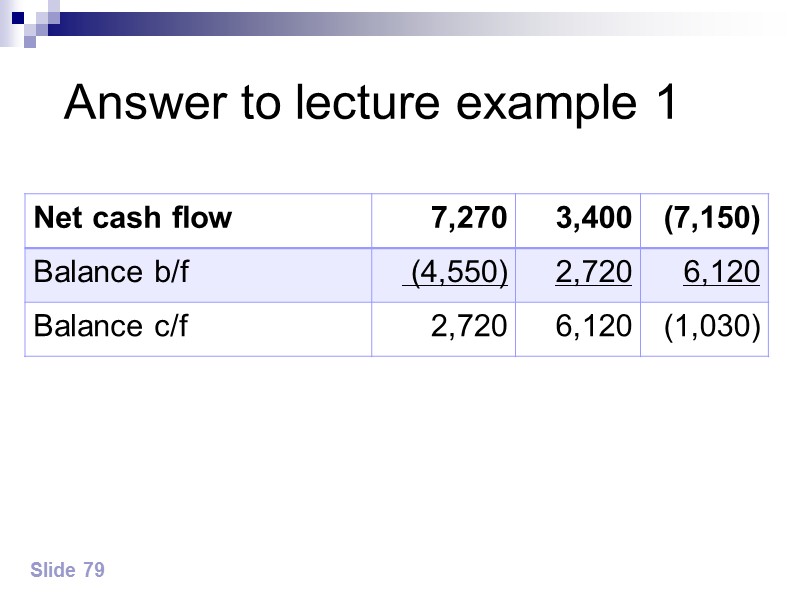
 Lecture example 1 Slide 78 Ben is a wholesaler of motorcycle helmets, it is 1 January 20X2. (Refer to the course note) Required Prepare a monthly cash flow forecast for the 1st quarter of 20X2; the opening balance is negative £4,550.
 Answer to lecture example 1 Slide 79
 Mathematical models The cash flow forecast calculates the cash needed for a period eg £1.5m might be needed to fund forecast cash outflows expected by a division in a particular year. Some businesses pay the expenses of a particular department or division from a separate sub account. If so, it is not sensible to deposit the £1.5m into this sub-account at the start of the year because this will lead to a loss of interest earned from a high interest account or from securities. Instead, it is better to gradually transfer the funds as they are needed. Slide 80
 Slide 81 Forecasting cash needs Cash flow forecast Mathematical model Forecasting Baumol model Miller-Orr model
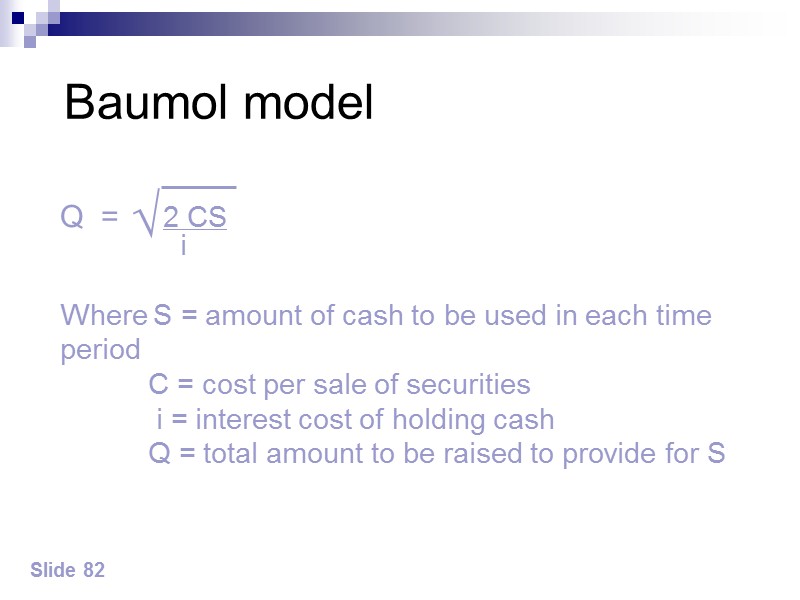
 Slide 82 Baumol model Q = 2 CS i Where S = amount of cash to be used in each time period C = cost per sale of securities i = interest cost of holding cash Q = total amount to be raised to provide for S √
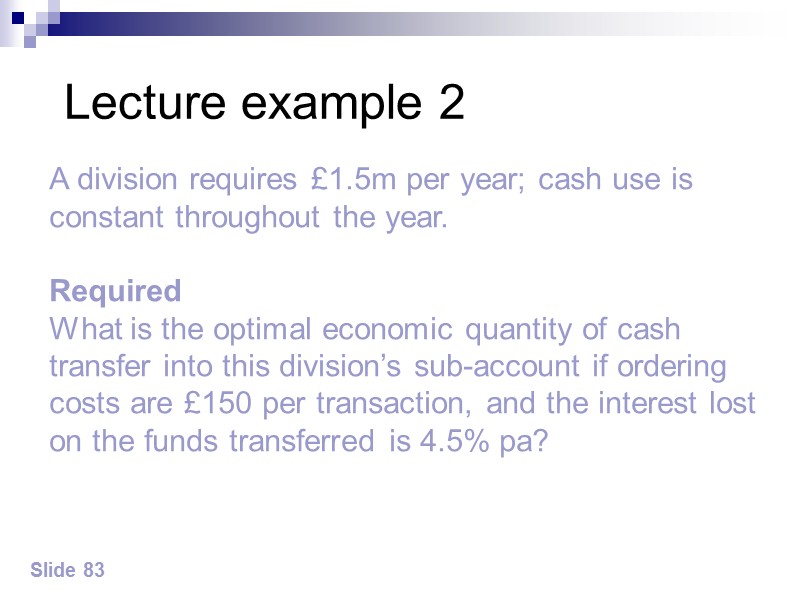
 Lecture example 2 Slide 83 A division requires £1.5m per year; cash use is constant throughout the year. Required What is the optimal economic quantity of cash transfer into this division’s sub-account if ordering costs are £150 per transaction, and the interest lost on the funds transferred is 4.5% pa?
 Answer to lecture example 2 Slide 84 (i.e. Arrange 15 transfers of money into the account of £100,000 each over the year).
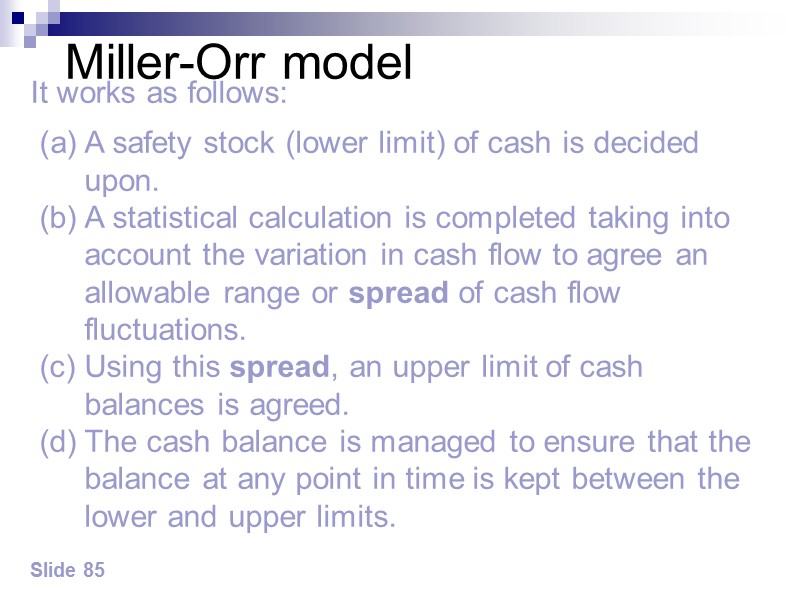
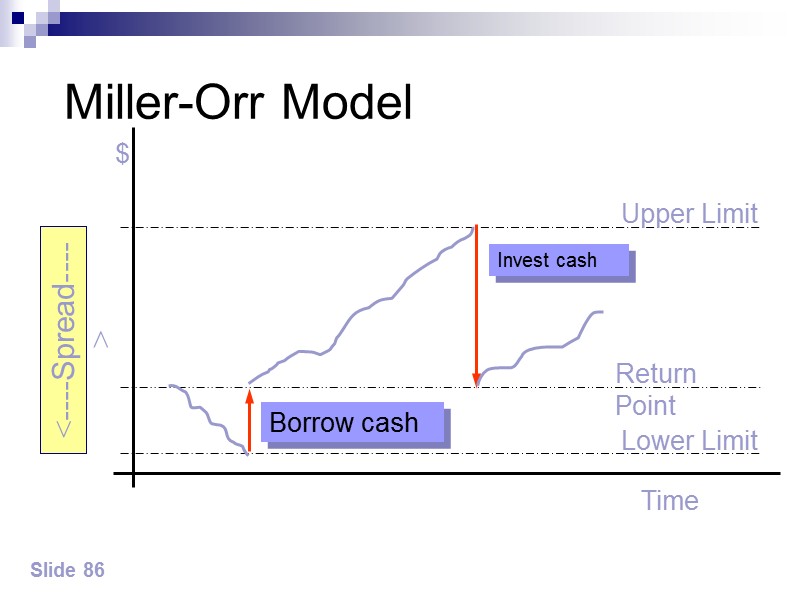
 Miller-Orr model Slide 85 It works as follows: A safety stock (lower limit) of cash is decided upon. A statistical calculation is completed taking into account the variation in cash flow to agree an allowable range or spread of cash flow fluctuations. Using this spread, an upper limit of cash balances is agreed. The cash balance is managed to ensure that the balance at any point in time is kept between the lower and upper limits.
 Slide 86 Miller-Orr Model Time $ <----Spread---->
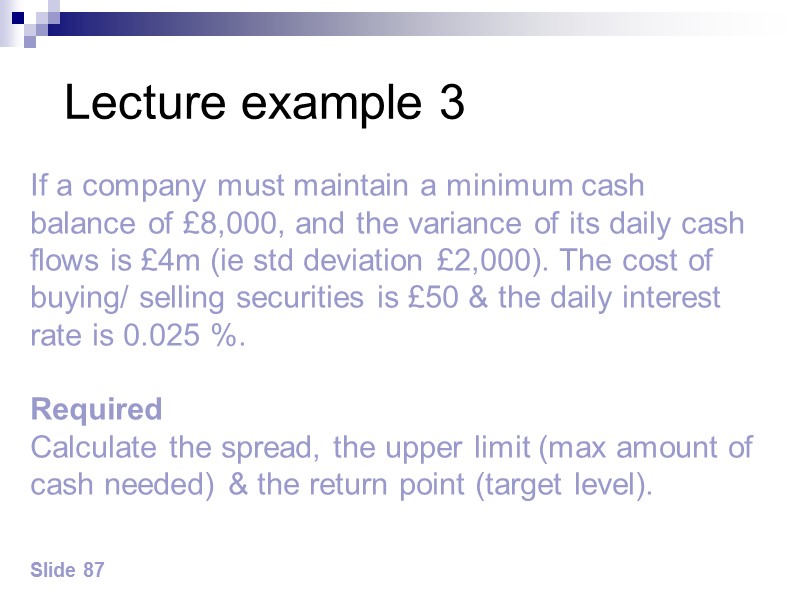
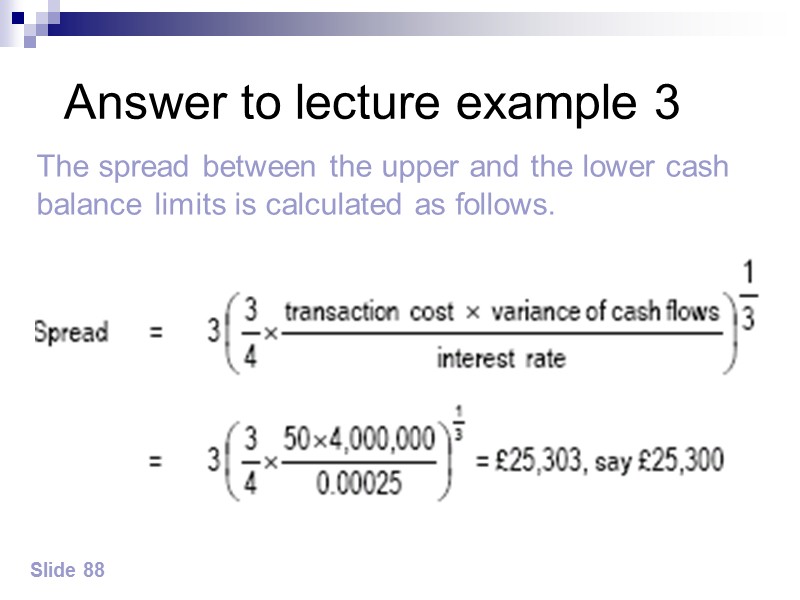
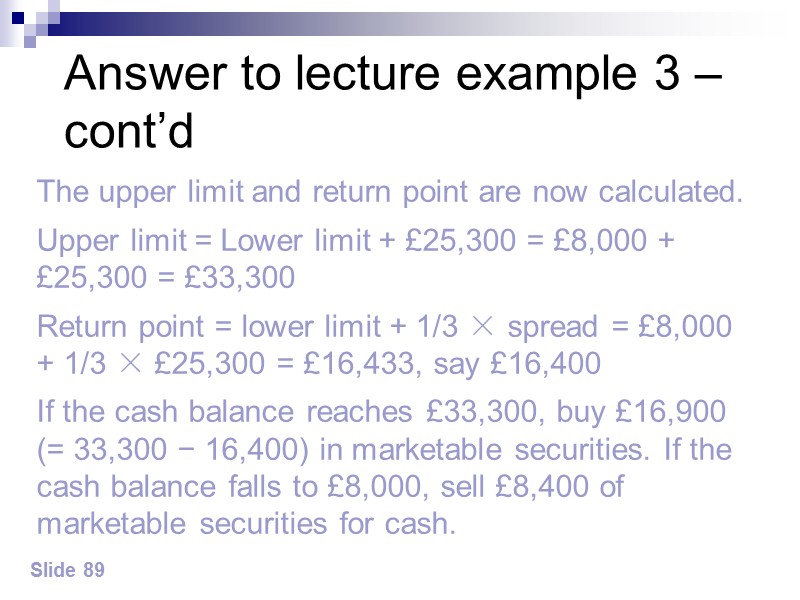
 Lecture example 3 Slide 87 If a company must maintain a minimum cash balance of £8,000, and the variance of its daily cash flows is £4m (ie std deviation £2,000). The cost of buying/ selling securities is £50 & the daily interest rate is 0.025 %. Required Calculate the spread, the upper limit (max amount of cash needed) & the return point (target level).
 Answer to lecture example 3 Slide 88 The spread between the upper and the lower cash balance limits is calculated as follows.
 Answer to lecture example 3 – cont’d Slide 89 The upper limit and return point are now calculated. Upper limit = Lower limit + £25,300 = £8,000 + £25,300 = £33,300 Return point = lower limit + 1/3 × spread = £8,000 + 1/3 × £25,300 = £16,433, say £16,400 If the cash balance reaches £33,300, buy £16,900 (= 33,300 − 16,400) in marketable securities. If the cash balance falls to £8,000, sell £8,400 of marketable securities for cash.
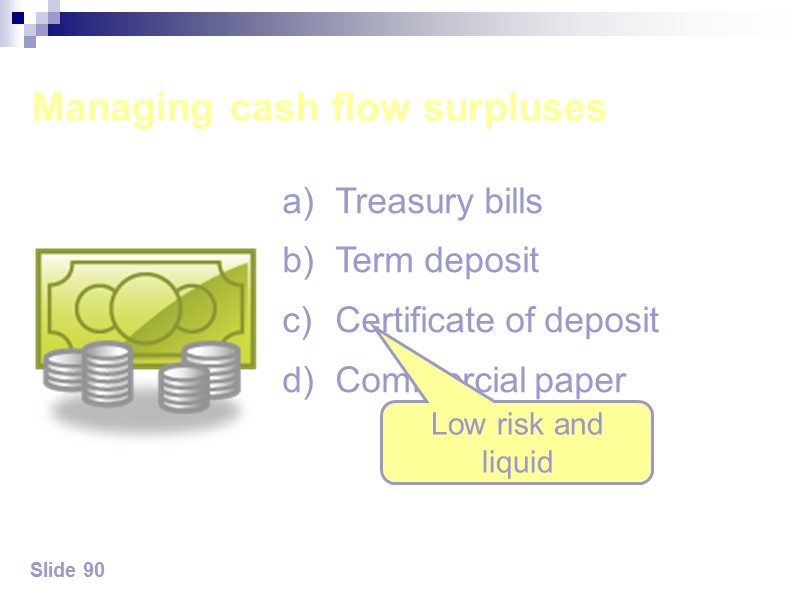
 Slide 90 Managing cash flow surpluses Treasury bills Term deposit Certificate of deposit Commercial paper Low risk and liquid
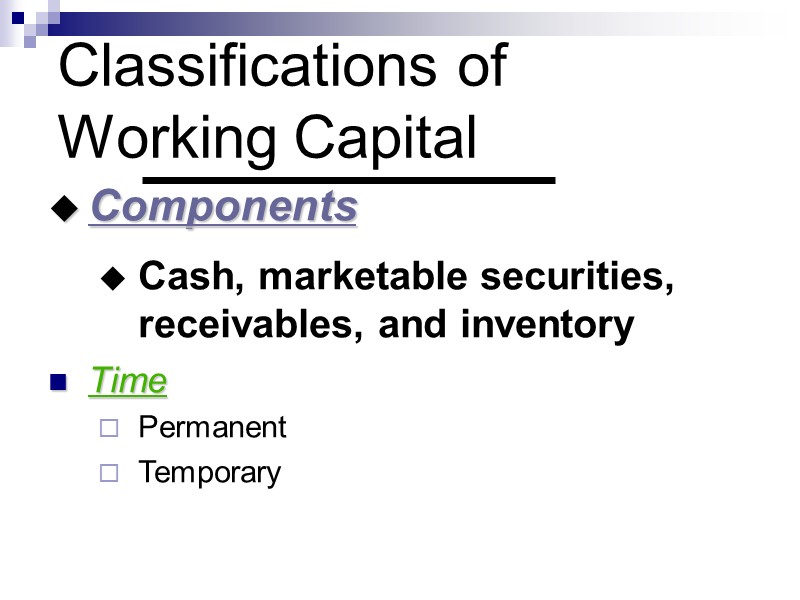
 Classifications of Working Capital Time Permanent Temporary Components Cash, marketable securities, receivables, and inventory
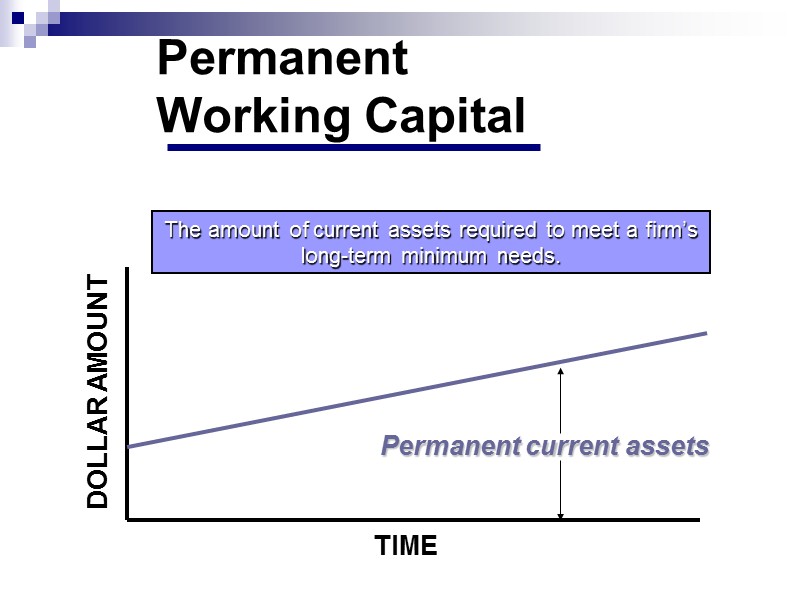
 Permanent Working Capital The amount of current assets required to meet a firm’s long-term minimum needs. Permanent current assets TIME DOLLAR AMOUNT
 Temporary Working Capital The amount of current assets that varies with seasonal requirements. Permanent current assets TIME DOLLAR AMOUNT Temporary current assets
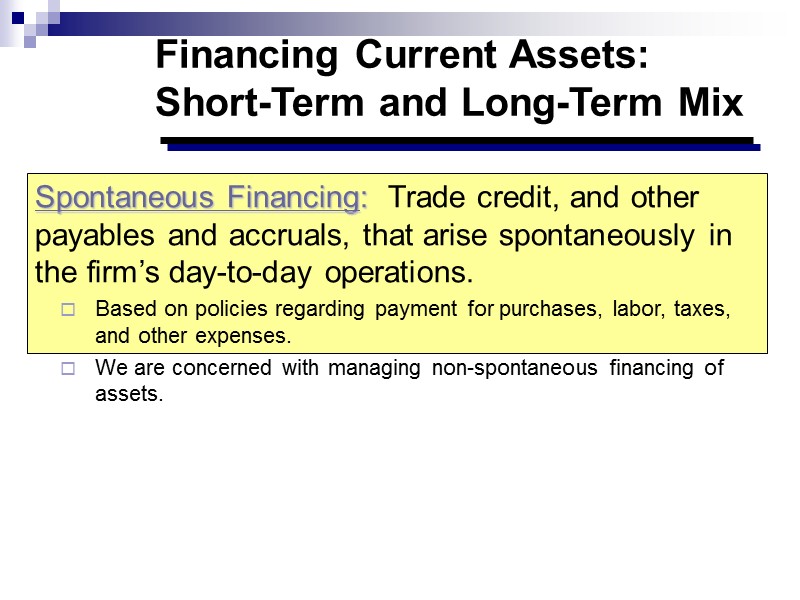
 Financing Current Assets: Short-Term and Long-Term Mix Spontaneous Financing: Trade credit, and other payables and accruals, that arise spontaneously in the firm’s day-to-day operations. Based on policies regarding payment for purchases, labor, taxes, and other expenses. We are concerned with managing non-spontaneous financing of assets.
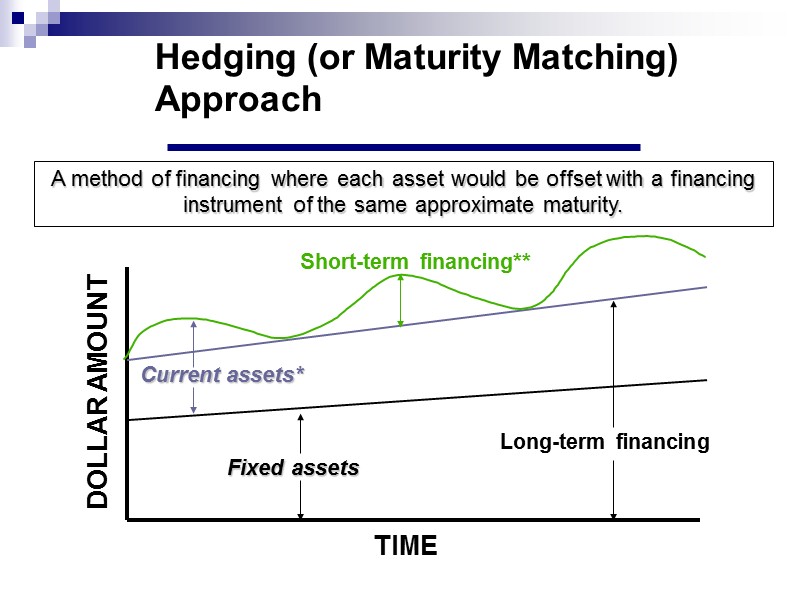
 Hedging (or Maturity Matching) Approach A method of financing where each asset would be offset with a financing instrument of the same approximate maturity. TIME DOLLAR AMOUNT Long-term financing Fixed assets Current assets* Short-term financing**
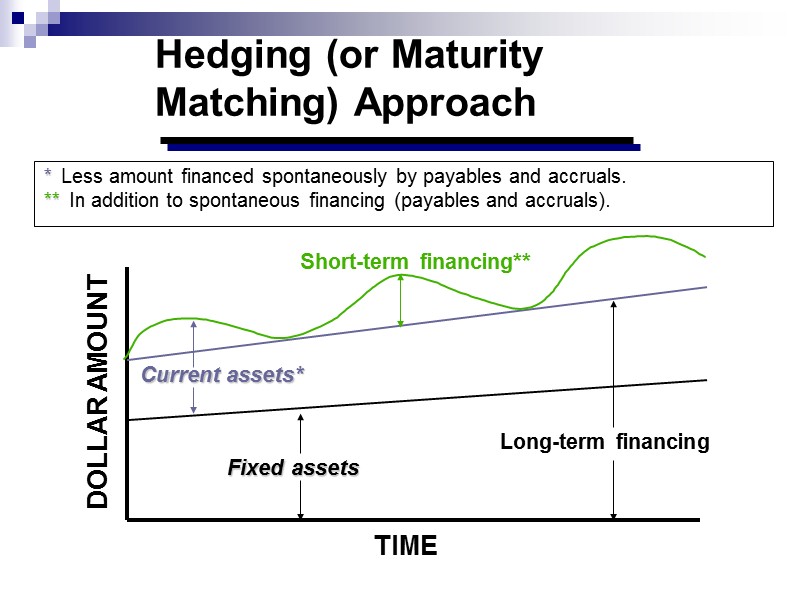
 Hedging (or Maturity Matching) Approach * Less amount financed spontaneously by payables and accruals. ** In addition to spontaneous financing (payables and accruals). TIME DOLLAR AMOUNT Long-term financing Fixed assets Current assets* Short-term financing**
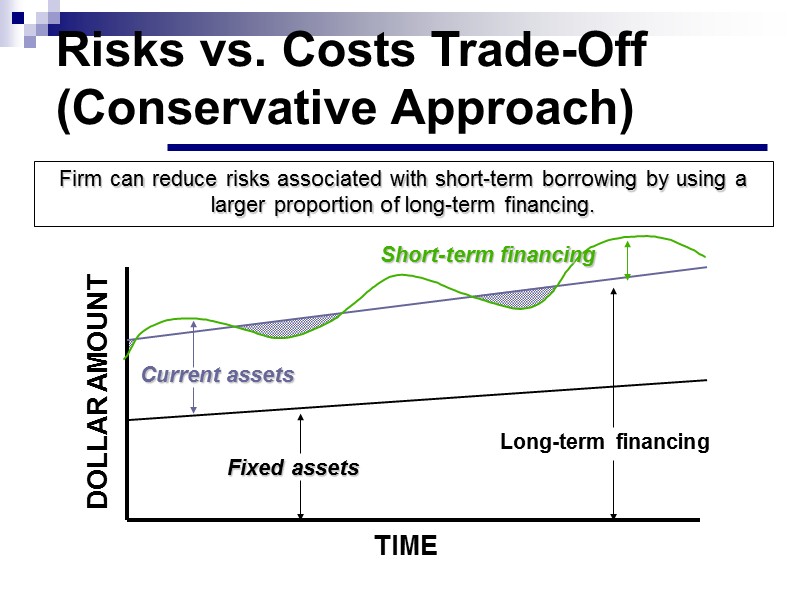
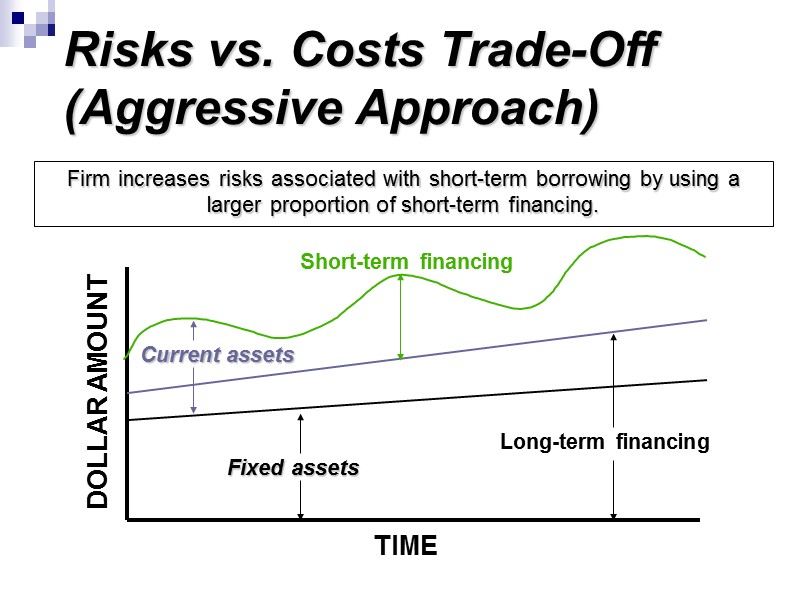
 Risks vs. Costs Trade-Off (Conservative Approach) Firm can reduce risks associated with short-term borrowing by using a larger proportion of long-term financing. TIME DOLLAR AMOUNT Long-term financing Fixed assets Current assets Short-term financing
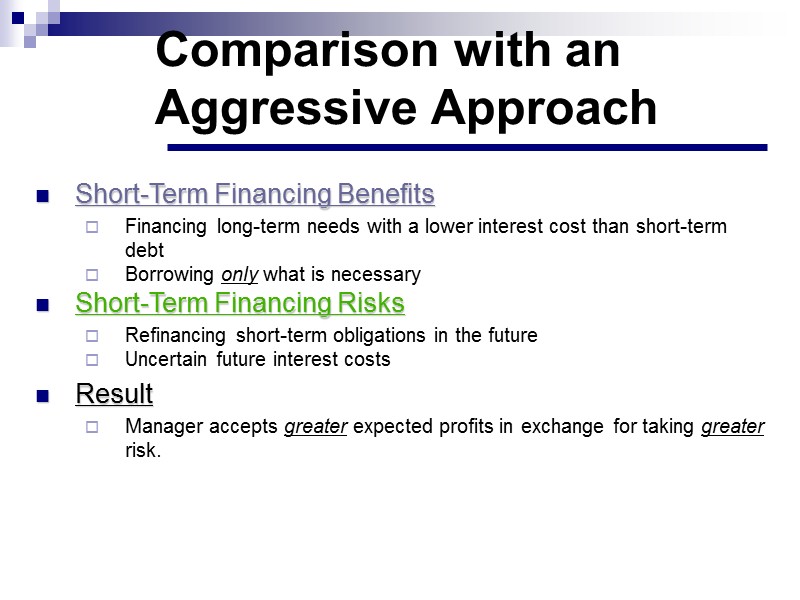
 Comparison with an Aggressive Approach Short-Term Financing Benefits Financing long-term needs with a lower interest cost than short-term debt Borrowing only what is necessary Short-Term Financing Risks Refinancing short-term obligations in the future Uncertain future interest costs Result Manager accepts greater expected profits in exchange for taking greater risk.
 Firm increases risks associated with short-term borrowing by using a larger proportion of short-term financing. TIME DOLLAR AMOUNT Long-term financing Fixed assets Current assets Short-term financing Risks vs. Costs Trade-Off (Aggressive Approach)
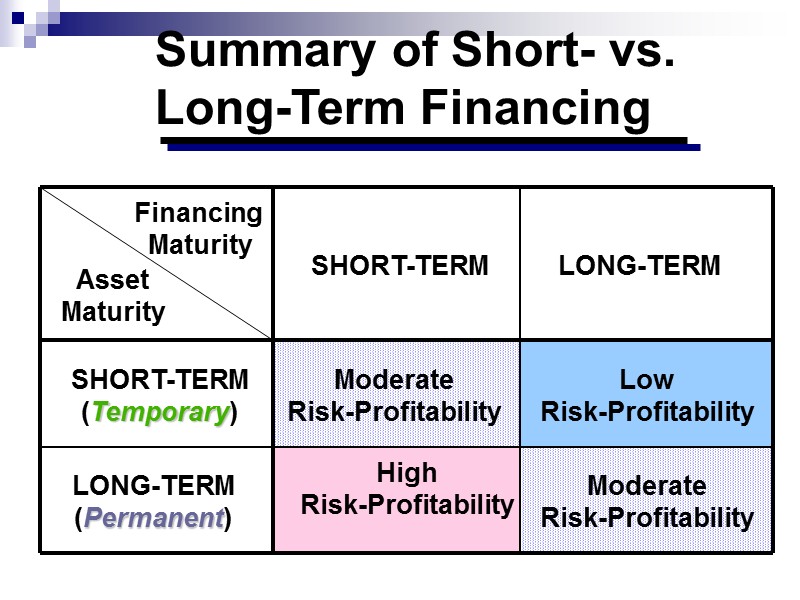
 Summary of Short- vs. Long-Term Financing Financing Maturity Asset Maturity SHORT-TERM LONG-TERM Low Risk-Profitability Moderate Risk-Profitability Moderate Risk-Profitability High Risk-Profitability SHORT-TERM (Temporary) LONG-TERM (Permanent)
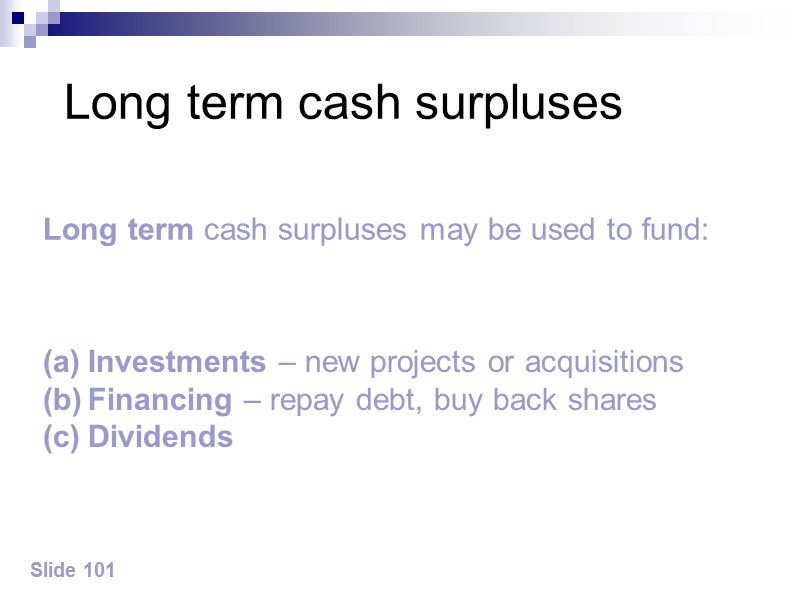
 Long term cash surpluses Slide 101 Investments – new projects or acquisitions Financing – repay debt, buy back shares Dividends Long term cash surpluses may be used to fund:
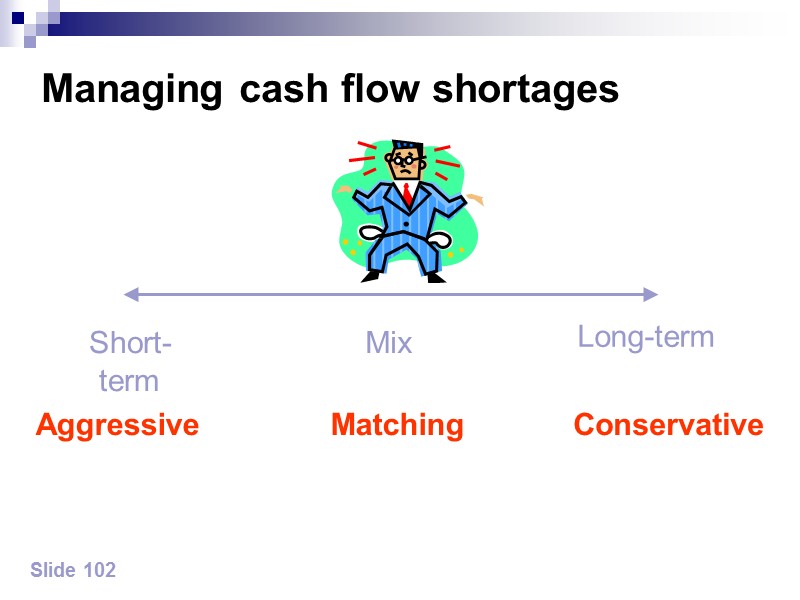
 Slide 102 Managing cash flow shortages Short-term Long-term Aggressive Conservative Mix Matching
 In between these extremes is a matching policy which uses short-term finance to fund fluctuating current assets and long term finance to fund permanent current assets and non-current assets. Slide 103
 Slide 104 The likelihood of a company adopting an aggressive approach depends on: Management attitude to risk Strength of relationship with the bank providing an overdraft Ability to raise long-term finance
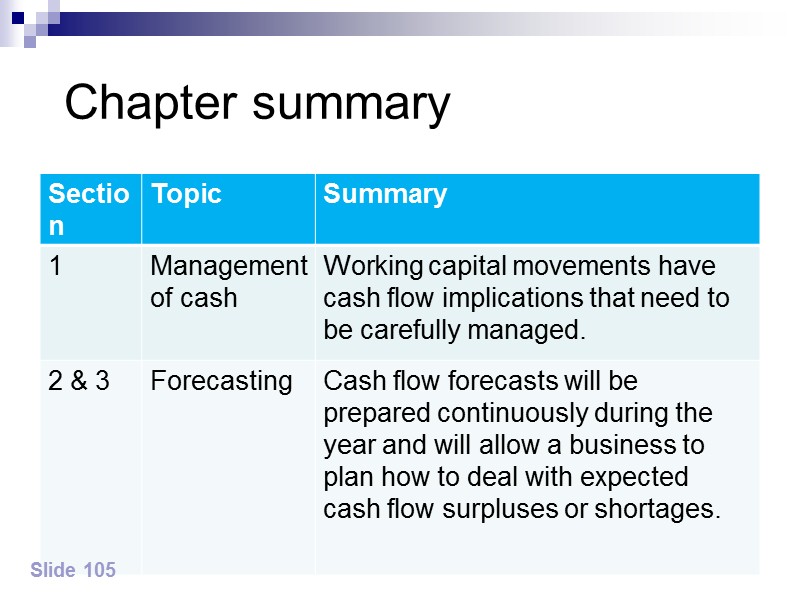
 Chapter summary Slide 105
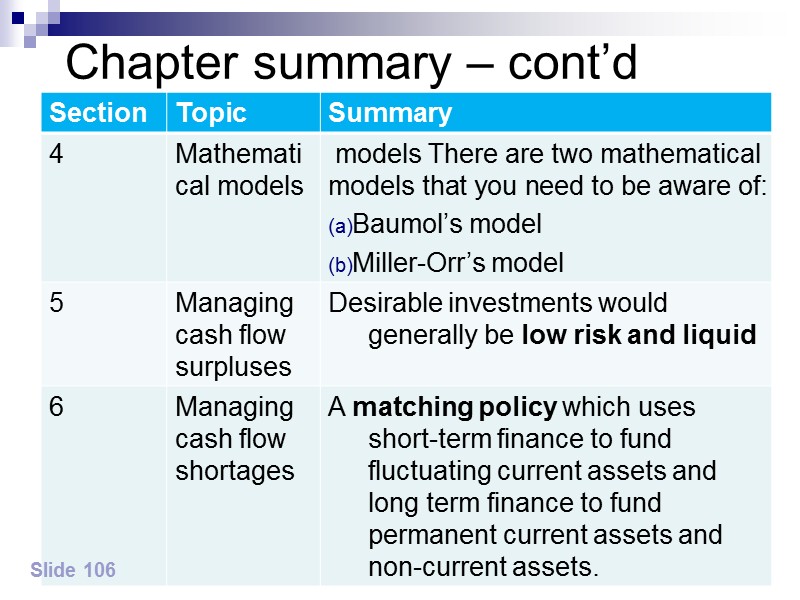
 Chapter summary – cont’d Slide 106
