Презентация Climate Mon(1).pptx
- Количество слайдов: 34
 CLIMATE MONITORING Weather and climate Climate is defined as the average weather over a thirtyyear period. Therefore, climate change can only be perceived and understood if measurements of all factors that can determine or influence the climate are taken over long periods of time. This includes factors such as temperature, wind, greenhouse gas concentrations, natural emissions and man-made emissions. Climate can be observed locally and globally. Statements on climate change usually concern worldwide averages, which show a change measured over a longer period of time. However, changes in the local climate are often more relevant to people.
 These changes can be very different and even opposite to the global changes. The climate is highly variable by nature. No two years are alike. Therefore, trendrelated changes are only provable if they exceed the noise of normal and local variations. Taking measurements, organizing data and constructing explanatory and predictive models for how the different climate factors affect each other is what we call climate monitoring.
 Climate monitoring and climate change Climate monitoring concerns the monitoring of the atmosphere and of other components of the earth system as well as the monitoring of global climate indicators (e. g. global mean earth surface temperature and precipitation). Satellite measurements appear to satisfy the need for global measurements. The earth climate shows great variability over different time scales spanning from decades to thousands of years and more. Past climate are studied by analysing ice cores, sea/lake sediments, shorelines movements, tree pollen, etc.
 The knowledge of past climate can help in predicting the future. Abrupt changes may serve in the identification of thresholds values that can trigger a non-linear behavior of the earth system (and hence may cause high variations). The overlapping of climate variability on different time scales is the very challenge in predicting climatic changes. Many lines of scientific evidence show the Earth's climate is changing. It is worth noting that increasing global temperature is only one element of observed global climate change. Precipitation patterns are also changing; storms and other extremes are changing as well.
 Thousands of land ocean temperature measurements are recorded each day around the globe. This includes measurements from climate reference stations, weather stations, ships, buoys and autonomous gliders in the oceans. These surface measurements are also supplemented with satellite measurements. These measurements are processed, examined for random and systematic errors, and then finally combined to produce a time series of global average temperature change.
 The Global Surface Temperature is Rising Global average temperature is one of the most-cited indicators of global climate change, and shows an increase of approximately 1. 4°F since the early 20 th Century. The global surface temperature is based on air temperature data over land sea-surface temperatures observed from ships, buoys and satellites. Notably, the 20 warmest years have all occurred since 1981, and the 10 warmest have all occurred in the past 12 years.
 Global annual average temperature measured over land oceans. Red bars indicate temperatures above and blue bars indicate temperatures below the 1901 -2000 average temperature. The black line shows atmospheric carbon dioxide concentration in parts per million.
 Sea Level is Rising Global mean sea level has been rising at an average rate of approximately 1. 7 mm/year over the past 100 years (measured from tide gauge observations), which is significantly larger than the rate averaged over the last several thousand years. Since 1993, global sea level has risen at an accelerating rate of around 3. 5 mm/year. Much of the sea level rise to date is a result of increasing heat of the ocean causing it to expand. It is expected that melting land ice (e. g. from Greenland mountain glaciers) will play a more significant role in contributing to future sea level rise.
 Annual averages of global sea level. Red: sea-level since 1870; Blue: tide gauge data; Black: based on satellite observations. The inset shows global mean sea level rise since 1993 - a period over which sea level rise has accelerated.
 Northern Hemisphere Snow Cover is Retreating Northern Hemisphere average annual snow cover has declined in recent decades. This pattern is consistent with warmer global temperatures. Some of the largest declines have been observed in the spring and summer months.
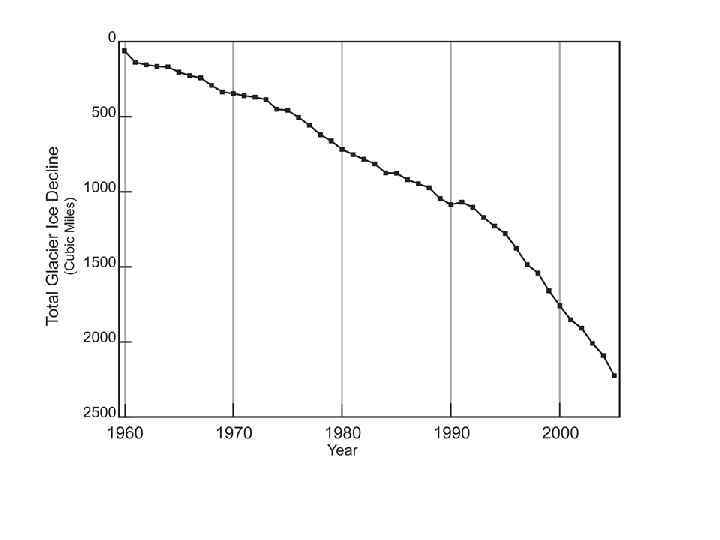
 Glacier Volume is Shrinking Warming temperatures lead to the melting of glaciers and ice sheets. The total volume of glaciers on Earth is declining sharply. Glaciers have been retreating worldwide for at least the last century; the rate of retreat has increased in the past decade. Only a few glaciers are actually advancing (in locations that were well below freezing, and where increased precipitation has outpaced melting). The progressive disappearance of glaciers has implications not only for a rising global sea level, but also for water supplies in certain regions of Asia and South America.
 A large body of evidence supports the conclusion that human activity is the primary driver of recent warming. Global climate models clearly show the effect of human-induced changes on global temperatures.
, and model experiments") Simulated global temperature in experiments that include human influences (pink line), and model experiments that included only natural factors (blue line). The black line is observed temperature change.
Simulated global temperature in experiments that include human influences (pink line), and model experiments that included only natural factors (blue line). The black line is observed temperature change.
 Characteristics and uses of climate observations Climate observations are important because they help satisfy important social, economic and environmental needs. They are an integral part of reducing the risk of loss of life and damage to property. Climate observations are sourced from the numerous meteorological and related observational networks and systems that underpin applications such as weather forecasting, air pollution modelling and environmental impact assessments.
 Schematic showing a variety of observation systems of relevance to National Meteorological and Hydrological Services.
 However, climate observations differ in a number of important respects. Firstly, climate observations need to account for the full range of elements that describe the climate system – not just those that describe the atmosphere. Extensive observations of the ocean and terrestrialbased systems are required.
 Secondly, an observation at any point in time needs a reference climate against which it can be evaluated, i. e. a reference climatological period must be selected. In this regard, the observations from a station that only exists for a short period (i. e. from days to a few years) or which relocates very frequently will generally be of less value than those observations from a station whose records have been maintained to established standards over many years. Thus, in order to derive a satisfactory climatological average (or normal) for a particular climate element, a sufficient period record of homogeneous, continuous and good quality observations for that element is required.
 Thirdly, a climate observation should be associated – either directly or indirectly - with a set of metadata that will provide users with information, often implicitly, on how the observation should be interpreted and used. So, while climate observations serve multiple purposes beyond specific climate needs, we must ensure that they retain, and acquire, particular characteristics that serve a range of climate needs.
 The basic monthly, seasonal and annual summaries of temperature, rainfall and other climate elements provide an essential resource for planning endeavors in areas such as agriculture, water resources, emergency management, urban design, insurance, energy supply and demand management and construction. Climate data, including historical daily data, are also unlocking important relationships between climate and health, including the effects of extreme heat and cold on mortality. The more stringent requirements on observation networks and systems for recording and monitoring climate, including the detection of climate change, has led to the development of special networks at national, regional and global (e. g. the Global Climate Observing System - GCOS - Surface Network, GSN) scales.
 is a joint undertaking") GCOS CLIMATE MONITORING PRINCIPLES GCOS (The Global Climate Observing System) is a joint undertaking of the World Meteorological Organization (WMO), the Intergovernmental Oceanographic Commission (IOC) of the United Nations Educational Scientific and Cultural Organization (UNESCO), the United Nations Environment Programme (UNEP) and the International Council for Science (ICSU). Its goal is to provide comprehensive information on the total climate system, involving a multidisciplinary range of physical, chemical and biological properties, and atmospheric, oceanic, hydrological, cryospheric and terrestrial processes.
GCOS CLIMATE MONITORING PRINCIPLES GCOS (The Global Climate Observing System) is a joint undertaking of the World Meteorological Organization (WMO), the Intergovernmental Oceanographic Commission (IOC) of the United Nations Educational Scientific and Cultural Organization (UNESCO), the United Nations Environment Programme (UNEP) and the International Council for Science (ICSU). Its goal is to provide comprehensive information on the total climate system, involving a multidisciplinary range of physical, chemical and biological properties, and atmospheric, oceanic, hydrological, cryospheric and terrestrial processes.
 Effective monitoring systems for climate should adhere to the following principles: 1. The impact of new systems or changes to existing systems should be assessed prior to implementation. 2. A suitable period of overlap for new and old observing systems is required. 3. The details and history of local conditions, instruments, operating procedures, data processing algorithms and other factors pertinent to interpreting data (i. e. , metadata) should be documented and treated with the same care as the data themselves. 4. The quality and homogeneity of data should be regularly assessed as a part of routine operations.
 Modern databases are providing efficient access to important station metadata, including photographs, site plans and other useful documents.
 5. Consideration of the needs for environmental and climate -monitoring products and assessments, such as IPCC assessments, should be integrated into national, regional and global observing priorities. The Cape Grim Baseline Air Pollution Station on the remote north-western tip of Tasmania (Australia) samples air flowing from the Southern Ocean, largely free from anthropogenic pollutants.
 6. Operation of historically-uninterrupted stations and observing systems should be maintained. 7. High priority for additional observations should be focused on data-poor regions, poorlyobserved parameters, regions sensitive to change, and key measurements with inadequate temporal resolution. 8. Long-term requirements, including appropriate sampling frequencies, should be specified to network designers, operators and instrument engineers at the outset of system design and implementation. 9. The conversion of research observing systems to long -term operations in a carefully-planned manner should be promoted.
 10. Data management systems that facilitate access, use and interpretation of data and products should be included as essential elements of climate monitoring systems. One of the major differences between the observational requirements of climate and weather concerns the treatment of observations beyond a few hours of their collection. While the operational value of observations to weather forecasters usually rapidly depreciates, it does not for climatologists. Climate data management systems generally sit between the observation systems and the delivery and production of climate products and services.
 The fundamental role of observations, networks, climate data management systems and metadata in providing climate information.
 Take steps to") Furthermore, operators of satellite systems for monitoring climate need to: (a) Take steps to make radiance calibration, calibration-monitoring and satellite-to-satellite crosscalibration of the full operational constellation a part of the operational satellite system; and (b) Take steps to sample the Earth system in such a way that climate-relevant (diurnal, seasonal, and long-term interannual) changes can be resolved.
Furthermore, operators of satellite systems for monitoring climate need to: (a) Take steps to make radiance calibration, calibration-monitoring and satellite-to-satellite crosscalibration of the full operational constellation a part of the operational satellite system; and (b) Take steps to sample the Earth system in such a way that climate-relevant (diurnal, seasonal, and long-term interannual) changes can be resolved.
 Thus satellite systems for climate monitoring should adhere to the following specific principles: 11. Constant sampling within the diurnal cycle (minimizing the effects of orbital decay and orbit drift) should be maintained. 12. A suitable period of overlap for new and old satellite systems should be ensured for a period adequate to determine inter-satellite biases and maintain the homogeneity and consistency of timeseries observations.
") 13. Continuity of satellite measurements (i. e. elimination of gaps in the long-term record) through appropriate launch and orbital strategies should be ensured. 14. Rigorous pre-launch instrument characterization and calibration, including radiance confirmation against an international radiance scale provided by a national metrology institute, should be ensured. 15. On-board calibration adequate for climate system observations should be ensured and associated instrument characteristics monitored.
13. Continuity of satellite measurements (i. e. elimination of gaps in the long-term record) through appropriate launch and orbital strategies should be ensured. 14. Rigorous pre-launch instrument characterization and calibration, including radiance confirmation against an international radiance scale provided by a national metrology institute, should be ensured. 15. On-board calibration adequate for climate system observations should be ensured and associated instrument characteristics monitored.
 16. Operational production of priority climate products should be sustained and peer-reviewed new products should be introduced as appropriate. 17. Data systems needed to facilitate user access to climate products, metadata and raw data, including key data for delayed-mode analysis, should be established and maintained. 18. Use of functioning baseline instruments that meet the calibration and stability requirements stated above should be maintained for as long as possible, even when these exist on decommissioned satellites.
 19. Complementary in situ baseline observations for satellite measurements should be maintained through appropriate activities and cooperation. 20. Random errors and time-dependent biases in satellite observations and derived products should be identified.
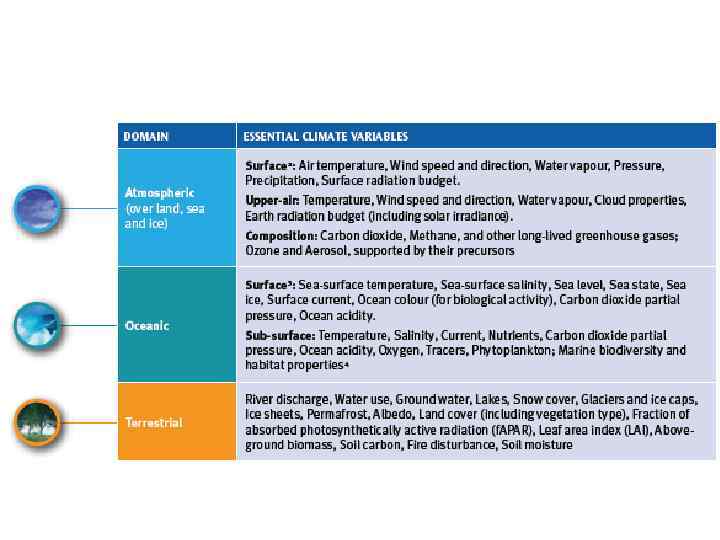
 The Essential Climate Variables (ECVs) are required to support") GCOS Essential Climate Variables (ECVs) The Essential Climate Variables (ECVs) are required to support the work of the UNFCCC and the IPCC. All ECVs are technically and economically feasible for systematic observation. It is these variables for which international exchange is required for both current and historical observations. Additional variables required for research purposes are not included in this table. It is emphasized that the ordering within the table is simply for convenience and is not an indicator of relative priority.
GCOS Essential Climate Variables (ECVs) The Essential Climate Variables (ECVs) are required to support the work of the UNFCCC and the IPCC. All ECVs are technically and economically feasible for systematic observation. It is these variables for which international exchange is required for both current and historical observations. Additional variables required for research purposes are not included in this table. It is emphasized that the ordering within the table is simply for convenience and is not an indicator of relative priority.