
Chile, advantages and opportunities About Chile


ppt_chile_general_final_en_ingles.ppt
- Размер: 2.4 Mегабайта
- Количество слайдов: 45
Описание презентации Chile, advantages and opportunities About Chile по слайдам
Chile, advantages and opportunities
About Chile, land of opportunities Investments Our export line-up
About Chile
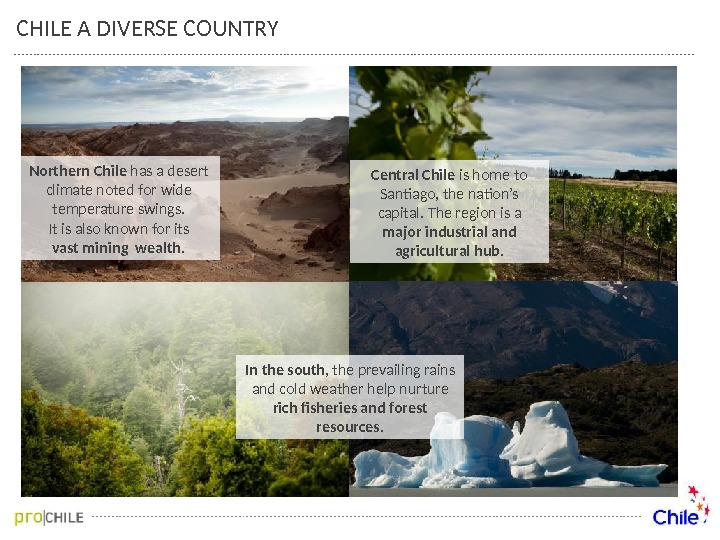
CHILE A DIVERSE COUNTRY Northern Chile has a desert climate noted for wide temperature swings. It is also known for its vast mining wealth. Central Chile is home to Santiago, the nation’s capital. The region is a major industrial and agricultural hub. In the south , the prevailing rains and cold weather help nurture rich fisheries and forest resources.
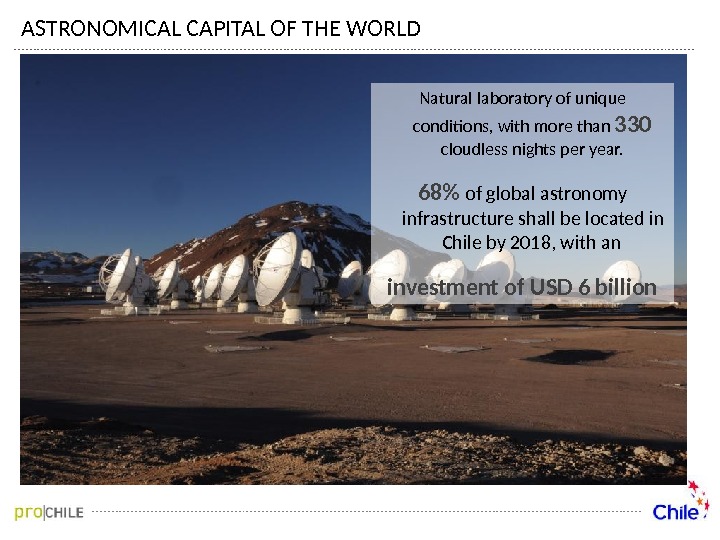
ASTRONOMICAL CAPITAL OF THE WORLD Natural laboratory of unique conditions, with more than 330 cloudless nights per year. 68% of global astronomy infrastructure shall be located in Chile by 2018, with an investment of USD 6 billion
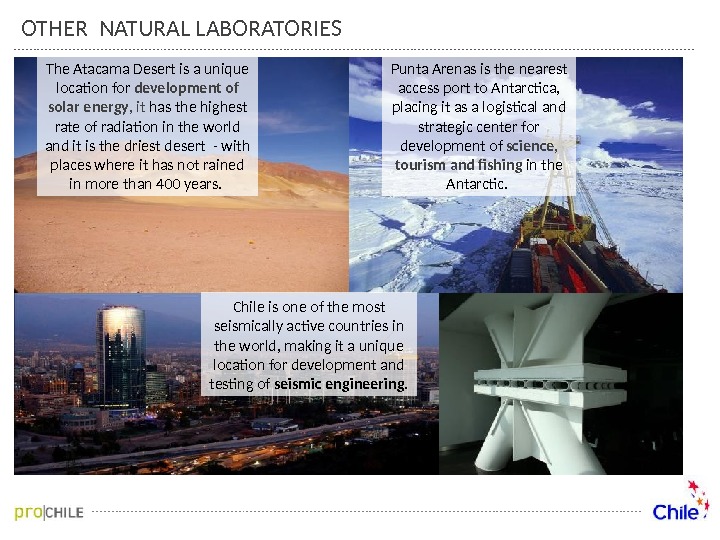
OTHER NATURAL LABORATORIES Chile is one of the most seismically active countries in the world, making it a unique location for development and testing of seismic engineering. The Atacama Desert is a unique location for development of solar energy , it has the highest rate of radiation in the world and it is the driest desert — with places where it has not rained in more than 400 years. Punta Arenas is the nearest access port to Antarctica, placing it as a logistical and strategic center for development of science, tourism and fishing in the Antarctic.
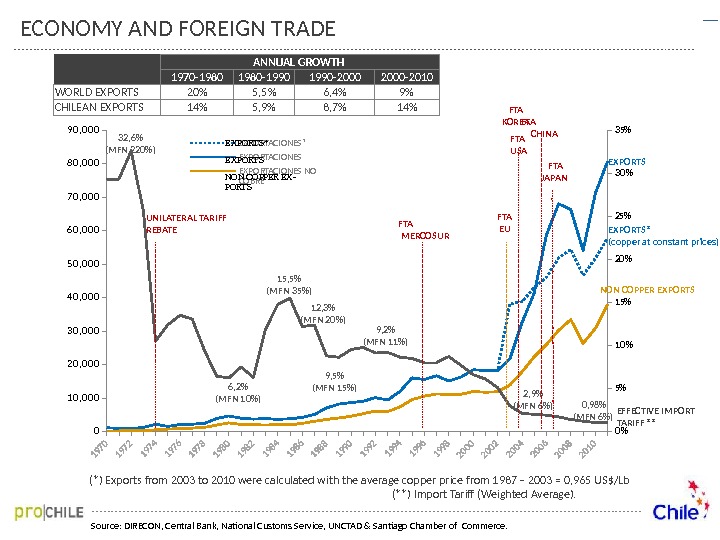
010 , 0 0 020 , 0 0 03 0 , 0 0 04 0 , 0 0 0 50 , 0 0 06 0 , 0 0 0 70 , 0 0 08 0 , 0 0 09 0 , 0 0 %5%10 %15%20 %25%30 %35% EXPORTACIONES* EXPORTACIONES NO COBREEXPORT S* EXPORT S NON COPPER EX — PORT S 32, 6% (MFN 220%) 6, 2% (MFN 10%) 15, 5% (MFN 35%) 12, 3% (MFN 20%) 9, 5% (MFN 15%) 9, 2% (MFN 11%) 2, 9% (MFN 6%) 0, 98% (MFN 6%)UNILATERAL TARIFF REBATE FTA MERCOSUR FTA EU FTA USA FTA CHINA (*) Exports from 2003 to 2010 were calculated with the average copper price from 1987 – 2003 = 0, 965 US$/Lb (**) Import Tariff (Weighted Average). ANNUAL GROWTH 1970 -1980 -1990 -2000 -2010 WORLD EXPORTS 20% 5, 5% 6, 4% 9% CHILEAN EXPORTS 14% 5, 9% 8, 7% 14% EXPORTS* (copper at constant prices)EXPORTS NON COPPER EXPORTS EFFECTIVE IMPORT TARIFF **FTA JAPAN FTA KOREA Source: DIRECON, Central Bank, National Customs Service, UNCTAD & Santiago Chamber of Commerce. ECONOMY AND FOREIGN TR
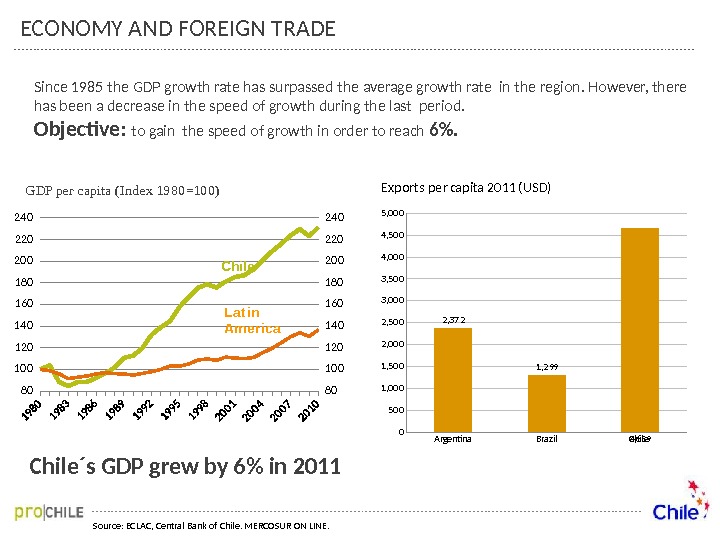
ECONOMY AND FOREIGN TRADE Chile´s GDP grew by 6% in 2011 Source: ECLAC, Central Bank of Chile. MERCOSUR ON LINE. Argentina Brazil Chile 05001, 0001, 5002, 0002, 5003, 0003, 500 4, 0004, 5005, 000 2, 372 1, 299 4, 659 Exports per capita 2011 (USD)Since 1985 the GDP growth rate has surpassed the average growth rate in the region. However, there has been a decrease in the speed of growth during the last period. Objective: to gain the speed of growth in order to reach 6%. 80 10 0 120 14 0 160 180 20 0 220 24 0 Chile Lat in America GDP per capita (Index 1980=100)
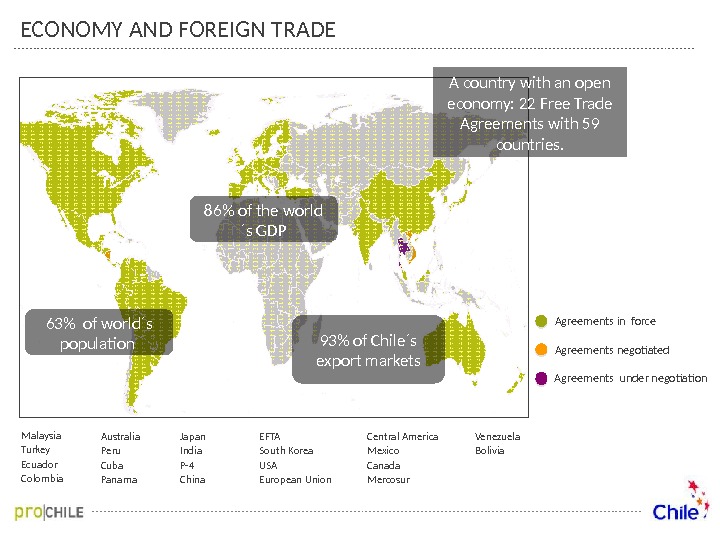
Chile, un país abierto al mundo ECONOMY AND FOREIGN TRADE Agreements in force Agreements negotiated Agreements under negotiation EFTA South Korea USA European Union Japan India P-4 China Australia Peru Cuba Panama Malaysia Turkey Ecuador Colombia Central America Mexico Canada Mercosur Venezuela Bolivia A country with an open economy: 22 Free Trade Agreements with 59 countries. 63% of world´s population 86% of the world ´s GDP 93% of Chile´s export markets
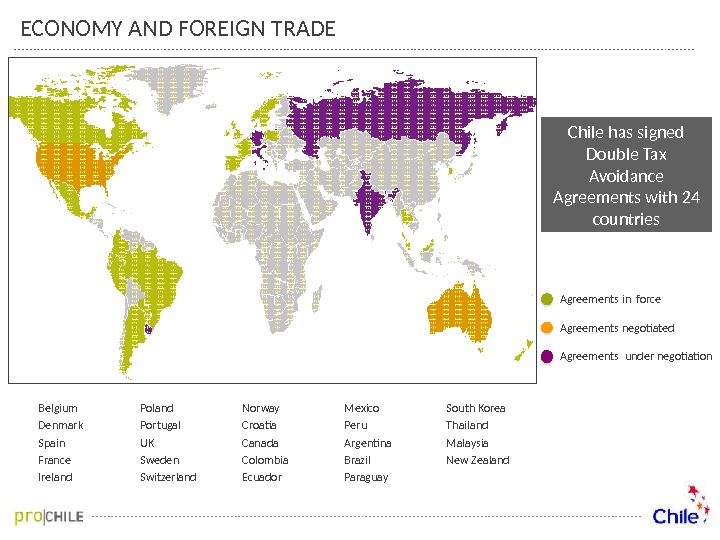
ECONOMY AND FOREIGN TRADE Agreements in force Agreements negotiated Agreements under negotiation Belgium Denmark Spain France Ireland Portugal UK Sweden Switzerland Norway Croatia Canada Colombia Ecuador Mexico Peru Argentina Brazil Paraguay South Korea Thailand Malaysia New Zealand Chile has signed Double Tax Avoidance Agreements with 24 countries
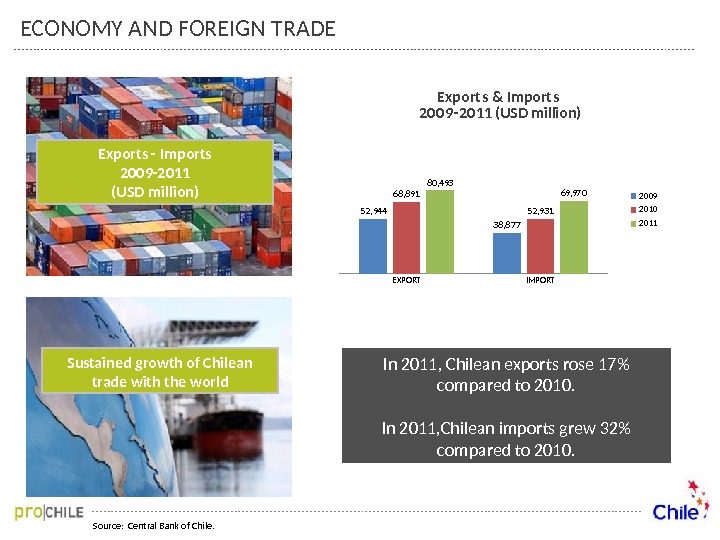
Source: Central Bank of Chile. Exports — Imports 2009 -2011 (USD million) Sustained growth of Chilean trade with the world EXPORT IMPORT 52, 944 38, 87768, 891 52, 93180, 493 69, 970 Export s & Import s 20 0 9 -20 11 (USD million) 2 009 2 010 2 011 ECONOMY AND FOREIGN TRADE In 2011, Chilean exports rose 17% compared to 2010. In 2011, Chilean imports grew 32% compared to 2010.
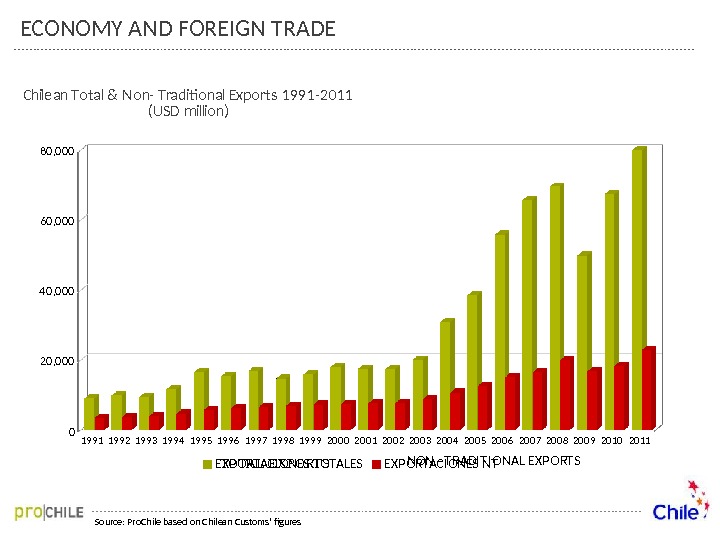
ECONOMY AND FOREIGN TRADE Source: Pro. Chile based on Chilean Customs’ figures 19 9 1 19 9 2 19 9 3 19 9 4 19 9 5 19 9 6 19 9 7 19 9 8 19 9 9 20 0 0 20 0 1 20 0 2 20 0 3 20 0 4 20 0 5 20 0 6 20 0 7 20 0 8 20 0 9 20 10 20 11020 , 0 0 04 0 , 0 0 0 60 , 0 0 080 , 0 0 0 Chilean Total & Non- Traditional Exports 1991 -2011 (USD million) EXPORTACIONES TOTALES EXPORTACIONES NTTOTAL EXPORTS NON –T RADIT IONAL EXPORTS
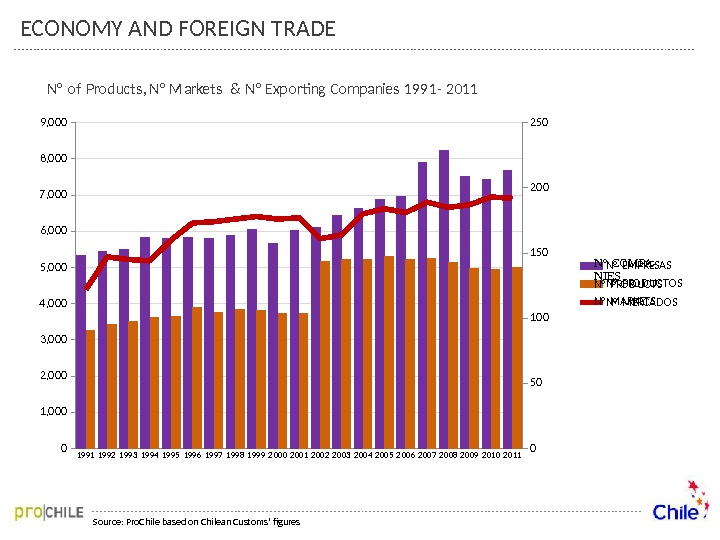
ECONOMY AND FOREIGN TRADE 1991 1992 1993 1994 1995 1996 1997 1998 1999 2 000 2 001 2 002 2 003 2 004 2 005 2 006 2 007 2 008 2 009 2 010 2 01101, 0 0 02, 0 0 03, 0 0 04 , 0 0 0 5, 0 0 06, 0 0 07 , 0 0 0 8, 0 0 09, 0 05010 015020 0250 N° of Products, N° Markets & N° Exporting Companies 1991 — 2011 N° EMPRESAS N° PRODUCTOS N° MERCADOSN° COMPA — NIES N° MARKETSN° PRODUCTS Source: Pro. Chile based on Chilean Customs’ figures
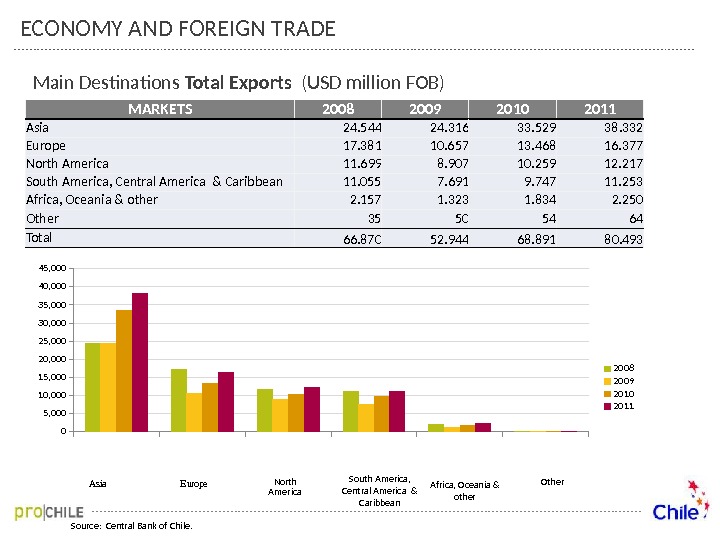
Main Destinations Total Exports (USD million FOB) Source: Central Bank of Chile. 05, 00010, 00015, 00020, 00025, 00030, 00035, 000 40, 00045, 000 2008 2009 2010 2011 E urope North America Other Asia MARKETS 2008 2009 2010 2011 Asia 24. 544 24. 316 33. 529 38. 332 Europe 17. 381 10. 657 13. 468 16. 377 North America 11. 699 8. 907 10. 259 12. 217 South America, Central America & Caribbean 11. 055 7. 691 9. 747 11. 253 Africa, Oceania & other 2. 157 1. 323 1. 834 2. 250 Other 35 50 54 64 Total 66. 870 52. 944 68. 891 80. 493 ECONOMY AND FOREIGN TRADE South America, Central America & Caribbean Africa, Oceania & other
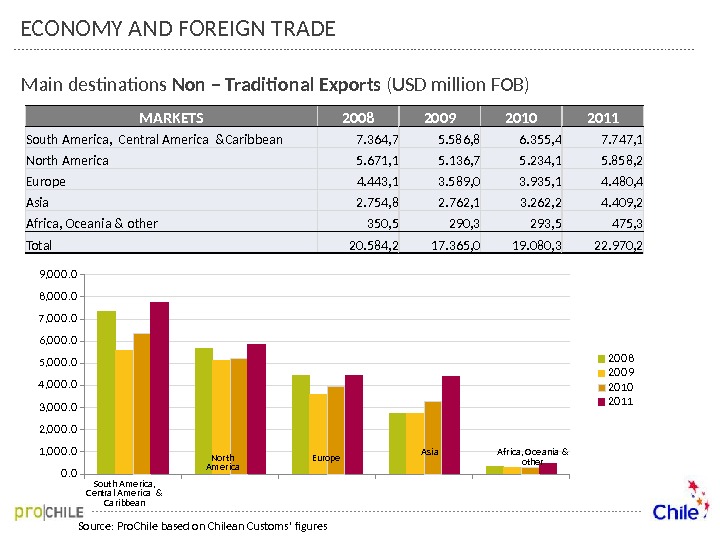
Main destinations Non – Traditional Exports (USD million FOB) Source: Pro. Chile based on Chilean Customs’ figures. América del Sur, Centroamérica y Caribe. EuropaÁf rica, Oceanía y otros 0. 0 1, 0 0 0. 0 2, 0 0 0. 0 3, 0 0 0. 0 4, 00 0. 0 5, 0 0 0. 0 6, 0 0 0. 0 7, 00 0. 0 8, 0 0 0. 0 9, 0 0 0. 0 20 0 8 20 0 9 20 10 20 11 South America , Centra l America & Caribbea n North America Europe. As ia. Africa , Oceania & other MARKETS 2008 2009 2010 2011 South America, Central America &Caribbean 7. 364, 7 5. 586, 8 6. 355, 4 7. 747, 1 North America 5. 671, 1 5. 136, 7 5. 234, 1 5. 858, 2 Europe 4. 443, 1 3. 589, 0 3. 935, 1 4. 480, 4 Asia 2. 754, 8 2. 762, 1 3. 262, 2 4. 409, 2 Africa, Oceania & other 350, 5 290, 3 293, 5 475, 3 Total 20. 584, 2 17. 365, 0 19. 080, 3 22. 970, 2 ECONOMY AND FOREIGN TR
FOREIGN TRADE — SECTORS Source: Pro. Chile based on Central Bank of Chile´s figures Sectors FOB 2009 (USD million) FOB 2010 (USD million) FOB 2011 (USD million) Food 10. 110 10. 750 12. 495 Forestry 4. 141 4. 922 5. 833 Manufacturing 24. 648 34. 682 40. 233 Minerals 10. 973 15. 466 18. 228 Other 2. 229 2. 175 2. 590 Services* 842 896 1. 114 Total 52. 944 68. 891 80. 493 Food FOB 2009 (USD million) FOB 2010 (USD million) FOB 2011 (USD million) Agriculture 5. 625 6. 254 6. 689 Seafood Products 3. 098 2. 939 4. 101 Wines 1. 388 1. 558 1. 704 Total 10. 110 10. 750 12. 495 • Services considers only code 0025. 0000 “Services considered for export. “
Chile, land of opportunities
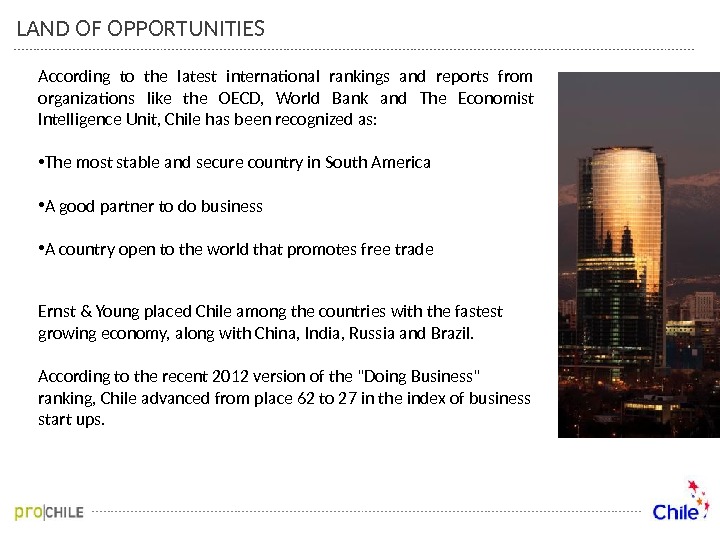
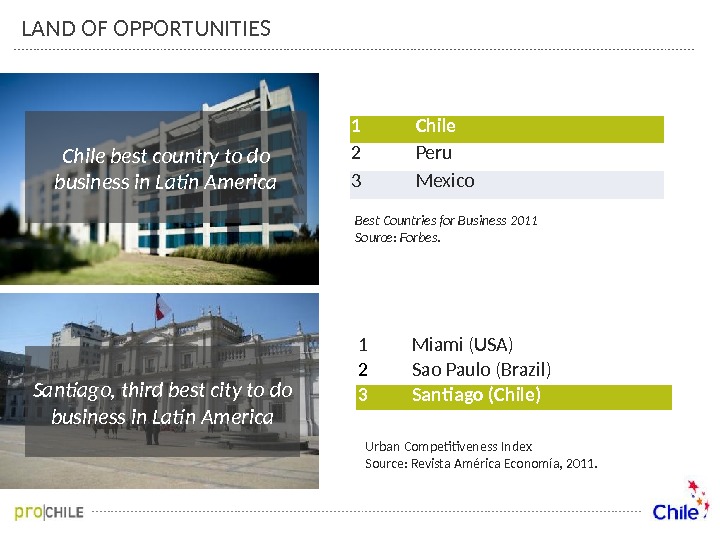
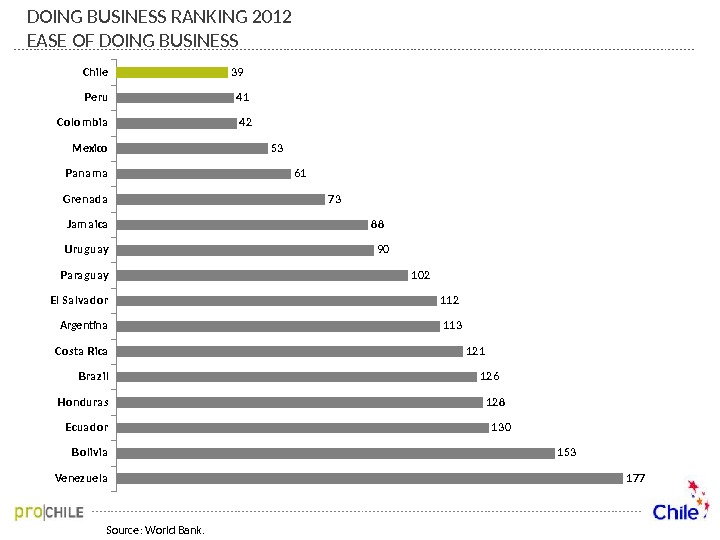
According to the latest international rankings and reports from organizations like the OECD, World Bank and The Economist Intelligence Unit, Chile has been recognized as: • The most stable and secure country in South America • A good partner to do business • A country open to the world that promotes free trade Ernst & Young placed Chile among the countries with the fastest growing economy, along with China, India, Russia and Brazil. According to the recent 2012 version of the «Doing Business» ranking, Chile advanced from place 62 to 27 in the index of business start ups. LAND OF OPPORTUNITIES
Best Countries for Business 2011 Source: Forbes. 1 Chile 2 Peru 3 Mexico. Chile best country to do business in Latin America Santiago, third best city to do business in Latin America 1 Miami (USA) 2 Sao Paulo (Brazil) 3 Santiago (Chile) Urban Competitiveness Index Source: Revista América Economía, 2011. LAND OF OPPORTUNITIES
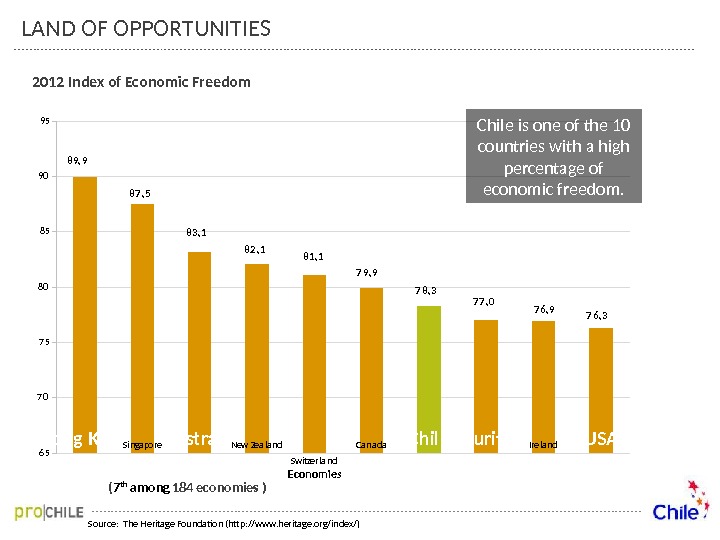
2012 Index of Economic Freedom Source: The Heritage Foundation (http: //www. heritage. org/index/)6 57 0 7 580 8590 95 Hong Kong Singapore Australia New Zealand Switzerland Canada Chile Mauritius Ireland USA 89, 9 87 , 5 83, 1 82 , 1 81, 1 7 9, 9 7 8, 3 7 7 , 0 7 6, 9 7 6, 3 Chile is one of the 10 countries with a high percentage of economic freedom. LAND OF OPPORTUNITIES Economies ( 7 th among 184 economies )
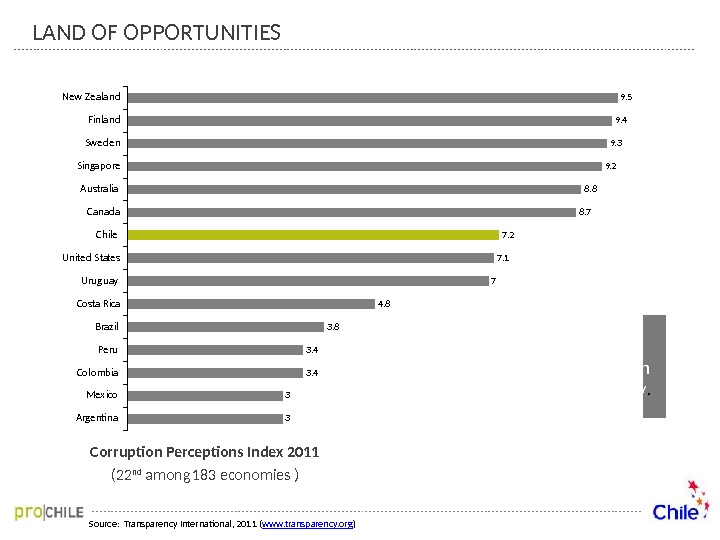
Corruption Perceptions Index 2011 ( 22 nd among 183 economies ) Source: Transparency International, 2011 ( www. transparency. org ) Among the least corrupt countries in the world with high levels of transparency. Argentina Mexico Colombia Peru Brazil Costa Rica Uruguay Unite d States Chile Canada. Australia Singapore Swe den Finland. New Zealand 33 3. 4 3. 8 4. 8 7 7. 1 7. 2 8. 7 8. 8 9. 2 9. 3 9. 4 9. 5 LAND OF OPPORTUNITIES
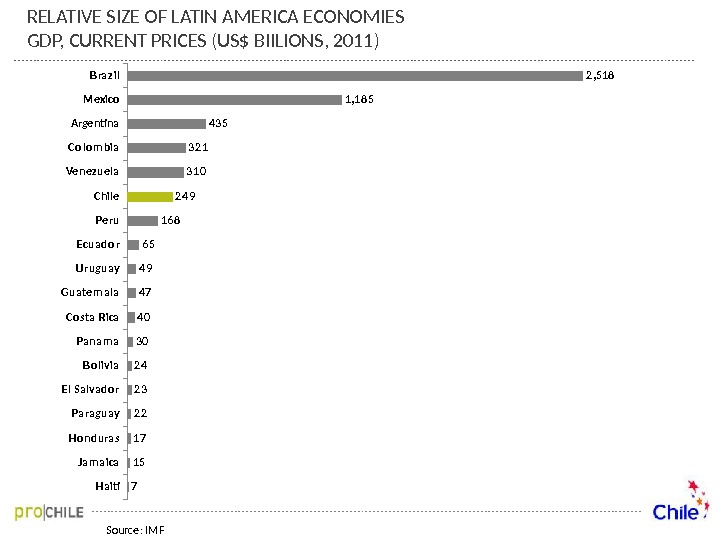
Ha iti. Ja m a ica. Ho ndura s Pa ra guay. El Sa lva do r B o livia. Pa na m a. Co sta Rica. Guate m a la Uruguay Ecua do r Pe ru. Chile. Ve nezue la Co lo m bia Arge ntina Mexico B ra z il 7 1 5 1 7 2 2 2 3 2 4 3 0 4 7 4 9 6 5 1 6 8 2 4 9 3 1 0 3 2 1 4 3 5 1 , 1 8 5 2 , 51 8 Source: IMFRELATIVE SIZE OF LATIN AMERICA ECONOMIES GDP, CURRENT PRICES (US$ BIILIONS, 2011)
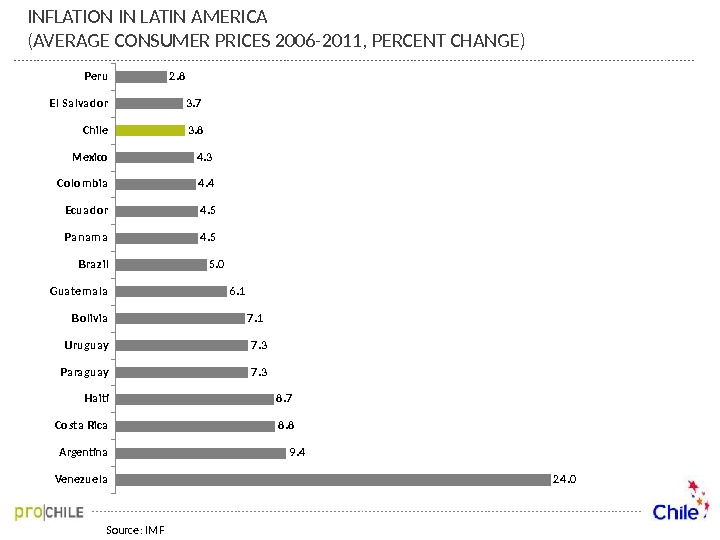
Ve nezue la Arge ntina. Co sta Rica Ha iti. Pa ra guay Uruguay B o livia. G uate m a la B ra z il. Pa na m a Ecua do r. Co lo m bia Mexico Chile. El Sa lva do r Pe ru 2 4. 09. 48. 88. 77. 37. 16. 15. 04. 54. 44. 33. 83. 72. 8 INFLATION IN LATIN AMERICA (AVERAGE CONSUMER PRICES 2006 -2011, PERCENT CHANGE) Source: IM
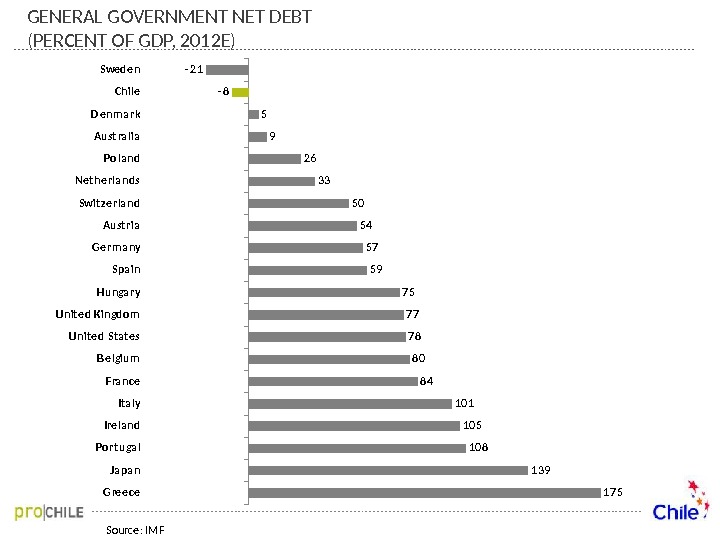
Gre e ce Ja pa n Po rt uga l Ire la nd Ita ly Fra nce B e lgium Unite d State s Unite d Kingdo m Hunga ry Spa in G e rm a ny Aust ria Swit ze rla nd Net he rla nds Po la nd Aust ra lia D e nm a rk Chile Swe de n 1 7 5 1 3 9 1 0 8 1 0 5 1 0 1 8 4 8 0 7 8 7 7 7 5 59 57 54 50 3 3 2 6 9 5 — 8 — 2 1 GENERAL GOVERNMENT NET DEBT (PERCENT OF GDP, 2012 E) Source: IM
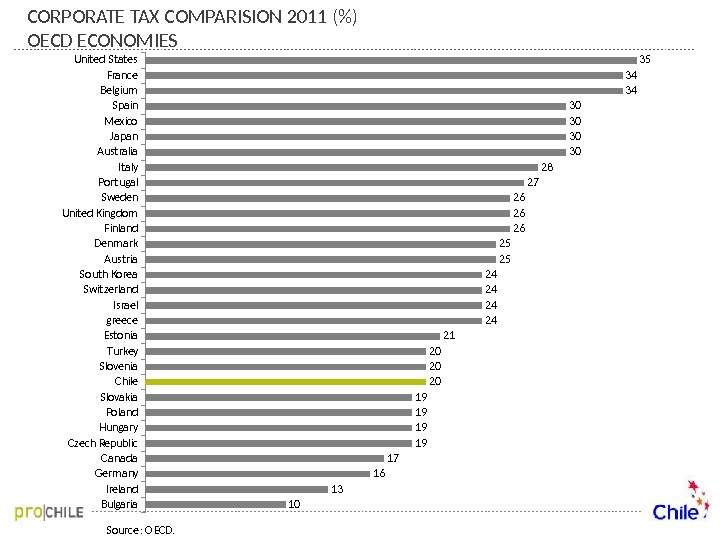
United States France Belgium Spain Mexico Japan Australia Italy Portugal Sweden United Kingdom Finland Denmark Austria South Korea Switzerland Israel greece Estonia Turkey Slovenia Chile Slovakia Poland Hungary Czech Republic Canada Germany Ireland Bulgaria 35 34 34 30 30 28 27 26 26 26 25 25 24 24 21 20 20 20 19 19 17 16 13 10 CORPORATE TAX COMPARISION 2011 (%) OECD ECONOMIES Source: OECD.
Chile Pe ru Co lo m bia Mexico Pa na m a G re na da Ja m a ica Uruguay Pa ra guay El Sa lva do r Arge ntina Co sta Rica B ra z il Ho ndura s Ecua do r B o livia Ve nezue la 3 9 4 1 4 2 53 6 1 7 3 8 8 9 0 1 0 2 1 1 3 1 2 1 1 2 6 1 2 8 1 3 0 1 53 1 7 7 DOING BUSINESS RANKING 2012 EASE OF DOING BUSINESS Source: World Bank.
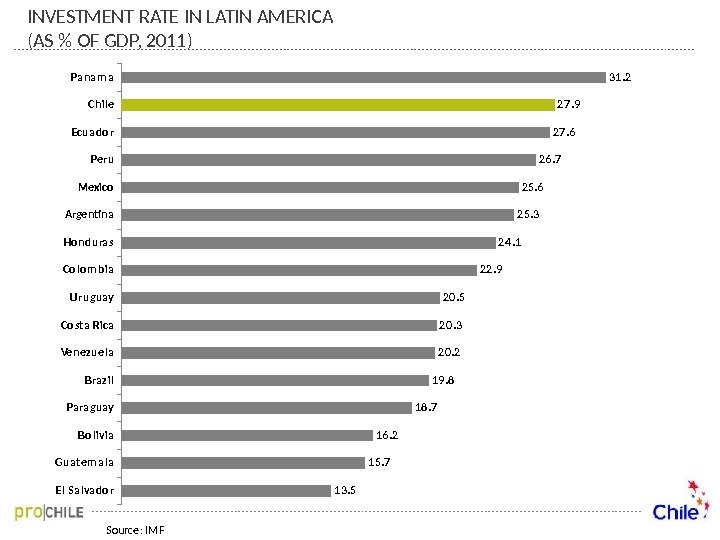
Pa na m a Chile Ecua do r Pe ru Mexico Arge ntina Ho ndura s Co lo m bia Uruguay Co sta Rica Ve nezue la B ra z il Pa ra guay B o livia G uate m a la El Sa lva do r 3 1. 2 2 7. 9 2 7. 6 2 6. 7 2 5. 6 2 5. 3 2 4. 1 2 2. 9 2 0. 5 2 0. 3 2 0. 2 1 9. 8 1 8. 7 1 6. 2 1 5. 7 1 3. 5 INVESTMENT RATE IN LATIN AMERICA (AS % OF GDP, 2011) Source: IM
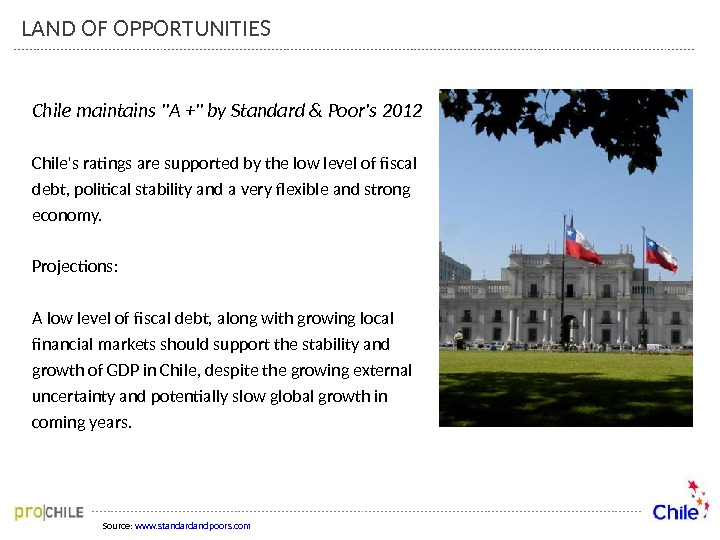
Source: www. standardandpoors. com. Chile maintains «A +» by Standard & Poor’s 2012 Chile’s ratings are supported by the low level of fiscal debt, political stability and a very flexible and strong economy. Projections: A low level of fiscal debt, along with growing local financial markets should support the stability and growth of GDP in Chile, despite the growing external uncertainty and potentially slow global growth in coming years. LAND OF OPPORTUNITIES
Investments
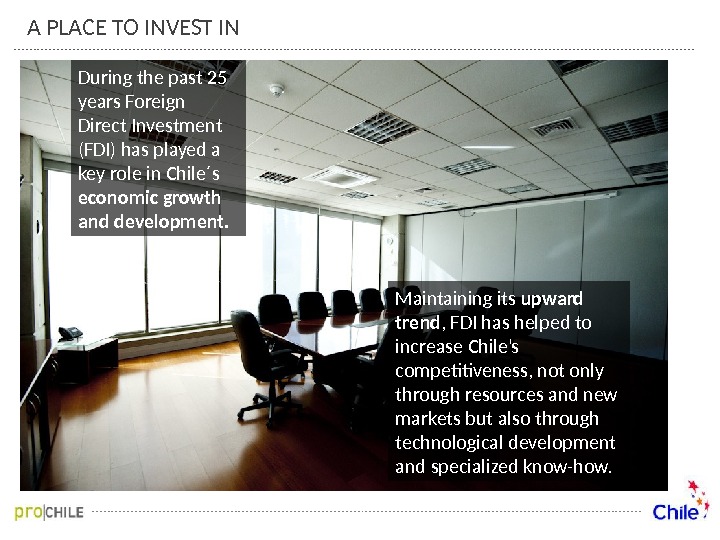
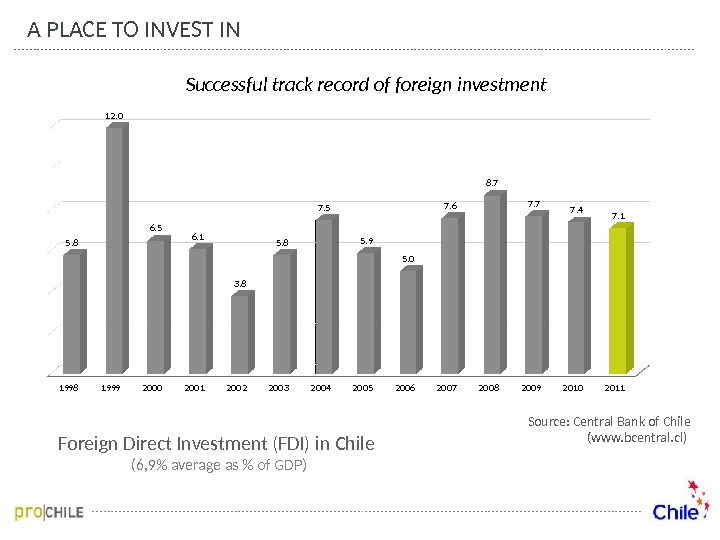
During the past 25 years Foreign Direct Investment (FDI) has played a key role in Chile´s economic growth and development. Maintaining its upward trend , FDI has helped to increase Chile’s competitiveness, not only through resources and new markets but also through technological development and specialized know-how. A PLACE TO INVEST IN
Foreign Direct Investment (FDI) in Chile (6, 9% average as % of GDP) Source: Central Bank of Chile (www. bcentral. cl) Successful track record of foreign investment. A PLACE TO INVEST IN 19981999200020012002200320042005200620072008200920102011 5. 8 12. 0 6. 56. 1 3. 8 5. 8 7. 5 5. 9 5. 0 7. 6 8. 7 7. 77. 47.
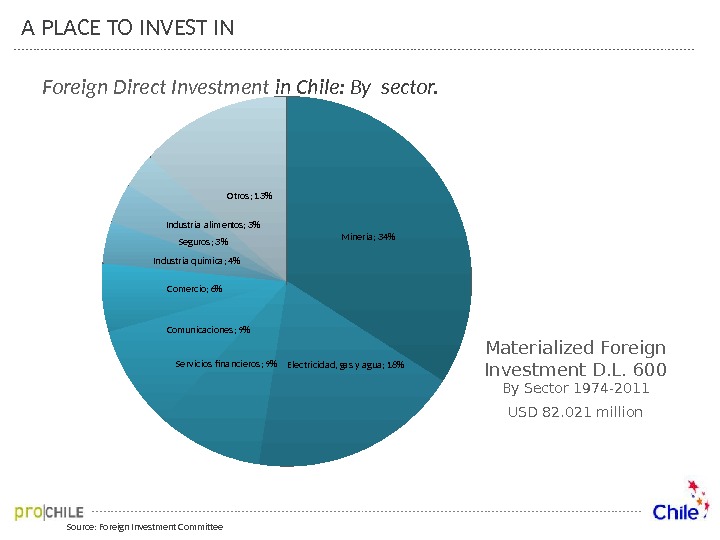
Source: Foreign Investment Committee. Foreign Direct Investment in Chile: By sector. A PLACE TO INVEST IN Materialized Foreign Investment D. L. 600 By Sector 1974 -2011 USD 82. 021 million. Minería; 34% Electricidad, gas y agua; 18%Servicios financieros ; 9%Comunicaciones ; 9% Comercio; 6%Industria química; 4% Seguros ; 3%Industria alimentos ; 3% Otros ; 13%
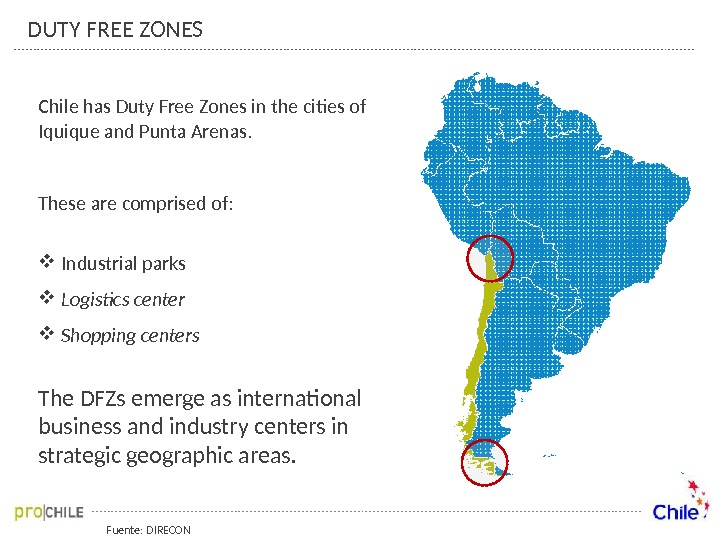
Fuente: DIRECONDUTY FREE ZONES Chile has Duty Free Zones in the cities of Iquique and Punta Arenas. These are comprised of: Industrial parks Logistics center Shopping centers The DFZs emerge as international business and industry centers in strategic geographic areas.
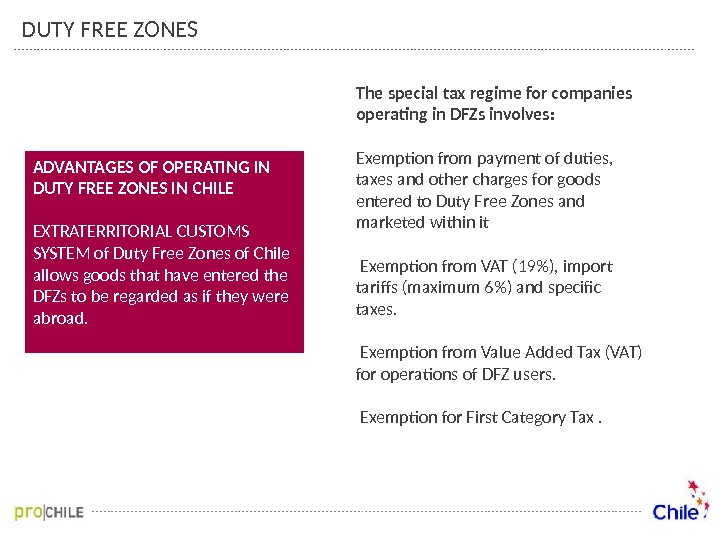
The special tax regime for companies operating in DFZs involves: Exemption from payment of duties, taxes and other charges for goods entered to Duty Free Zones and marketed within it Exemption from VAT (19%), import tariffs (maximum 6%) and specific taxes. Exemption from Value Added Tax (VAT) for operations of DFZ users. Exemption for First Category Tax. ADVANTAGES OF OPERATING IN DUTY FREE ZONES IN CHILE EXTRATERRITORIAL CUSTOMS SYSTEM of Duty Free Zones of Chile allows goods that have entered the DFZs to be regarded as if they were abroad. DUTY FREE ZONES
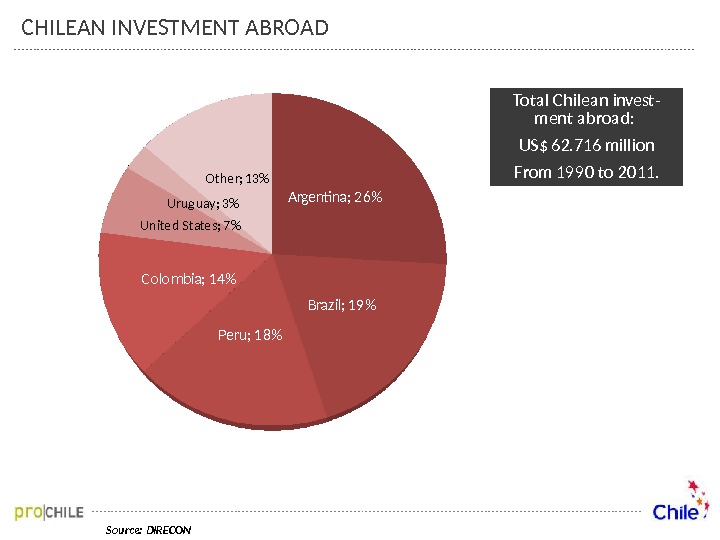
Source: DIRECON Argentina; 26% Brazil; 19% Peru; 18%Colombia; 14%United States; 7% Urug uay; 3% Other; 13% Total Chilean invest — ment abroad: US$ 62. 716 million From 1990 to 2011. CHILEAN INVESTMENT ABRO
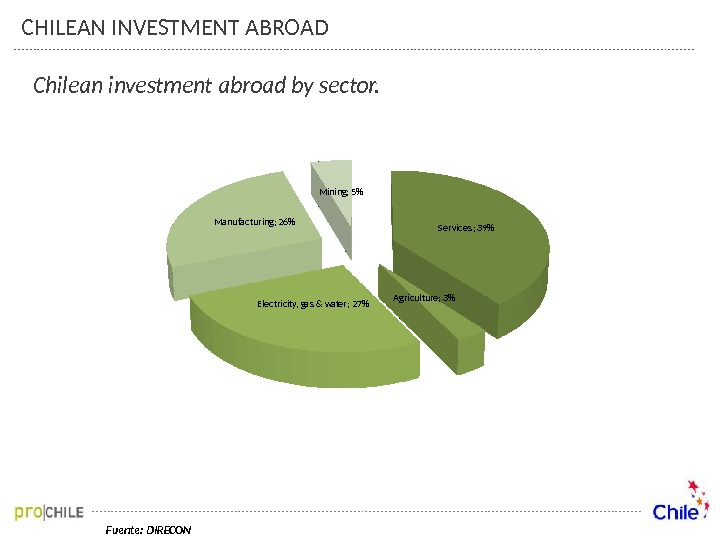
Fuente: DIRECON Services ; 39% Agriculture; 3% Electricity, gas & water; 27%Manufacturing; 26% Mining; 5%Chilean investment abroad b y sector. CHILEAN INVESTMENT ABRO
OUR EXPORT LINE UP
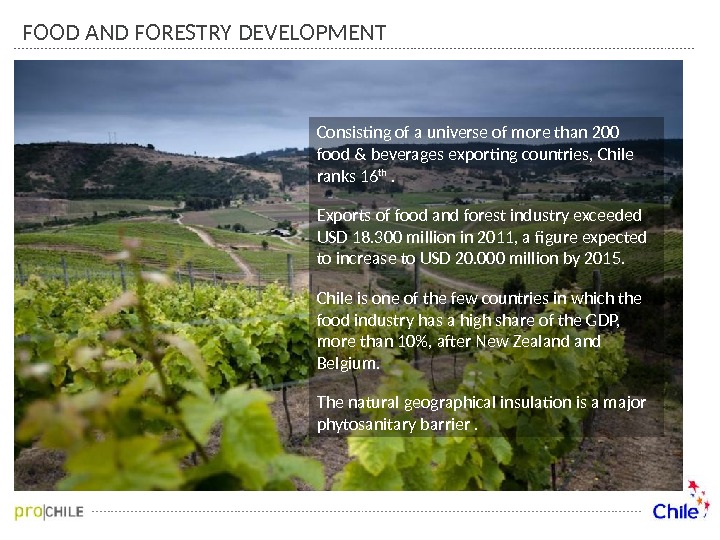
FOOD AND FORESTRY DEVELOPMENT Consisting of a universe of more than 200 food & beverages exporting countries, Chile ranks 16 th . Exports of food and forest industry exceeded USD 18. 300 million in 2011, a figure expected to increase to USD 20. 000 million by 2015. Chile is one of the few countries in which the food industry has a high share of the GDP, more than 10%, after New Zealand Belgium. The natural geographical insulation is a major phytosanitary barrier.
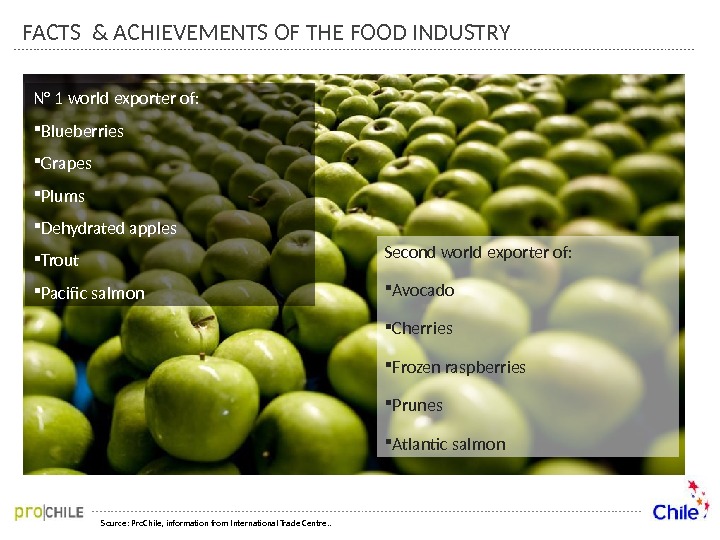
N° 1 world exporter of: Blueberries Grapes Plums Dehydrated apples Trout Pacific salmon Second world exporter of: Avocado Cherries Frozen raspberries Prunes Atlantic salmon Source: Pro. Chile, information from International Trade Centre. . FACTS & ACHIEVEMENTS OF THE FOOD INDUSTRY
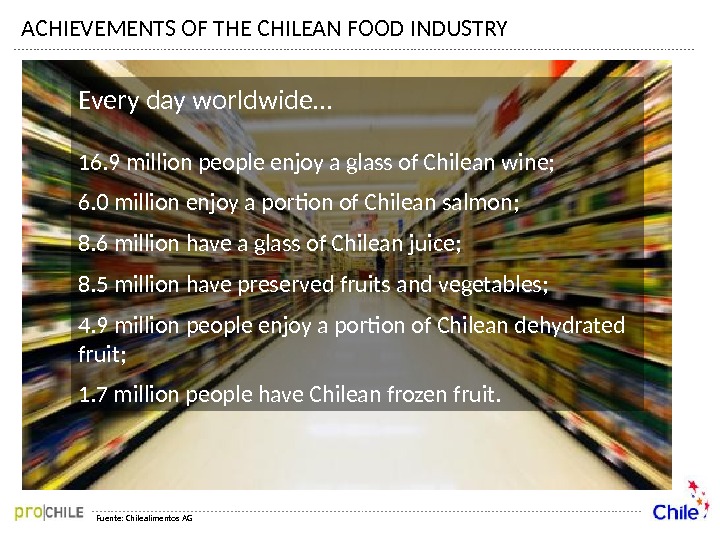
ACHIEVEMENTS OF THE CHILEAN FOOD INDUSTRY Fuente: Chilealimentos AGEvery day worldwide… 16. 9 million people enjoy a glass of Chilean wine; 6. 0 million enjoy a portion of Chilean salmon; 8. 6 million have a glass of Chilean juice; 8. 5 million have preserved fruits and vegetables; 4. 9 million people enjoy a portion of Chilean dehydrated fruit; 1. 7 million people have Chilean frozen fruit.
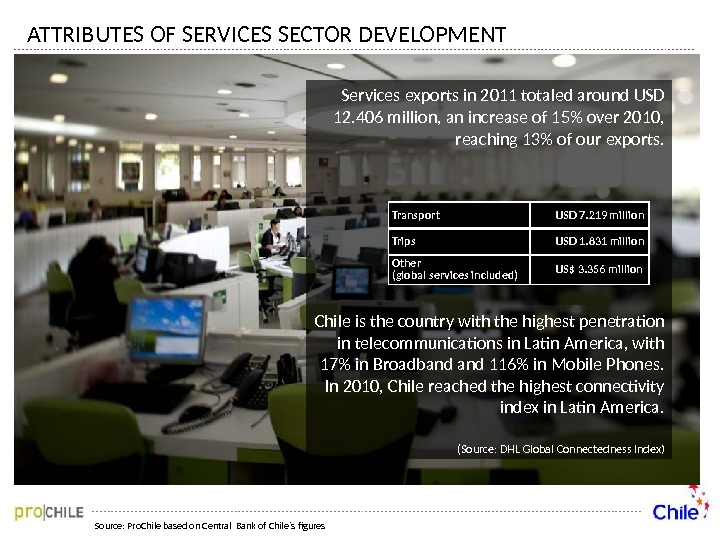
ATTRIBUTES OF SERVICES SECTOR DEVELOPMENT Source: Pro. Chile based on Central Bank of Chile´s figures Services exports in 2011 totaled around USD 12. 406 million, an increase of 15% over 2010, reaching 13% of our exports. Chile is the country with the highest penetration in telecommunications in Latin America, with 17% in Broadband 116% in Mobile Phones. In 2010, Chile reached the highest connectivity index in Latin America. (Source: DHL Global Connectedness Index) Transport USD 7. 219 million Trips USD 1. 831 million Other (global services included) US$ 3. 356 million
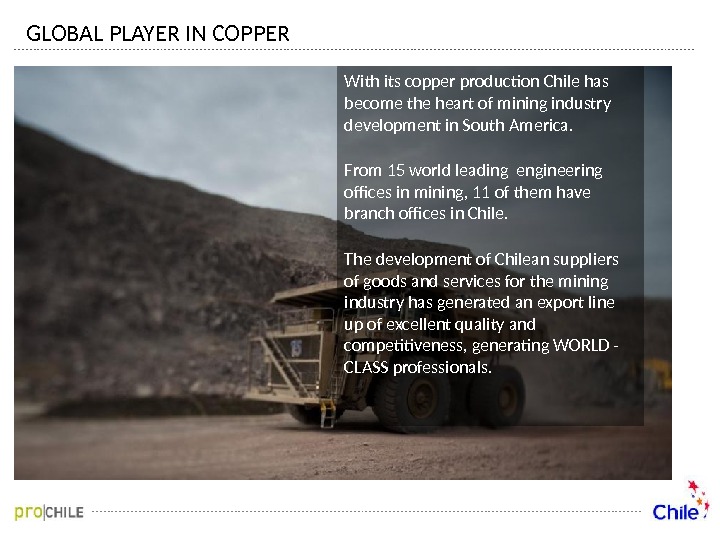
GLOBAL PLAYER IN COPPER With its copper production Chile has become the heart of mining industry development in South America. From 15 world leading engineering offices in mining, 11 of them have branch offices in Chile. The development of Chilean suppliers of goods and services for the mining industry has generated an export line up of excellent quality and competitiveness, generating WORLD — CLASS professionals.
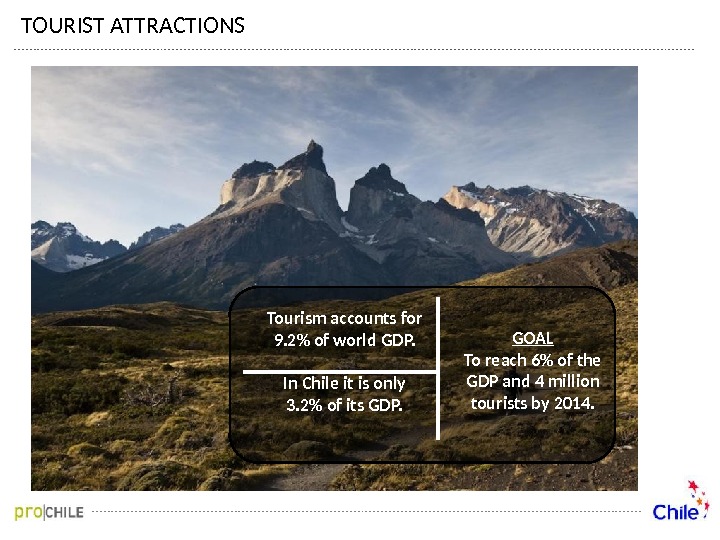
TOURIST ATTRACTIONS Tourism accounts for 9. 2% of world GDP. In Chile it is only 3. 2% of its GDP. GOAL To reach 6% of the GDP and 4 million tourists by 2014.
FOR FURTHER INFORMATION General Information www. thisischile. cl Trade Information www. prochile. gob. cl/importadores Investments www. foreigninvestment. cl Tourism www. chile. travel